Manufacturing report latency is the silent bottleneck that undermines data-driven decision-making. When reports arrive 24 hours late and dashboards refresh once per shift, plant leaders make critical decisions on stale information. The gap between data generation and availability is the top reason analytics initiatives fail. This guide examines how leading manufacturers reduce latency from 24 hours to under 5 minutes by replacing batch ETL with streaming ingestion, deploying in-memory caches, and using pre-aggregated views. You will learn a six-week approach to auditing latency, identifying bottlenecks, and deploying a low-latency pipeline that puts current data in every operator’s hands.
Audit Your Plant’s Report Latency in 30 Minutes
A Structured Assessment That Maps Every Report’s Data Source, Pipeline Stage, and Current Latency Against Targets.
This free latency assessment walks you through a step-by-step audit of your plant’s reporting pipeline. You will inventory every report, measure current end-to-end latency, and compare against targets based on operational use cases. The output is a prioritised action plan showing which reports to fix first, the biggest bottlenecks, and achievable latency reduction within six weeks. Plant managers typically identify 60–80% reduction opportunities within existing infrastructure — without new hardware investments.
Report Latency Health Scoreboard
The scoreboard captures the transformation at a glance. Before optimisation, the average report took 24 hours to generate — a full day of stale data driving production decisions. After deploying streaming pipelines, incremental loads, and pre-aggregated views, average latency dropped to 3 minutes. Twelve data sources are now connected through the low-latency pipeline, and eight automations handle ingestion, transformation, and caching without manual intervention. These metrics define the gap between traditional batch reporting and modern streaming analytics.
Report Latency Before and After Optimisation
Every report type shows dramatic latency reduction after pipeline optimisation. Daily production reports dropped from 24 hours to 5 minutes — a 99.7% reduction. Quality reports that took two full days now complete in 2 minutes. OEE reports, historically the most latency-sensitive KPI, update in under 60 seconds. The common thread across all six report types is the elimination of batch wait time: streaming ingestion, incremental transforms, and pre-aggregated views remove the hours-long gaps between data generation and dashboard availability.
End-to-End Pipeline Latency: Before vs After at Each Stage
The pipeline SVG breaks down end-to-end latency into six stages, showing the before and after at each step. Ingestion drops from 2 hours to 30 seconds when batch file transfers are replaced with MQTT streaming. Processing drops from 4 hours to 45 seconds when full-table ETL transforms are converted to incremental stream processing. Storage and query latency shrink with columnar databases and in-memory caches. The pipeline view makes it clear where the biggest gains come from and which stage to prioritise in your own latency reduction effort.
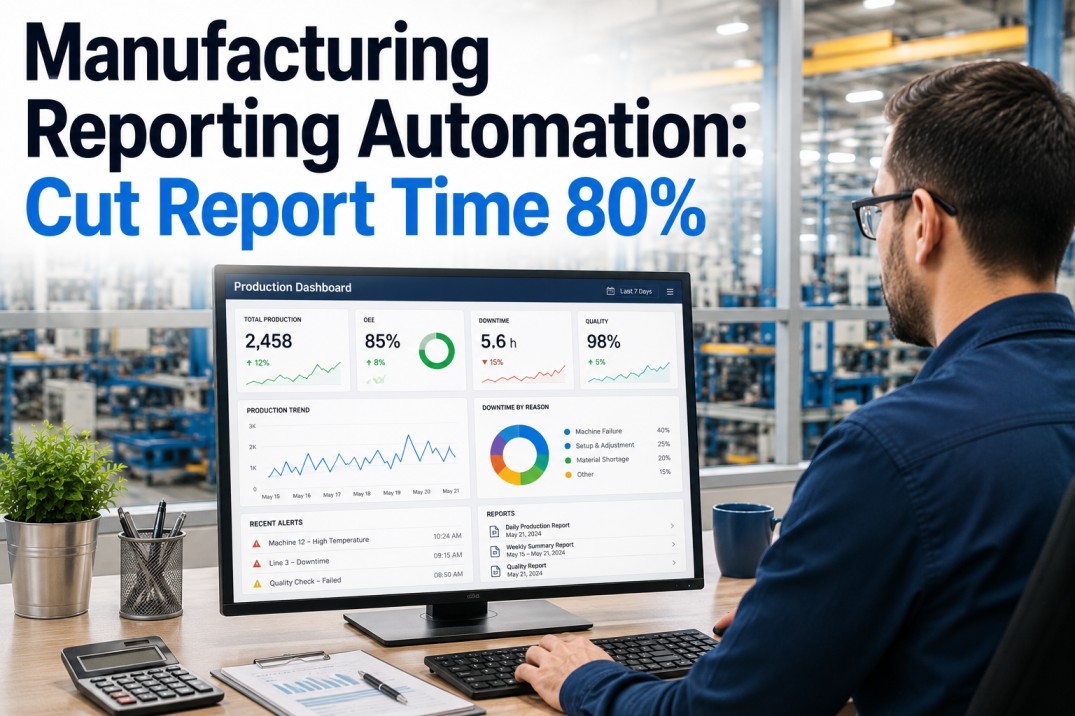
See the Latency-Reduced Dashboard — Before vs After
A Live Comparison Showing the Same Report at 24-Hour Latency vs 3-Minute Latency on iFactory’s Platform.
See side-by-side dashboards fed by the same data: one on a traditional batch pipeline with 24-hour latency and one on iFactory’s streaming pipeline with sub-5-minute latency. The comparison shows how fresh data changes decisions — real-time OEE lets supervisors intervene during a shift, and current quality data enables operators to adjust parameters before defect thresholds are breached. Book a 30-minute demo to see the live comparison on your own plant data.
Data Source Latency Profile: Current State vs Target
Each data source in the plant has a unique latency profile determined by its native protocol, data volume, and integration method. PLCs and IIoT gateways are the fastest to bring to real-time because they support streaming protocols natively. ERP systems, with their batch-oriented data models, require the most architectural effort to reduce latency. The cards below show current latency, target latency after optimisation, priority level for the remediation effort, and the improvement percentage already achieved. High-priority P1 sources — PLC, MES, Historian, IIoT Gateway — are typically addressed first because they drive the most operationally critical reports.
Five Strategies to Reduce Report Latency
No single technique eliminates report latency. The most effective approach combines five complementary strategies that address different stages of the data pipeline. Stream ingestion removes batch wait time at the source. Incremental loads shrink ETL windows from hours to minutes. In-memory caching makes dashboard queries instantaneous. Pre-aggregated views eliminate expensive full-table scans. Edge processing reduces data movement and network latency. Each strategy contributes a measurable latency reduction percentage, and when combined, they produce the compounding effect that brings 24-hour reports down to 3-minute dashboards.
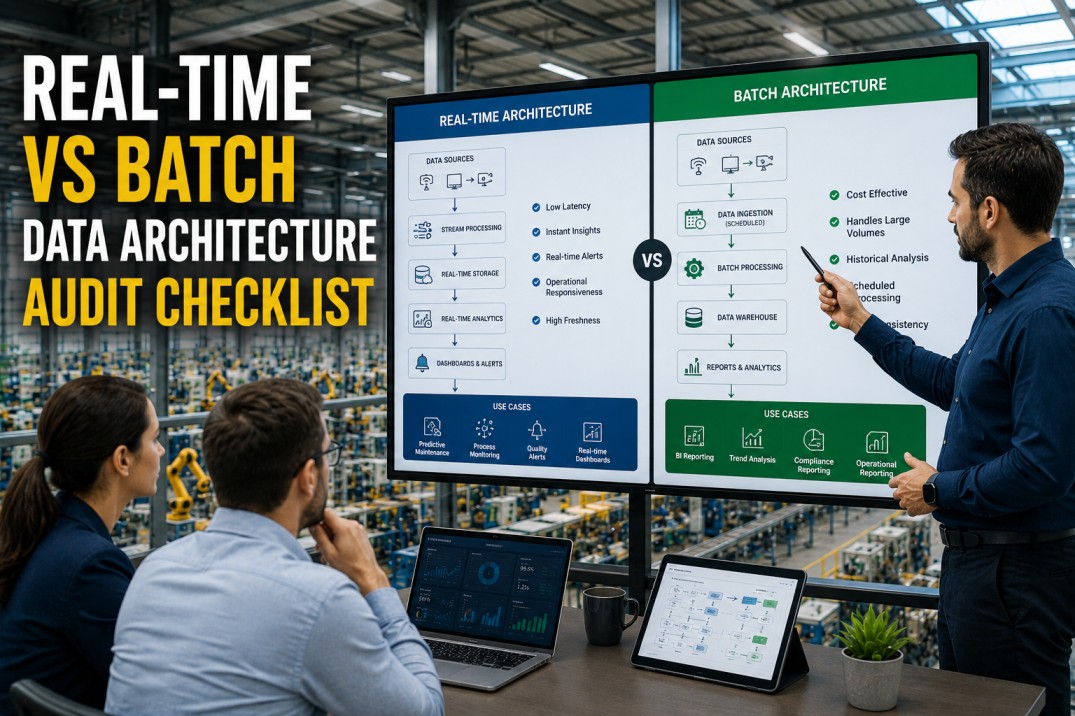
Batch vs Streaming Architecture: The Latency Impact of Pipeline Design
The architectural difference between batch and streaming pipelines is most visible in the data flow path. In a batch architecture, data sits in source systems all day, is extracted in a nightly ETL job that runs for hours, lands in a staging area, is loaded into a warehouse, and is finally queried by a dashboard — a process that takes 10–15 hours end-to-end. In a streaming architecture, the same data flows through a continuous pipeline where ingestion, processing, and storage happen within seconds, and the dashboard queries a real-time data store that is never more than a few minutes behind the source systems. The side-by-side comparison makes the latency advantage of streaming architecture immediately clear.
Six-Week Implementation Roadmap
Reducing report latency from 24 hours to under 5 minutes follows a structured six-week roadmap. Week 1 focuses on measurement: you cannot fix what you have not measured. Weeks 2–3 address the biggest bottleneck — stream ingestion from real-time-capable sources. Week 4 converts the most impactful batch transforms to streaming or incremental processing. Week 5 adds the caching layer that makes dashboard queries instant. Week 6 validates the entire pipeline against your latency targets and tunes for production throughput. Each week has a clearly defined milestone and success metric so you can track progress and demonstrate value at every step.
Frequently Asked Questions
What causes high latency in manufacturing reports?
High latency in manufacturing reports typically results from batch-oriented data pipelines that run on fixed schedules (nightly, hourly, or shift-end). When a report requires data from multiple source systems — PLC, MES, ERP, CMMS — each source may land its data at a different time, and the report cannot be generated until the slowest source completes its batch cycle. Additional latency factors include full-table ETL loads that reprocess all historical data instead of incremental changes, lack of pre-aggregated views that force dashboards to scan raw transaction tables, insufficient indexing or partitioning on large fact tables, network bottlenecks between plant-floor systems and the analytics server, and manual data preparation steps where operators export, transform, and upload spreadsheets before a report can run. The compound effect of these factors often results in reports that are 12 to 48 hours old by the time decision-makers see them.
What is the difference between batch and real-time data processing for manufacturing?
Batch processing collects data over a period (a shift, a day, an hour) and processes it all at once in a scheduled job. The advantage is simplicity — batch ETL is well understood, easy to debug, and does not require specialised streaming infrastructure. The disadvantage is latency: the report always reflects the past, never the present. Real-time (streaming) processing ingests data as it is generated, transforms it on the fly, and makes it available for querying within seconds or minutes. Streaming requires message brokers (Kafka, MQTT), stream processors (Kafka Streams, Flink, Spark Streaming), and a real-time data store (Redis, Druid, ClickHouse). The trade-off is operational complexity, but the benefit is that operators, supervisors, and managers see the current state of production, quality, and maintenance — not yesterday’s snapshot. Many manufacturing analytics platforms use a hybrid approach: streaming for high-frequency operational KPIs and batch for financial and compliance reporting where historical completeness is more important than speed.
How does data pipeline architecture affect report latency?
Data pipeline architecture is the single biggest determinant of report latency. A traditional batch architecture has a linear chain: source systems → nightly ETL → staging tables → data warehouse → aggregation → report. Each stage waits for the previous one to complete, so if any stage fails or runs long, every downstream stage is delayed, and the report arrives late. A streaming architecture replaces the linear chain with a directed acyclic graph where data flows continuously through multiple parallel transforms. Ingestion, cleansing, enrichment, and aggregation happen in milliseconds rather than hours. The choice of data store also matters: columnar databases (ClickHouse, Druid) can aggregate millions of rows per second for dashboard queries, while a traditional row-store database scanning unindexed tables causes slow query performance regardless of pipeline speed. Caching layers further reduce latency by serving pre-computed results without hitting the database at all.
What is the fastest achievable report latency in a manufacturing plant?
The fastest achievable report latency depends on the data source types and the complexity of transformations. For real-time-capable sources — PLCs, IIoT gateways, MES transactions — sub-minute latency is achievable with a well-architected streaming pipeline. Reports that require only pass-through or simple aggregation of real-time data can update continuously with 1–5 second latency. Reports that require joins across multiple source systems (e.g., OEE = Availability × Performance × Quality, pulling from PLC, MES, and QMS) typically achieve 1–5 minute latency with streaming architecture. Reports that depend on human-entered data (lab results, quality inspections, shift logs) are bounded by the speed of manual entry and typically achieve 5–15 minute latency once the data is entered. The practical floor for a comprehensive manufacturing analytics platform serving 8–12 source systems is 3–5 minutes end-to-end for the slowest report, with most reports updating in under 60 seconds.
How do I start reducing report latency in my plant?
Start with a comprehensive latency audit: list every report your plant generates, identify its data sources, map the full pipeline from source to dashboard, and measure the actual end-to-end latency for each report. Focus on the top-five highest-latency reports that have the most operational impact (typically daily production, OEE, quality, and maintenance reports). For each high-latency report, identify the single biggest bottleneck — is it the batch ETL job, a slow database query, a manual data preparation step, or a dependency on a late-arriving source system? Address bottlenecks in order of impact: replace manual steps with automated ingestion first, convert the largest batch loads to incremental loads second, deploy pre-aggregated views for the most frequently queried KPIs third. If the plant has real-time-capable sources (PLCs, MES, IIoT gateways), implement a streaming pipeline for the highest-priority reports using MQTT or Kafka. iFactory’s low-latency analytics platform can be deployed alongside existing systems and typically reduces end-to-end report latency from 24+ hours to under 5 minutes within six weeks.
From 24 Hours to 3 Minutes. Deploy iFactory’s Low-Latency Pipeline in Weeks.
iFactory’s Streaming-First Architecture Eliminates Batch Delays. Your Reports Arrive in Minutes, Not Tomorrow.
iFactory’s platform is built on a streaming-first architecture that connects to PLCs, MES, and ERP platforms via MQTT, Kafka, and REST API. It ingests data in real time, processes it through stream transforms, and serves dashboards via an in-memory cache — delivering 3–5 minute latency for multi-source reports. Deployment runs alongside existing infrastructure with no rip-and-replace. Typical time-to-value is six weeks. Book a demo to see how fast your reports can arrive.