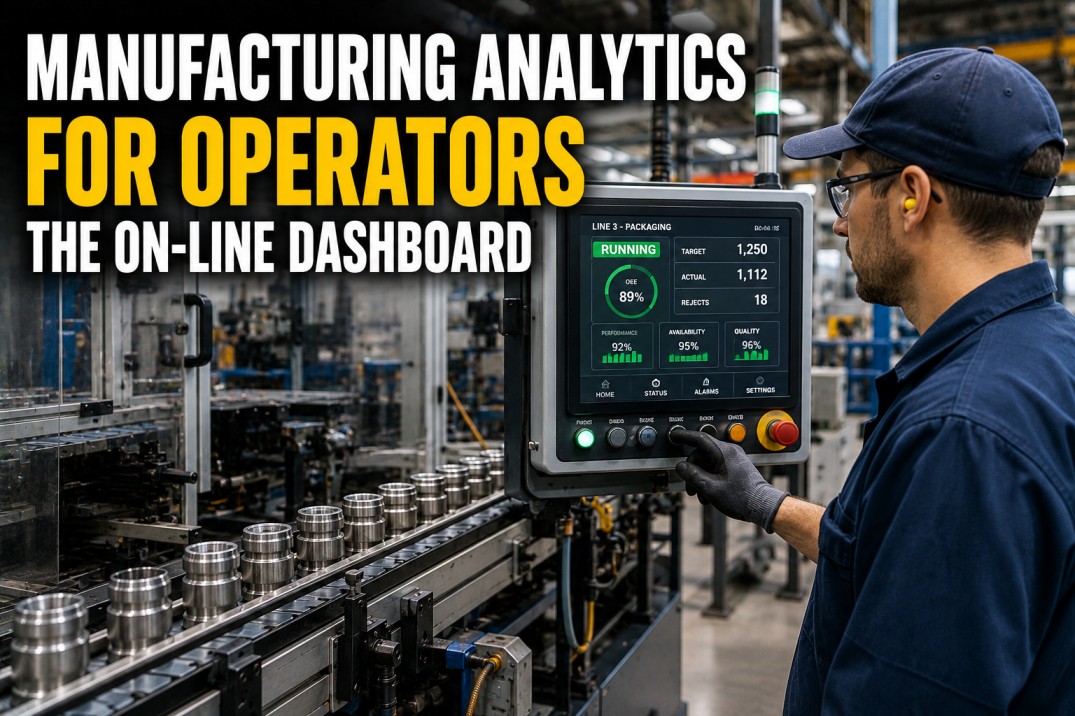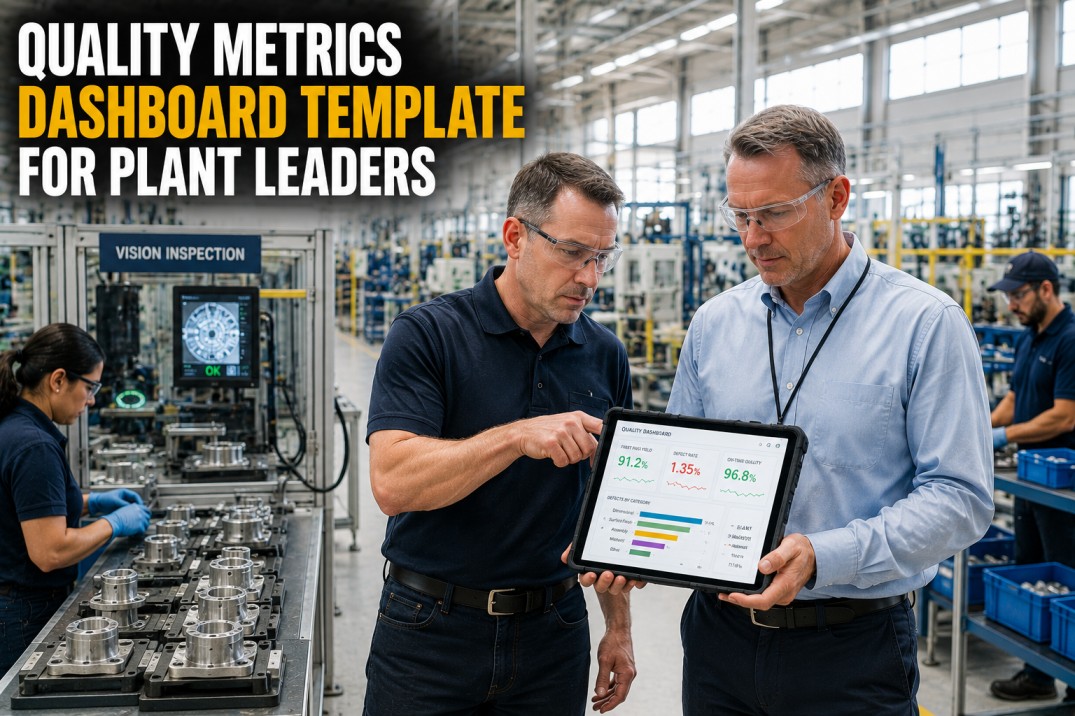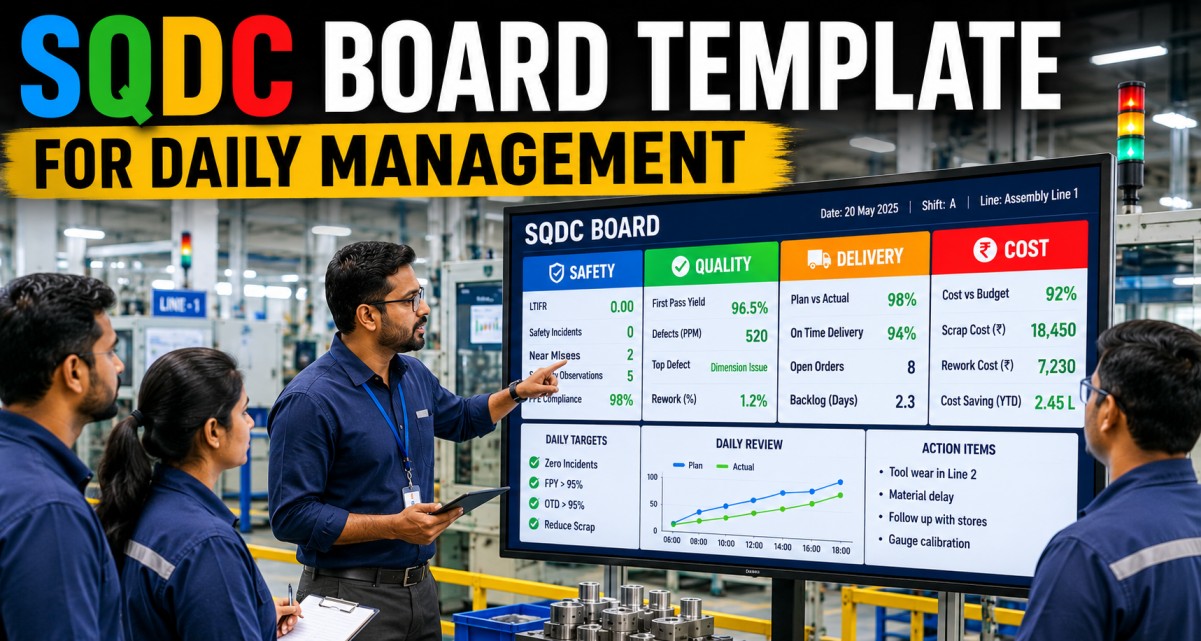
The best plant managers scan a consistent set of KPIs every morning before the first production meeting. The numbers that matter most fall into five categories — safety, production, quality, cost, and people — and the most effective managers can read all 12 in under three minutes. The difference between a good morning scan and a slow one is not the manager's experience; it is whether the KPIs are pulled automatically into a single view or compiled manually from emails, spreadsheets, and sticky notes. iFactory's plant manager dashboard surfaces all 12 KPIs on one mobile-optimized screen, updated every shift with live plant data. This guide lists the 12 numbers, explains what each one tells you, and shows the healthy range and warning threshold for each — so every plant manager knows exactly what to look for before 9 AM.
Your 12-KPI Morning Dashboard
Each KPI card shows the number name, a one-line summary, and the healthy range. iFactory color-codes each metric green (on track), yellow (caution), or red (critical) using your plant's thresholds. Scan these in priority order — safety first, then production, quality, cost, and people.
The Morning Scan: 12 KPIs in 3 Minutes
Effective plant managers follow a consistent sequence that mirrors operational priority. Each block below takes under 30 seconds when your KPIs are on a single screen. The sequence is designed so that a critical finding in any block stops the scan and redirects attention to action — you never finish the full list when something needs immediate response.
KPI Thresholds at a Glance
Each KPI has three zones — green (no action needed), amber (monitor), red (act now). iFactory color-codes each metric automatically based on your plant's configured thresholds. This compact reference shows the standard thresholds used across iFactory deployments.
Five Traps That Trip Up Morning KPI Scans
Even experienced plant managers misinterpret KPIs under morning time pressure. These five patterns are the most common mistakes identified across iFactory's 200+ plant deployments. Each trap includes the fix that top-performing managers use.
Reacting to a single shift's variance instead of looking at the seven-day trend. One bad shift is noise. Three similar shifts in a row is a pattern. Fix: Scan the trend first, then drill into the most recent shift only if the trend direction changed.
Scanning in random order or spending equal time on each KPI. Safety must be checked first and fastest. Production and quality follow. Cost and people come last. Fix: Follow the fixed sequence — safety, production, quality, cost, people — and set a 30-second timer per block.
A week of zero near-miss reports is not good news — it signals under-reporting. Zero quality holds on a high-volume line is improbable. Fix: Include a check for unexpectedly perfect numbers in every morning scan, not just unexpectedly bad ones.
Seeing scrap spike in the same shift as a new material lot and assuming the material caused it. The dashboard shows what happened, not why. Fix: Use the morning scan to generate questions, not answers. Root-cause investigation happens after the meeting, not during it.
Looking at KPIs in isolation without overnight shift notes or the maintenance handover log. 85% attainment with a conveyor failure note tells a different story than 85% with no notes. Fix: Include three context items alongside the 12 KPIs: overnight events, open maintenance requests, and shift supervisor comments.
Frequently Asked Questions
What is the fastest way to see these 12 KPIs every morning?
A single mobile-optimized dashboard that pulls all 12 KPIs from live plant data sources and updates automatically at the end of each shift. iFactory's plant manager dashboard does this — no logins to multiple systems, no spreadsheet compilation, no manual entry. The dashboard is designed to be scanned in under three minutes with color-coded healthy/warning/critical bands, trend arrows, and one-tap drill-down for any number that needs investigation. Most plant managers using iFactory complete their morning scan before they finish their first coffee.
Should I customize this KPI list for my specific plant?
Yes. The 12 KPIs listed here are a starting point that applies to most discrete and process manufacturing plants. Customize based on your context — add line changeover time for high-mix plants, first-pass yield by product family for multi-product plants, or OEE by asset class for plants with diverse equipment. The key principle is to keep the list short enough to scan in three minutes. iFactory's dashboard is fully customizable: add, remove, or reorder KPIs, set your own threshold values, and configure the display for your specific morning sequence.
How are KPI thresholds determined?
Thresholds should be based on a combination of industry benchmarks and your plant's historical performance. Industry benchmarks provide a starting point — world-class OEE is 85%, but a plant running at 55% should set its initial warning threshold at 50%, not 75%. The most effective approach uses trailing 12-month data: the green zone covers performance within one standard deviation of the mean; amber covers one to two standard deviations; red is anything beyond two. iFactory can calculate these thresholds automatically from your historical data during deployment and adjust them as performance improves.
How do I introduce these KPIs to shift supervisors without overwhelming them?
Introduce the KPIs in three phases over four weeks. Phase one (week one): deploy only safety and production KPIs — five numbers. Phase two (weeks two and three): add quality and cost KPIs — four more numbers. Phase three (week four): add the people KPIs — the final three. Each phase includes a 15-minute training session showing supervisors where to find the KPIs, what each number means, and what constitutes a healthy range. The phased approach prevents cognitive overload and builds confidence before adding the next tier of metrics.
What if some of these KPIs are not available from my current systems?
Start with what you have. If your plant does not track near-miss reporting digitally, skip KPI two and add it when the reporting process is established. If energy meters are not connected, KPI 10 can wait until submetering is in place. The four most important KPIs to have on day one are production attainment, OEE, first pass yield, and attendance — these give you 80% of the operational picture. iFactory's data integration team can help identify which KPIs can be connected immediately from your existing systems and which require additional configuration.