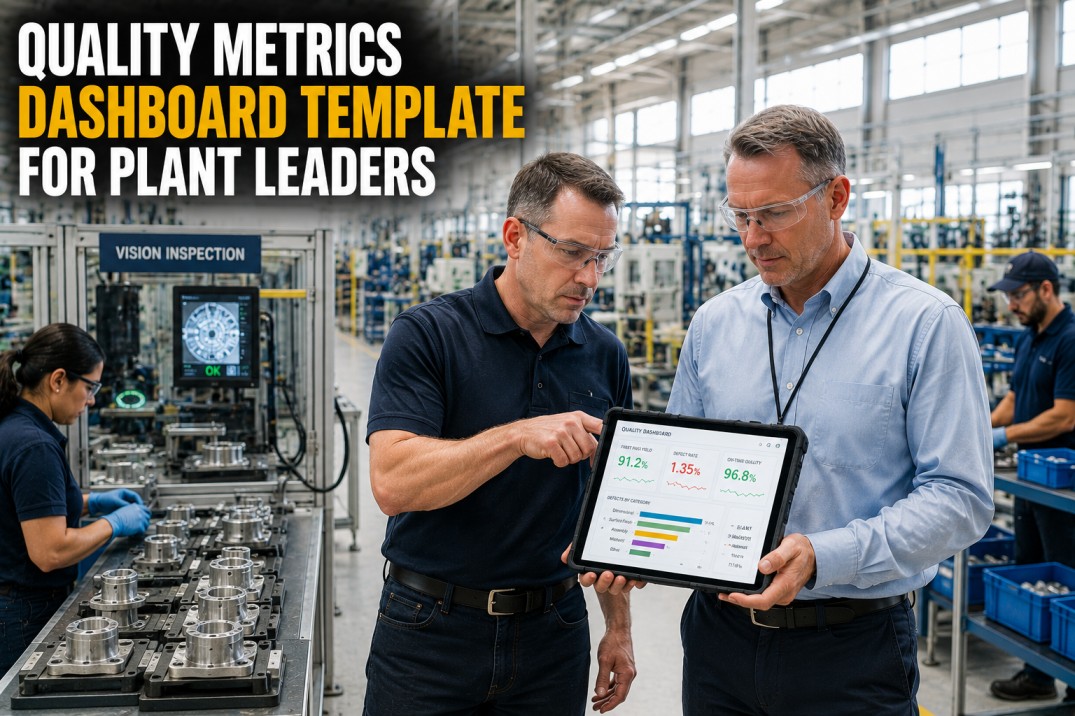
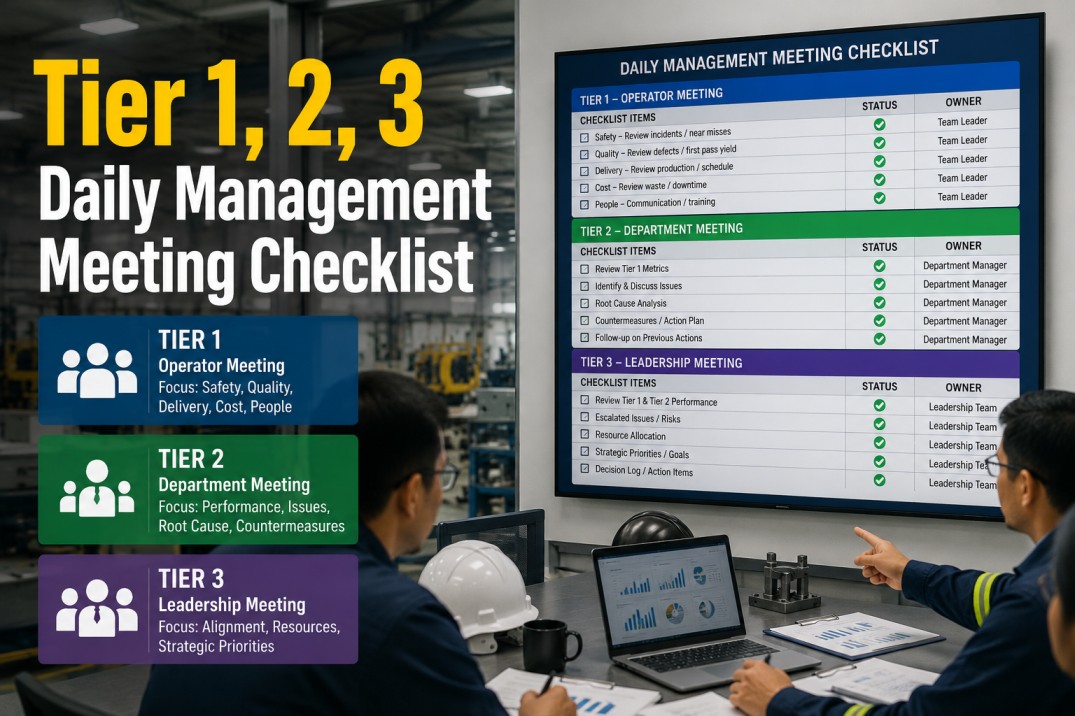
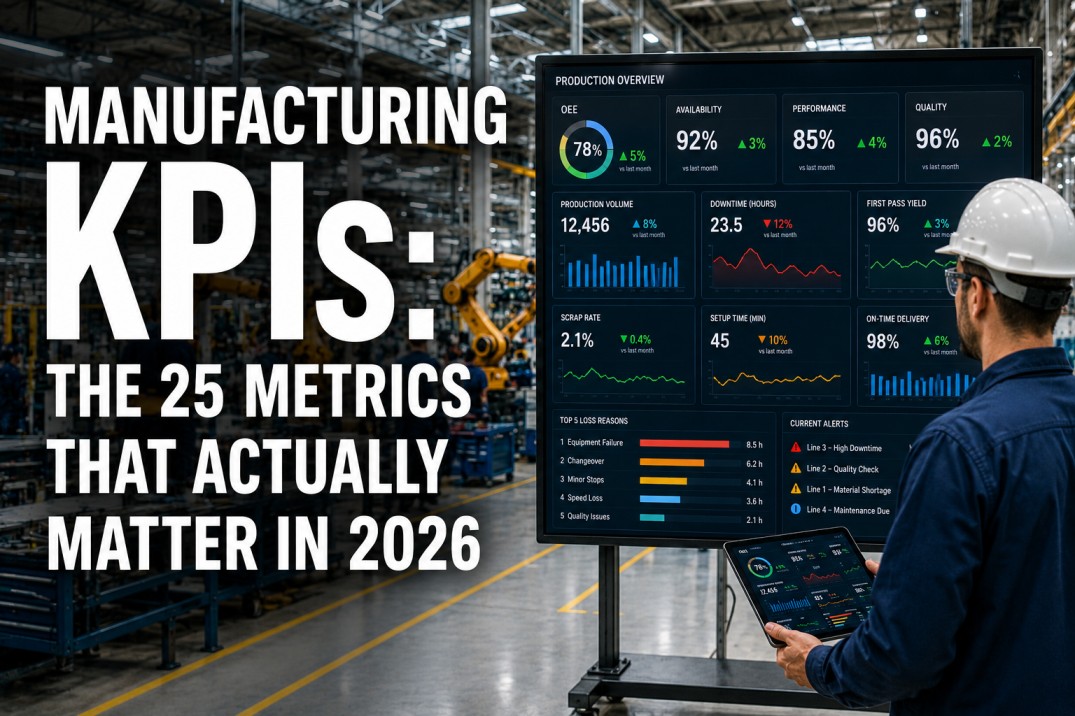
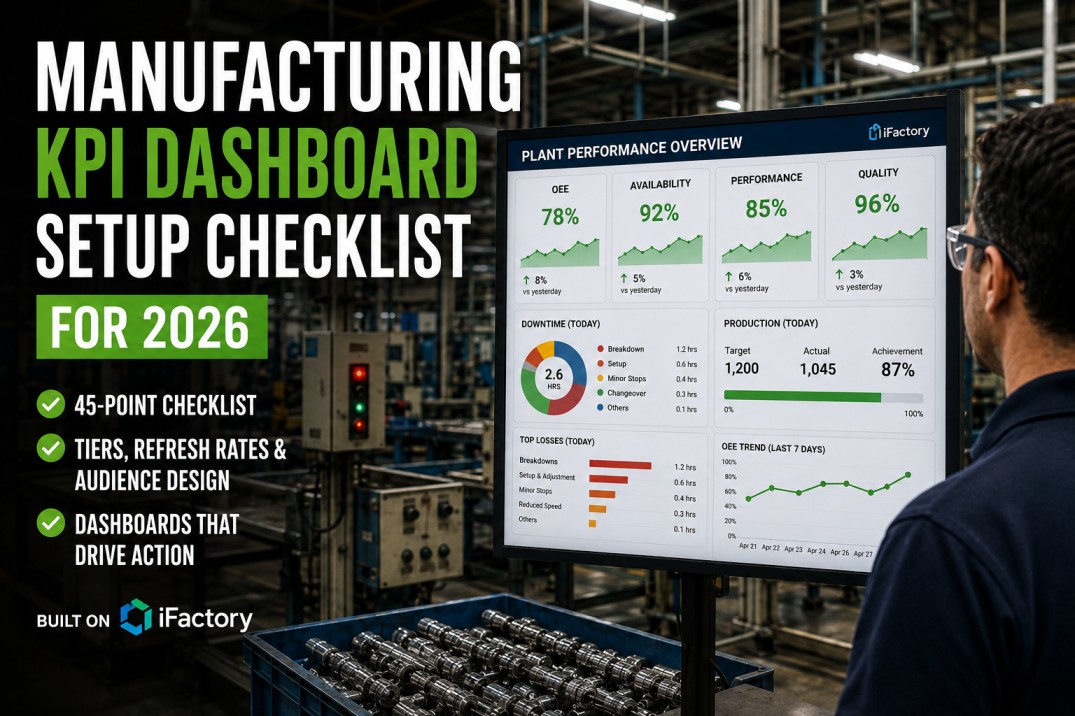
A plant manager's daily dashboard is the single most important screen in a manufacturing plant — yet most plant managers spend the first hour of their day hunting for data across email, spreadsheets, and disconnected systems. A well-designed daily dashboard gives the plant manager a complete operational picture within 5 minutes of their morning scan: production output vs plan, OEE trends, quality issues, maintenance status, safety events, and cost performance. This checklist covers every item required to build a plant manager daily dashboard that consolidates the right KPIs from the right data sources — so the plant manager sees what matters before 9 AM. Based on iFactory's deployment experience across 1,000+ manufacturing plants, these 30 items ensure your plant manager dashboard drives daily decisions, not data hunts.
See Every Critical KPI Before 9 AM — Pre-Built Plant Manager Dashboard in 14 Days
iFactory's plant manager dashboard consolidates OEE, production, quality, maintenance, and safety KPIs from every plant system into one morning scan screen. See your dashboard in a 30-minute session.
Why a Structured Plant Manager Dashboard Drives Better Decisions
Plant managers who use a structured daily dashboard with defined KPIs, thresholds, and drill-down paths make operational decisions 3x faster than those relying on ad-hoc data gathering. The dashboard must cover production, quality, maintenance, and safety in a single morning scan.
Plant Manager Daily Dashboard Checklist — 30 Items
Each checklist item includes the specific action required, type, priority, and completion toggles. The type indicates whether the item is a pass/fail check, a structured selection, or a numeric configuration. Priority marks implementation order. Use the Photo, Required, and Critical toggles to track completion.
| # | Checklist Item | Type | Priority | Photo | Req. | Crit. |
|---|---|---|---|---|---|---|
| 1 | Data source inventory complete — all plant data sources (PLCs, MES, CMMS, ERP, quality, labour) identified and catalogued | Pass/Fail | High | — | ✓ | ✓ |
| 2 | Data connectivity validated — each data source connection tested, data flowing reliably into the dashboard platform | Pass/Fail | High | — | ✓ | ✓ |
| 3 | KPI hierarchy defined — plant-level KPIs mapped to area-level source KPIs with clear drill-down path for each metric | Pass/Fail | High | — | ✓ | ✓ |
| 4 | Dashboard layout designed — morning scan KPIs placed top-left, supporting views organised by production, quality, maintenance, and safety domain | Pass/Fail | High | — | ✓ | ✓ |
| 5 | Update cadence configured — each KPI tile refresh rate set appropriately (real-time for OEE, hourly for quality, daily for financials) | Selection | High | — | ✓ | ✓ |
| 6 | Target thresholds set — green, yellow, and red thresholds configured for every KPI based on plant operating targets | Pass/Fail | High | — | ✓ | ✓ |
| 7 | User permissions configured — plant manager view includes all KPIs, department heads see domain-specific views with same data | Pass/Fail | Med | — | ✓ | — |
| 8 | Dashboard platform selected — data ingestion, visualisation, and alerting platform confirmed and ready for deployment | Pass/Fail | High | — | ✓ | ✓ |
| # | Checklist Item | Type | Priority | Photo | Req. | Crit. |
|---|---|---|---|---|---|---|
| 9 | OEE displayed — current OEE vs target with 24-hour trend line, top loss reason identified on the tile | Numeric | High | — | ✓ | ✓ |
| 10 | Production output tracked — actual units vs planned units by line, variance shown as count and percentage | Numeric | High | — | ✓ | ✓ |
| 11 | Schedule attainment displayed — on-time delivery and schedule compliance percentage with 7-day trend | Numeric | High | — | ✓ | ✓ |
| 12 | Downtime summary visible — total downtime duration, top 3 reason codes by lost time, MTBF per critical asset | Pass/Fail | High | — | ✓ | ✓ |
| 13 | First-pass yield displayed — current FPY vs target with 7-day trend and significant deviations flagged | Numeric | High | — | ✓ | ✓ |
| 14 | Defect Pareto shown — top 5 defect types by occurrence and cost, with trend over the last 30 days | Pass/Fail | High | — | ✓ | ✓ |
| 15 | Scrap and rework tracked — scrap rate percentage and rework hours vs target with rolling 7-day average | Numeric | High | — | ✓ | ✓ |
| 16 | Customer quality visible — customer complaints and returns trended monthly with open corrective actions | Pass/Fail | High | — | ✓ | ✓ |
| # | Checklist Item | Type | Priority | Photo | Req. | Crit. |
|---|---|---|---|---|---|---|
| 17 | MTBF and MTTR displayed — current MTBF and MTTR per critical asset vs target, with 30-day trend direction | Numeric | High | — | ✓ | ✓ |
| 18 | PM compliance tracked — planned maintenance completion percentage and count of overdue work orders displayed | Numeric | High | — | ✓ | ✓ |
| 19 | Maintenance backlog visible — open work orders by priority and age, with impact assessment on production | Pass/Fail | High | — | ✓ | ✓ |
| 20 | Safety KPIs displayed — LTIR, TRIR, near-miss count, and open safety corrective actions with trend | Numeric | High | — | ✓ | ✓ |
| 21 | Staffing summary visible — attendance rate, overtime hours, and critical skill gap alerts for current shift | Pass/Fail | Med | — | ✓ | — |
| 22 | Material status displayed — critical material shortages, inventory alerts, and supply chain flag for current day | Pass/Fail | Med | — | ✓ | — |
| # | Checklist Item | Type | Priority | Photo | Req. | Crit. |
|---|---|---|---|---|---|---|
| 23 | Alert rules configured — automated alerts for any KPI breaching threshold, with clear escalation path and owner | Pass/Fail | High | — | ✓ | ✓ |
| 24 | Alert routing defined — each alert type routed to correct owner with escalation time limit set for red-alert KPIs | Pass/Fail | High | — | ✓ | ✓ |
| 25 | Drill-down from OEE — plant manager can click from plant OEE to area-level OEE, then to loss tree by category | Pass/Fail | High | — | ✓ | ✓ |
| 26 | Drill-down from downtime — plant manager can click from total downtime to individual events by line and reason code | Pass/Fail | High | — | ✓ | ✓ |
| 27 | Drill-down from quality — plant manager can click from FPY to defect details by product, shift, and station | Pass/Fail | High | — | ✓ | ✓ |
| 28 | Daily review cadence established — plant manager reviews dashboard at same time each morning with standard scan agenda | Pass/Fail | High | — | ✓ | ✓ |
| 29 | Action tracking integrated — dashboard includes open actions from morning scan, closure rate, and overdue items | Pass/Fail | High | — | ✓ | ✓ |
| 30 | Dashboard governance active — monthly KPI relevance review, threshold adjustment, and data quality audit scheduled | Pass/Fail | Med | — | ✓ | — |
All 30 Checklist Items Pre-Configured in iFactory — Go Live in 14 Days
Every KPI tile, drill-down view, and alert rule in this checklist is pre-built in iFactory and configured to your plant's data during onboarding. No blank screens. No manual setup.
Plant Manager Dashboard — Morning Scan Data Map
Every KPI on the plant manager's morning scan must trace back to a specific data source with defined refresh cadence and audience. This mapping ensures the plant manager sees the complete operational picture before 9 AM.
Four-Stage Deployment: From Data Connection to Daily Dashboard Habit
Plant manager dashboard deployment follows a structured path. Each stage builds on the previous one with clear completion criteria before moving to the next.
- Connect all data sources and validate data quality
- Define KPI hierarchy and drill-down paths
- Design morning scan layout with plant manager input
- Configure KPI thresholds and update cadences
- Deploy morning scan screen with 12 core KPIs live
- Train plant manager on morning scan workflow
- Verify data accuracy against source systems
- Establish daily review cadence and standard agenda
- Deploy drill-down views for OEE, downtime, quality, and maintenance
- Configure alert rules and escalation routing
- Add action tracking and closure verification
- Set up department head views aligned with plant manager dashboard
- Review dashboard usage and morning scan adoption metrics
- Adjust KPI thresholds and tile layout based on feedback
- Add mobile view for off-plant-floor access
- Transition dashboard ownership and governance to plant team
Frequently Asked Questions About the Plant Manager Daily Dashboard
What are the most important KPIs for a plant manager daily dashboard?
The 12 morning scan KPIs every plant manager should see before 9 AM fall into four categories. Production: OEE vs target, actual output vs plan, schedule attainment percentage, and downtime summary with top 3 reason codes. Quality: first-pass yield vs target, defect Pareto by occurrence and cost, scrap and rework rate, and customer complaint trend. Maintenance: MTBF and MTTR per critical asset, PM compliance percentage, and maintenance backlog by priority. Safety and resources: LTIR and TRIR, near-miss count, staffing attendance, and critical material shortage alerts. iFactory's plant manager dashboard pre-configures all 12 KPIs from your existing plant data sources — no manual setup required.
How long should a plant manager spend on the daily dashboard?
The morning scan should take no more than 5 minutes for a well-designed dashboard. The plant manager scans the top-level KPI tiles from left to right — production, quality, maintenance, safety, resources — noting any red or yellow indicators. KPIs that are green (on target) require no further action. Red KPIs get 1-2 minutes of drill-down investigation. Any issue requiring further analysis is assigned to the relevant department head with a due date during the daily operations review that follows the scan. If the morning scan regularly takes longer than 10 minutes, the dashboard likely has too many KPIs, missing thresholds, or insufficient drill-down capability. iFactory's dashboard design principles limit the morning scan to 12 KPIs with one-click drill-down paths for deeper analysis.
What data sources do I need for a complete plant manager dashboard?
You need four categories of data sources. For production: PLCs or SCADA for OEE, output, and downtime data; MES for schedule attainment and work order tracking. For quality: quality inspection systems, vision systems, and lab data for FPY, defect Pareto, and scrap tracking. For maintenance: CMMS for MTBF, MTTR, PM compliance, and backlog data. For safety and resources: EHS system for safety KPIs, HR or time-tracking system for attendance, and ERP for material status. Many plants already have most of these data sources in place but have never connected them to a single dashboard view. iFactory's 200+ pre-built connectors integrate with all major plant systems and unify the data into a single plant manager dashboard without custom integration work.
How do I make sure the plant manager actually uses the dashboard daily?
Adoption depends on three factors. First, the dashboard must be the single source of truth — if the plant manager needs to cross-check data in spreadsheets or other systems, trust is broken and the dashboard will be abandoned. Second, the morning scan must match the plant manager's decision cadence — KPIs that are updated in real-time or hourly for operational decisions, daily for resource decisions, and weekly for strategic reviews. Third, the dashboard must be accessible where the plant manager works — on the shop floor, in their office, and on mobile. Plants that follow these three principles achieve 90%+ daily dashboard usage within 30 days of deployment. iFactory's deployment team includes adoption coaching as part of every dashboard rollout to establish the morning scan habit within the first 14 days.
Can the plant manager dashboard be viewed on mobile?
Yes. iFactory's plant manager dashboard is fully responsive and works on any device — shop floor workstations, desktop monitors, tablets, and smartphones. The mobile view prioritises the 12 morning scan KPIs in a single scrollable column with tap-to-drill-down capability. Alert notifications are pushed to the plant manager's mobile device when any KPI breaches its threshold, so critical issues are flagged even when the plant manager is away from the dashboard. The mobile view supports the same drill-down paths, action tracking, and escalation management as the desktop view, ensuring the plant manager has complete operational visibility regardless of location.
Go From Data Hunt to 5-Minute Morning Scan in 14 Days — Pre-Built for Every Plant
iFactory's plant manager dashboard consolidates every critical KPI from every plant system into one morning scan screen. No manual data pulling, no disconnected spreadsheets. See your first dashboard in a 30-minute session.