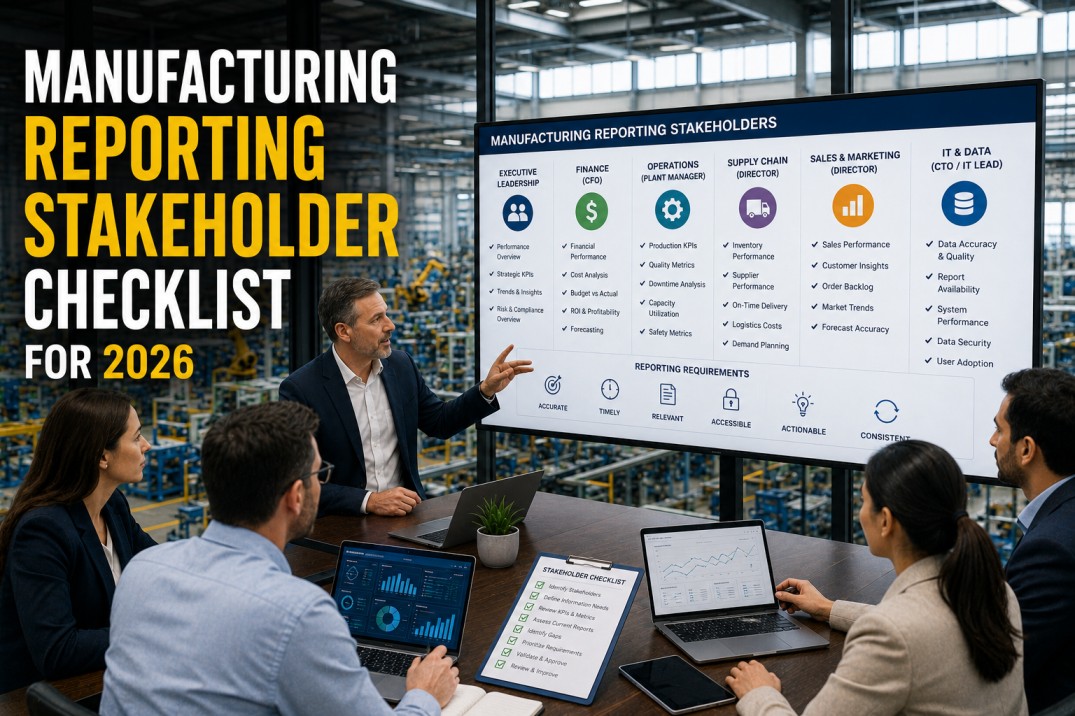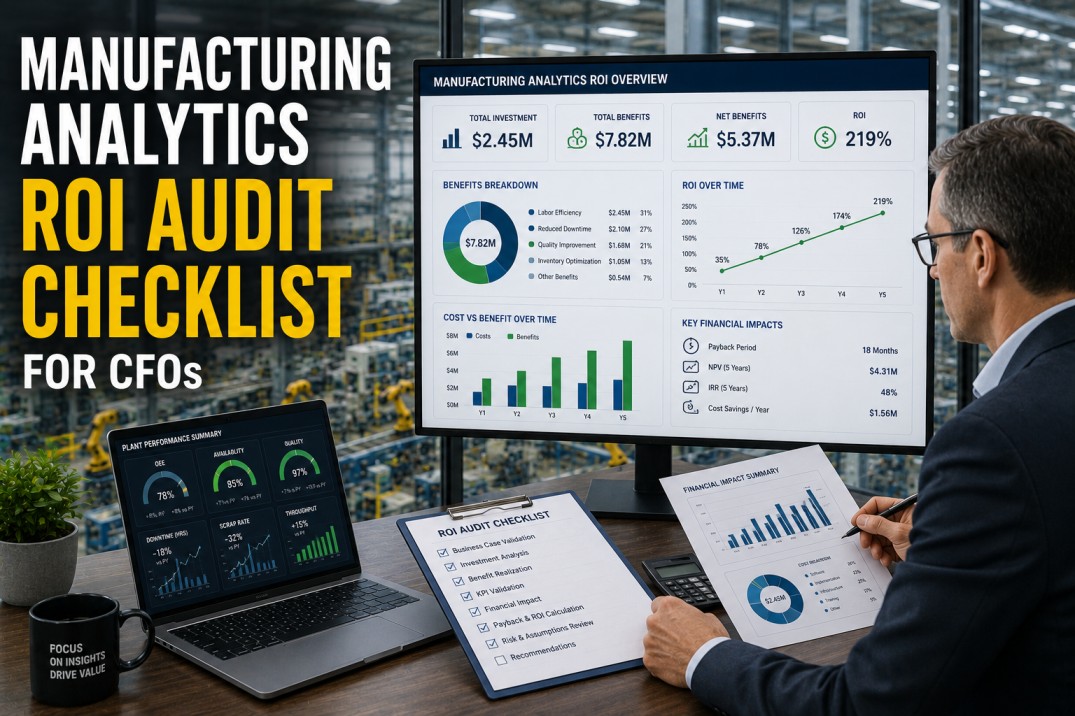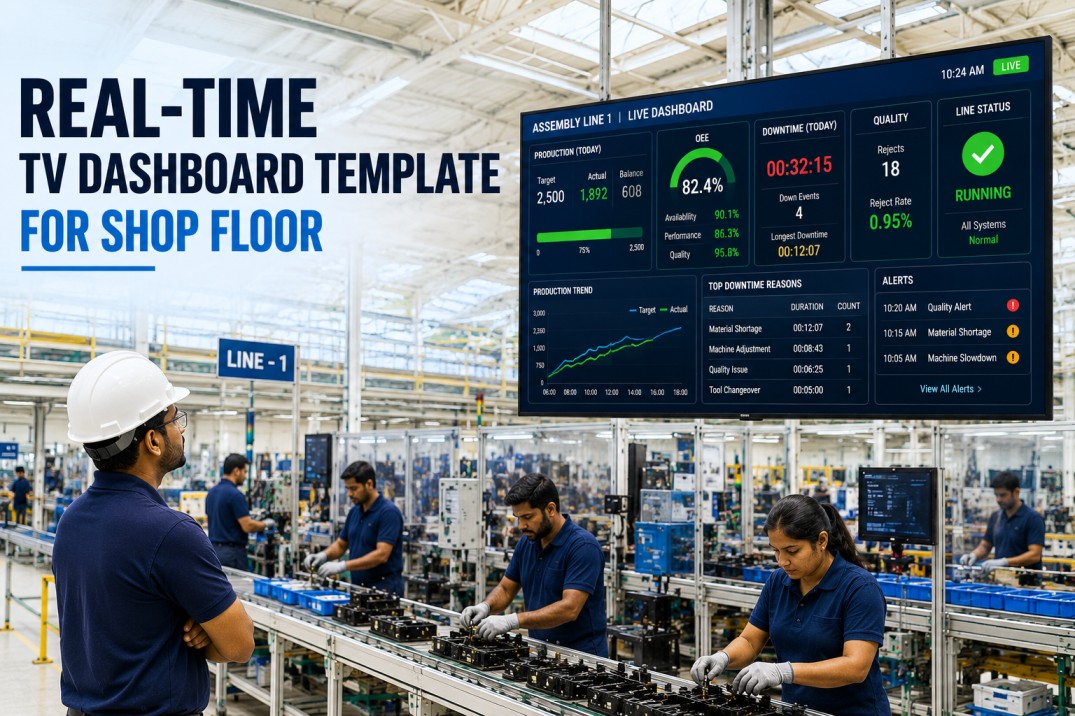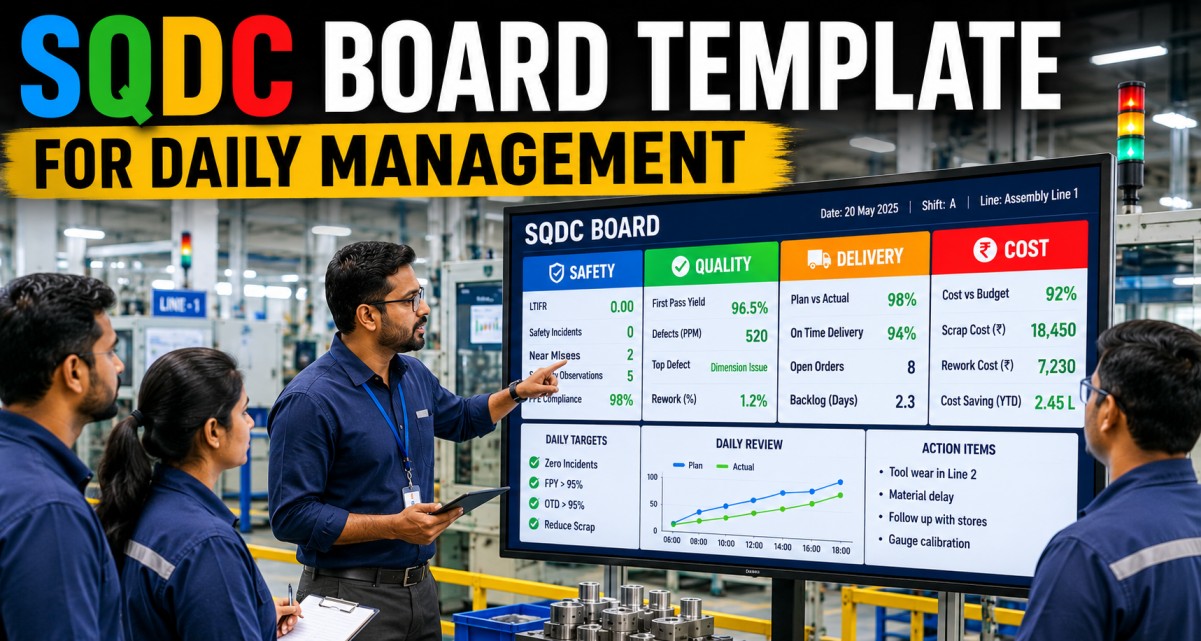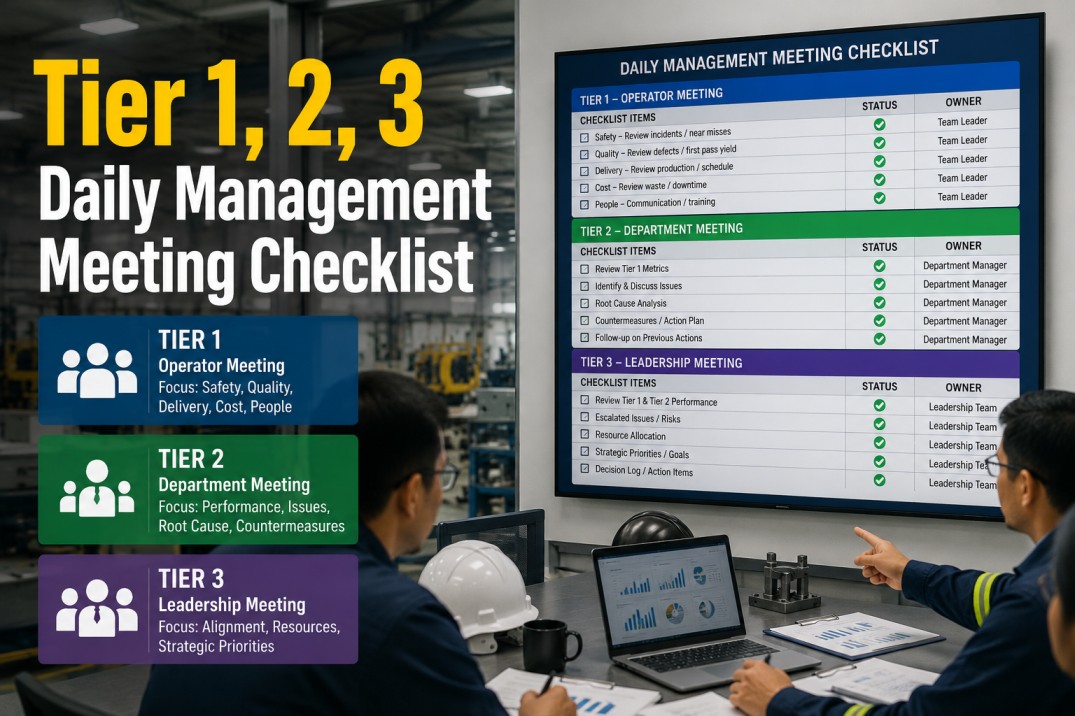
Tier 1, 2, and 3 daily management meetings are the backbone of operational control in manufacturing plants — yet most plants lack a structured checklist for what each tier should cover. Tier 1 meetings focus on shift-level performance with operators and supervisors. Tier 2 meetings connect plant leadership to daily results and resource decisions. Tier 3 meetings align site strategy with plant execution. Without a clear checklist for each tier, meetings drift into status updates, miss critical escalations, and fail to drive action. This checklist covers every item required to run effective Tier 1, 2, and 3 daily management meetings — from KPIs and data sources to escalation triggers and action tracking. Based on iFactory's deployment experience across 1,000+ manufacturing plants, these 30 items ensure every tier meeting drives real operational decisions.
Run Every Tier Meeting With Live Data — From Operator Huddle to Executive Review
iFactory's tier meeting dashboard connects every level of your organisation with live KPIs, automated escalation tracking, and action closure monitoring. See your tier structure in a 30-minute session.
Why Structured Tier Meetings Drive Operational Excellence
Plants with structured tiered meeting processes close actions 4x faster and escalate critical issues 87% more reliably than plants relying on ad-hoc stand-ups. Each tier has a distinct purpose, audience, and data requirement.
Tier 1, 2, 3 Daily Management Meeting Checklist — 30 Items
Each checklist item includes the specific action required, the type of check, priority level, and completion toggles. Type indicates whether the item is a pass/fail check, a structured data entry, or a numeric KPI review. Priority marks implementation order. Use the Photo, Required, and Critical toggles to track completion.
| # | Checklist Item | Type | Priority | Photo | Req. | Crit. |
|---|---|---|---|---|---|---|
| 1 | Safety incident review — any injuries, near misses, or safety violations from previous shift reviewed and noted | Pass/Fail | High | — | ✓ | ✓ |
| 2 | Attendance check — all team members present, absences communicated and covered | Pass/Fail | High | — | ✓ | ✓ |
| 3 | Production output vs target — actual units compared to planned with variance noted | Numeric | High | — | ✓ | ✓ |
| 4 | Quality metrics — defect rate and first-pass yield reviewed against target threshold | Numeric | High | — | ✓ | ✓ |
| 5 | Downtime review — top downtime event from previous shift reviewed with reason code and duration | Pass/Fail | High | — | ✓ | ✓ |
| 6 | OEE or line efficiency — current OEE vs target with trend direction noted on board | Numeric | High | — | ✓ | ✓ |
| 7 | Escalation from previous shift — unresolved issues handed over with assigned owner | Pass/Fail | High | — | ✓ | ✓ |
| 8 | Priority actions for current shift — top 3 actions assigned to named team members | Pass/Fail | High | — | ✓ | ✓ |
| 9 | Resource status — tooling, material, and staffing availability confirmed for shift | Pass/Fail | Med | — | ✓ | — |
| 10 | Visual board updated — all KPIs, actions, and escalations recorded on the tier 1 board before meeting closes | Pass/Fail | High | — | ✓ | ✓ |
| # | Checklist Item | Type | Priority | Photo | Req. | Crit. |
|---|---|---|---|---|---|---|
| 11 | Tier 1 summary review — key escalations from all area tier 1 boards summarised and reviewed | Pass/Fail | High | — | ✓ | ✓ |
| 12 | Plant-wide OEE and throughput — aggregated OEE, production output, and schedule attainment reviewed | Numeric | High | — | ✓ | ✓ |
| 13 | Quality performance — plant-wide defect Pareto with top 3 quality issues and assigned owners | Pass/Fail | High | — | ✓ | ✓ |
| 14 | Maintenance status — MTBF and MTTR trends, PM compliance, and open work order backlog reviewed | Pass/Fail | High | — | ✓ | ✓ |
| 15 | Safety metrics — plant-wide safety KPIs, incident trends, and open corrective actions reviewed | Pass/Fail | High | — | ✓ | ✓ |
| 16 | Staffing and resource gaps — cross-shift coverage, critical skill shortages, and labour allocation reviewed | Pass/Fail | Med | — | ✓ | — |
| 17 | Material and supply chain — inventory status, material shortages, and delivery delays reviewed | Pass/Fail | High | — | ✓ | ✓ |
| 18 | Engineering and CI progress — active continuous improvement projects and engineering requests reviewed | Pass/Fail | Med | — | ✓ | — |
| 19 | Customer and schedule — on-time delivery performance and schedule attainment vs plan reviewed | Numeric | High | — | ✓ | ✓ |
| 20 | Action items from previous tier 2 — status of open actions reviewed, closure verified or re-assigned | Pass/Fail | High | — | ✓ | ✓ |
| # | Checklist Item | Type | Priority | Photo | Req. | Crit. |
|---|---|---|---|---|---|---|
| 21 | Site performance summary — OEE, throughput, quality yield, and cost KPI trends reviewed against plan | Pass/Fail | High | — | ✓ | ✓ |
| 22 | Financial review — production cost per unit reviewed against budget with variance explanation | Pass/Fail | High | — | ✓ | ✓ |
| 23 | Capital project status — major capex milestones reviewed against timeline and budget | Pass/Fail | High | — | ✓ | ✓ |
| 24 | Strategic initiatives — progress against annual operating plan and strategic priorities reviewed | Pass/Fail | High | — | ✓ | ✓ |
| 25 | Quality system review — ISO or regulatory compliance status and CAPA trends reviewed | Pass/Fail | High | — | ✓ | ✓ |
| 26 | Safety system review — leading and lagging safety indicators and open corrective actions reviewed | Pass/Fail | High | — | ✓ | ✓ |
| 27 | Customer and market — key account performance, delivery reliability, and market feedback reviewed | Pass/Fail | High | — | ✓ | ✓ |
| 28 | People and organisation — headcount, training progress, and succession planning status reviewed | Pass/Fail | Med | — | ✓ | — |
| 29 | Risk and escalation — top 3 risks facing the site reviewed with mitigation status and owner | Pass/Fail | High | — | ✓ | ✓ |
| 30 | Forward look — next 90-day priorities reviewed, resource commitments confirmed, actions assigned | Pass/Fail | High | — | ✓ | ✓ |
All 30 Checklist Items Pre-Configured in iFactory — Go Live in 14 Days
Every tier meeting agenda, KPI review, and escalation trigger in this checklist is pre-built in iFactory and configured to your plant's data during onboarding. No blank boards. No manual tracking.
Tier Meeting Data Requirements — What Each Level Needs to Review
Every tier meeting depends on timely, accurate data from specific source systems. This mapping ensures each level has the right information at the right cadence — without overwhelming any audience.
Four-Stage Deployment: From Tier 1 Huddle to Tier 3 Executive Review
Tier meeting deployment follows a proven bottom-up path. Each stage builds on the previous one with clear completion criteria before moving to the next level.
- Define area boundaries and KPI targets per line or cell
- Set up visual boards with live OEE, output, and quality metrics
- Train shift supervisors on tier 1 agenda and escalation triggers
- Establish action tracking process and closure verification
- Connect tier 1 escalation feed to tier 2 daily review board
- Deploy plant-wide aggregated KPIs for OEE, quality, and maintenance
- Train department heads on tier 2 agenda and escalation ownership
- Verify cross-functional action closure between shifts and departments
- Build executive-level strategic dashboard with financial and KPIs
- Configure monthly and quarterly trend views for site leadership
- Establish risk register and strategic initiative tracking process
- Train site leadership on tier 3 agenda and strategic decision triggers
- Review escalation velocity — time from tier 1 flag to tier 2 or 3 resolution
- Adjust KPI targets and thresholds based on 30 days of meeting data
- Add role-specific views and automated distribution per tier
- Transition tier meeting ownership to plant leadership team
Frequently Asked Questions About Tier 1, 2, 3 Daily Management Meetings
What is the difference between Tier 1, Tier 2, and Tier 3 meetings?
Tier 1 meetings are daily shift or area huddles focused on current-shift performance — OEE, output, quality defects, downtime, and safety. They last 10-15 minutes and include operators and shift supervisors. Tier 2 meetings connect plant leadership across departments — production, maintenance, quality, engineering, and supply chain. They review aggregated plant performance, cross-functional escalations, and resource decisions. Tier 3 meetings are site-level strategic reviews covering financial performance, capital projects, strategic initiatives, and long-term risk. The three tiers form an escalation pyramid: issues that cannot be resolved at Tier 1 are escalated to Tier 2, and if still unresolved, to Tier 3 with context and recommended actions.
How long should each tier meeting take?
Tier 1 meetings should run 10-15 minutes and focus strictly on the current shift's priorities — no more than 3 action items per shift. Tier 2 meetings should run 20-30 minutes and cover all areas escalated from Tier 1 plus cross-functional resource decisions. Tier 3 meetings typically run 45-60 minutes for a weekly review or 90 minutes for a monthly strategic review. The most common mistake is treating higher tiers as longer meetings with more slides. Effective tier meetings use visual boards or dashboards with real-time data, not presentations. If a meeting exceeds its timebox, the issue should be moved to a separate deep-dive session rather than extending the tier meeting.
What KPIs should each tier review?
Tier 1 should review shift-level operational KPIs: OEE vs target, production output vs plan, defect rate or first-pass yield, top downtime event with reason code, and safety near-miss count. Tier 2 reviews plant-wide aggregated KPIs: OEE trend by line, plant-wide yield, MTBF and MTTR trends, PM compliance, on-time delivery, and Tier 1 escalation summary. Tier 3 reviews strategic and financial KPIs: production cost per unit vs budget, OEE year-to-date, safety LTIR and TRIR, capital project status, strategic initiative progress, and customer satisfaction or delivery reliability. iFactory's tier meeting dashboard pre-configures all KPI views per tier with automated data feeds from your existing plant systems.
How do escalations work between tiers?
Escalations follow a structured rule: any issue that cannot be resolved with the resources available at the current tier is escalated to the next tier with a clear description, impact assessment, and recommended action. Tier 1 escalations go to Tier 2 when they require cross-department coordination, budget approval, or resources beyond the shift supervisor's authority. Tier 2 escalations go to Tier 3 when they affect site strategy, require capital investment, or have significant safety or financial impact. Each escalation must include: what happened, the business impact, what has been tried, what is needed, and who is accountable. iFactory's escalation tracking module captures this information automatically and surfaces it at the right tier meeting.
How can I make tier meetings more effective and avoid them becoming status updates?
Three principles prevent tier meetings from drifting into status updates. First, the meeting must be data-driven — every KPI should be displayed on a visual board or dashboard with current values against targets, not reported verbally. If a metric is green (on target), acknowledge it and move on. Red or yellow metrics get discussion time. Second, every action must have a named owner and a due date — no actions assigned to "the team" or left open-ended. Third, the meeting must have a structured escalation path — if an issue cannot be resolved in 2 minutes, it goes to the escalation parking lot for post-meeting resolution. Plants that follow these three principles report 4x higher action closure rates and significantly shorter meeting durations.
Go From Ad-Hoc Stand-Ups to Live Tier Meetings in 14 Days — Pre-Built for Every Level
iFactory's tier meeting dashboards come pre-configured with KPI views, escalation tracking, and action management for Tier 1, 2, and 3. No blank boards. No manual data entry. See your first tier meeting in a 30-minute session.