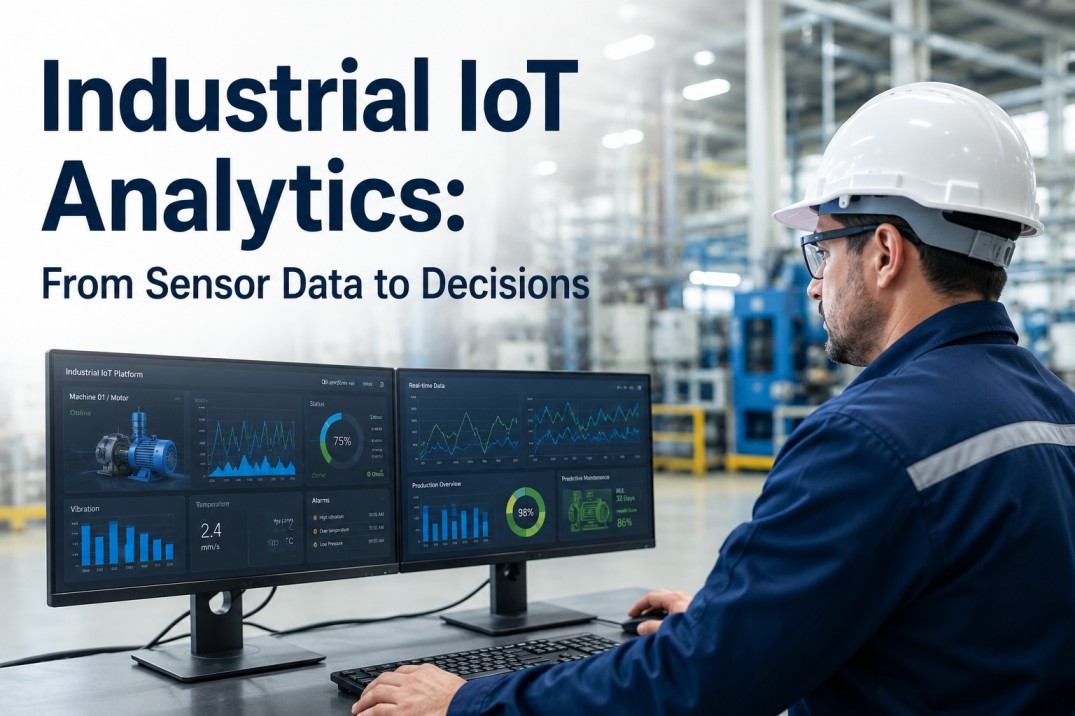
Industrial IoT analytics is the pipeline that turns raw sensor voltages into plant-floor decisions. A vibration sensor on a motor generates 86,400 data points per day. A single production line with 200 sensors generates 17 million data points daily. The challenge is not collecting this data — modern sensors and PLCs handle that automatically — but moving it through the stack: from the sensor, through edge processing, into the analytics platform, and finally to a decision that an operator or system acts on. iFactory's IIoT analytics platform closes this loop by ingesting sensor data through 150+ native connectors, processing it at the edge or in the cloud depending on latency requirements, and surfacing it in AI-powered dashboards that trigger automated actions when thresholds are breached. This page breaks down the full IIoT analytics stack layer by layer, explains the role of each component, and shows how the loop from sensor to decision works in practice. Each section includes typical data volumes, latency requirements, and technology choices so plant teams can map their current infrastructure against the full stack and identify the gaps that iFactory fills out of the box.
The Five Layers of the IIoT Analytics Stack
Every industrial IoT analytics deployment follows the same five-layer architecture, from the physical sensor on the machine to the decision support system that operators interact with. Understanding each layer helps plant teams diagnose bottlenecks, plan infrastructure investments, and evaluate platform capabilities.
Data Volume by Layer: How Much Data Each Stage Handles
Understanding data volume at each layer is critical for infrastructure planning — bandwidth provisioning, edge gateway specification, cloud storage sizing, and analytics processing capacity. The numbers below are based on a typical 200-sensor production line running 24/7.
| Layer | Volume per Day | Volume per Month | Latency Budget | Storage Type |
|---|---|---|---|---|
| Sensor & Acquisition | 50-100 GB raw | 1.5-3 TB | N/A — analog | PLC buffer |
| Edge Processing | 500 MB — 2 GB | 15-60 GB | 10-50ms | Edge SSD |
| IoT Platform & Data Lake | 2-5 GB ingested | 60-150 GB | 100ms-1s | Cloud data lake |
| Analytics & AI Engine | 50-200 MB outputs | 1.5-6 GB | 1-5 min | Time-series DB |
| Decision & Action | 10-50 MB served | 300 MB — 1.5 GB | < 500ms | Cache + CDN |
Three IIoT Analytics Deployment Scenarios
The right deployment architecture depends on plant size, existing infrastructure, and analytics maturity. These three scenarios cover the most common patterns iFactory encounters across its 200+ deployments.
A single facility with 50-200 sensors, existing PLCs, and 2-3 data sources. Edge gateway connects to PLCs and streams processed data to iFactory cloud. Dashboards live within 2 weeks. Ideal for plants taking their first step into IIoT analytics.
2-3 week deployment3-10 facilities with 200-500 sensors each, mixed PLC brands, CMMS and quality system integration. Edge gateways per plant with centralized cloud analytics. Cross-plant benchmarking and enterprise reporting. Typical for established manufacturers scaling IIoT.
6-8 week deployment10+ facilities with 500+ sensors each, real-time control requirements, AI model inference at edge, custom protocol integration. Hybrid edge-cloud architecture with local dashboards for operators and global analytics for leadership. For mature IIoT organizations.
10-14 week deploymentThe Sensor-to-Decision Pipeline: Five Stages of IIoT Data Flow
Data flows through five distinct stages from the moment a sensor samples a physical value to the moment a decision is made. Each stage has specific latency requirements, data volume characteristics, and technology choices. Understanding this pipeline is essential for designing a scalable IIoT analytics architecture.
Physical measurement at the sensor level. Sampling rates vary by application: temperature sensors sample at 0.1-1 Hz, vibration sensors at 1-10 kHz. Data is analog at this stage and digitized by the sensor or PLC.
Raw data is filtered, windowed, and compressed at the edge. Only meaningful events — threshold crossings, rate-of-change triggers, statistical summaries — are transmitted to the platform. Reduces bandwidth by 60-80%.
Data is time-aligned, normalized, and validated against quality rules. Missing timestamps are flagged. Units are standardized. The cleaned data feeds the analytics engine and is stored in the industrial data lake for historical analysis.
Pre-trained AI models run inference on the processed data stream — detecting anomalies, predicting failures, calculating OEE, optimizing energy. Prediction results are published as new data streams that feed dashboards and alert systems.
Dashboards update. Alerts fire. Automated control signals are sent to actuators or PLCs. Reports are generated. The loop closes when a decision — human or automated — changes a machine setting, a maintenance schedule, or a production plan.
IIoT Communication Protocols Compared
The choice of communication protocol directly impacts data latency, bandwidth consumption, security, and interoperability. Most plants use multiple protocols in parallel — MQTT for edge-to-cloud, OPC-UA for machine-to-platform, and HTTP for API integrations.
Best for: Edge-to-cloud telemetry, lightweight sensor data, bandwidth-constrained links
- Pub/sub model with broker architecture
- Minimal bandwidth overhead (2-byte header minimum)
- QoS levels for delivery reliability
- Last will and testament for disconnection alerts
- Supported by 90%+ of modern industrial sensors
Best for: Machine-to-platform, structured data with metadata, security-critical paths
- Built-in data modeling with type system
- Encryption and authentication at protocol level
- Historical data access built into the spec
- Pub/sub and client/server modes
- Native integration with Siemens, Rockwell, Schneider
Best for: API integrations, cloud-to-cloud, non-real-time data exchange
- Universal support across all platforms and languages
- Stateless request-response model
- Higher bandwidth overhead than MQTT
- Not designed for real-time streaming
- Best for configuration and management APIs
Edge vs Cloud: Where Does Each Analytics Task Run?
The decision to process data at the edge or in the cloud depends on latency requirements, data volume, and the criticality of the decision. iFactory supports both deployment models and can split processing across edge and cloud dynamically based on workload characteristics.
Frequently Asked Questions About IIoT Analytics
How much historical data do I need to start IIoT analytics?
You need at least 3-6 months of historical sensor data to establish baseline patterns for predictive models, but you can start generating immediate value from day one with descriptive analytics — OEE dashboards, quality trends, and energy consumption reports require no historical data, only live connections. iFactory's deployment process connects to your live data sources first and begins populating dashboards within days. Historical data ingestion runs in parallel and supports CSV import, database connector, or historian API for backfilling.
What sensors and protocols does iFactory support natively?
iFactory supports 150+ native connectors covering all major industrial protocols and sensor types. On the protocol side: OPC-UA, MQTT, Modbus TCP/RTU, Profinet, EtherNet/IP, BACnet, HTTP/REST, and Siemens S7. On the sensor side: vibration, temperature, pressure, flow, current, voltage, proximity, torque, acoustic emission, and vision systems. The platform also connects to PLCs from Siemens, Rockwell, Allen-Bradley, Mitsubishi, Schneider, and Beckhoff. If your sensor or system is not in the list, iFactory's integration SDK enables custom connector development within 1-2 weeks.
How much bandwidth does IIoT analytics require?
Bandwidth requirements depend on the level of edge processing deployed. Raw sensor data at 1 kHz sampling from 200 sensors generates approximately 50-100 GB per day — which is impractical for cloud transmission over standard plant networks. With edge aggregation — downsampling to 1-second averages, event-based triggers, and statistical summaries — the same data compresses to 500 MB to 2 GB per day. Most plants deploy edge gateways that perform this compression and transmit only meaningful data to the cloud. iFactory's edge agent handles compression, protocol conversion, and buffering automatically, so no manual configuration is required.
Can IIoT analytics run on existing plant infrastructure without new sensors?
Yes. Most plants already have significant sensor infrastructure through their PLC and SCADA systems. iFactory connects directly to these existing systems through protocol connectors — reading data from the PLC backplane or SCADA historian without adding new sensors. For use cases that require data not currently collected — vibration monitoring on non-instrumented assets or energy submetering — additional sensors can be added incrementally. iFactory's deployment approach always prioritizes connecting to existing data sources first and only recommends new sensors where the ROI is clearly justified by the analytics use case.
How is data security handled across the IIoT stack?
Data security is implemented at every layer of the IIoT stack. At the sensor and edge layer, communication uses TLS 1.3 encryption, and edge gateways are authenticated via certificate-based identity. At the platform layer, data is encrypted at rest using AES-256 and in transit using TLS. Role-based access control governs data visibility at the analytics and action layer — each user sees only the data their role permits. iFactory is SOC 2 Type II certified and supports deployment on customer-managed infrastructure for plants with strict data residency requirements. No raw sensor data is used for model training outside the customer's tenant.
How does iFactory handle edge gateway failures or network interruptions?
iFactory's edge agent is designed for resilience in industrial environments. When the network connection to the cloud platform is interrupted, the edge gateway continues operating independently — data ingestion, processing, and local alerting continue without interruption. Sensor data is buffered on the edge gateway's local SSD with configurable retention (typically 7-30 days). When connectivity is restored, the edge agent replays the buffered data to the cloud platform in chronological order, maintaining data continuity with accurate timestamps. The edge agent monitors its own health and generates a local alert if disk usage exceeds 80% or if the connection has been down for longer than a configured threshold. Most plants configure edge gateways with redundant network paths to minimize the frequency and duration of interruptions.