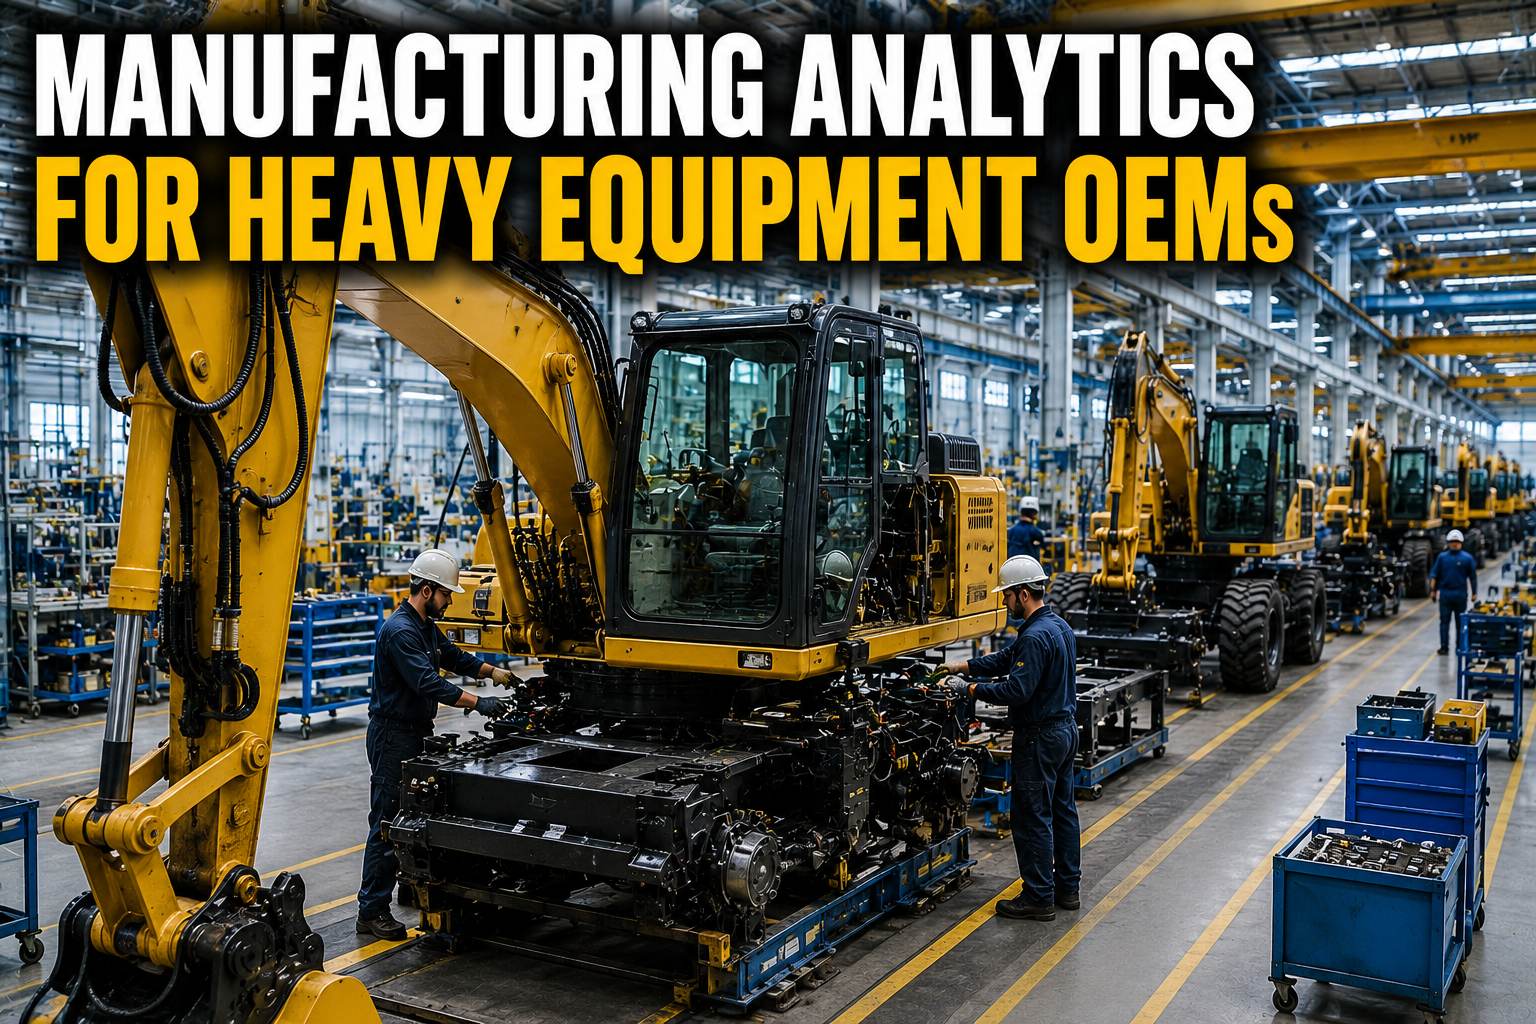
Heavy equipment OEMs face a different analytics challenge than discrete manufacturers. With production in the hundreds of units per year and multi-week build cycles, unit-level traceability matters far more than throughput. This guide presents seven analytics components for heavy equipment: a scoreboard, KPI cards, a discrete vs heavy comparison, an assembly flow SVG, use cases, a supplier scorecard, and a five-step roadmap.
Heavy Equipment Analytics — Built for the Way You Build Machines
Stop Using Spreadsheets for Serial Number Traceability, EOL Test Analytics, and Warranty Cost Tracking.
iFactory’s analytics platform is specifically designed for heavy equipment OEMs. It ingests data from MES, ERP, QMS, and dealer warranty systems to create a unified analytics layer with unit-level serial number genealogy, multi-day EOL test tracking, cross-plant KPI benchmarking, and supplier quality scorecards. Deployment connects to your existing plant-floor systems without replacing them, and pre-built dashboard templates for heavy equipment KPIs mean your first production dashboard goes live in weeks, not months. The platform supports multi-plant rollouts across excavator, mining truck, and agricultural equipment assembly operations with consistent data models and KPIs.
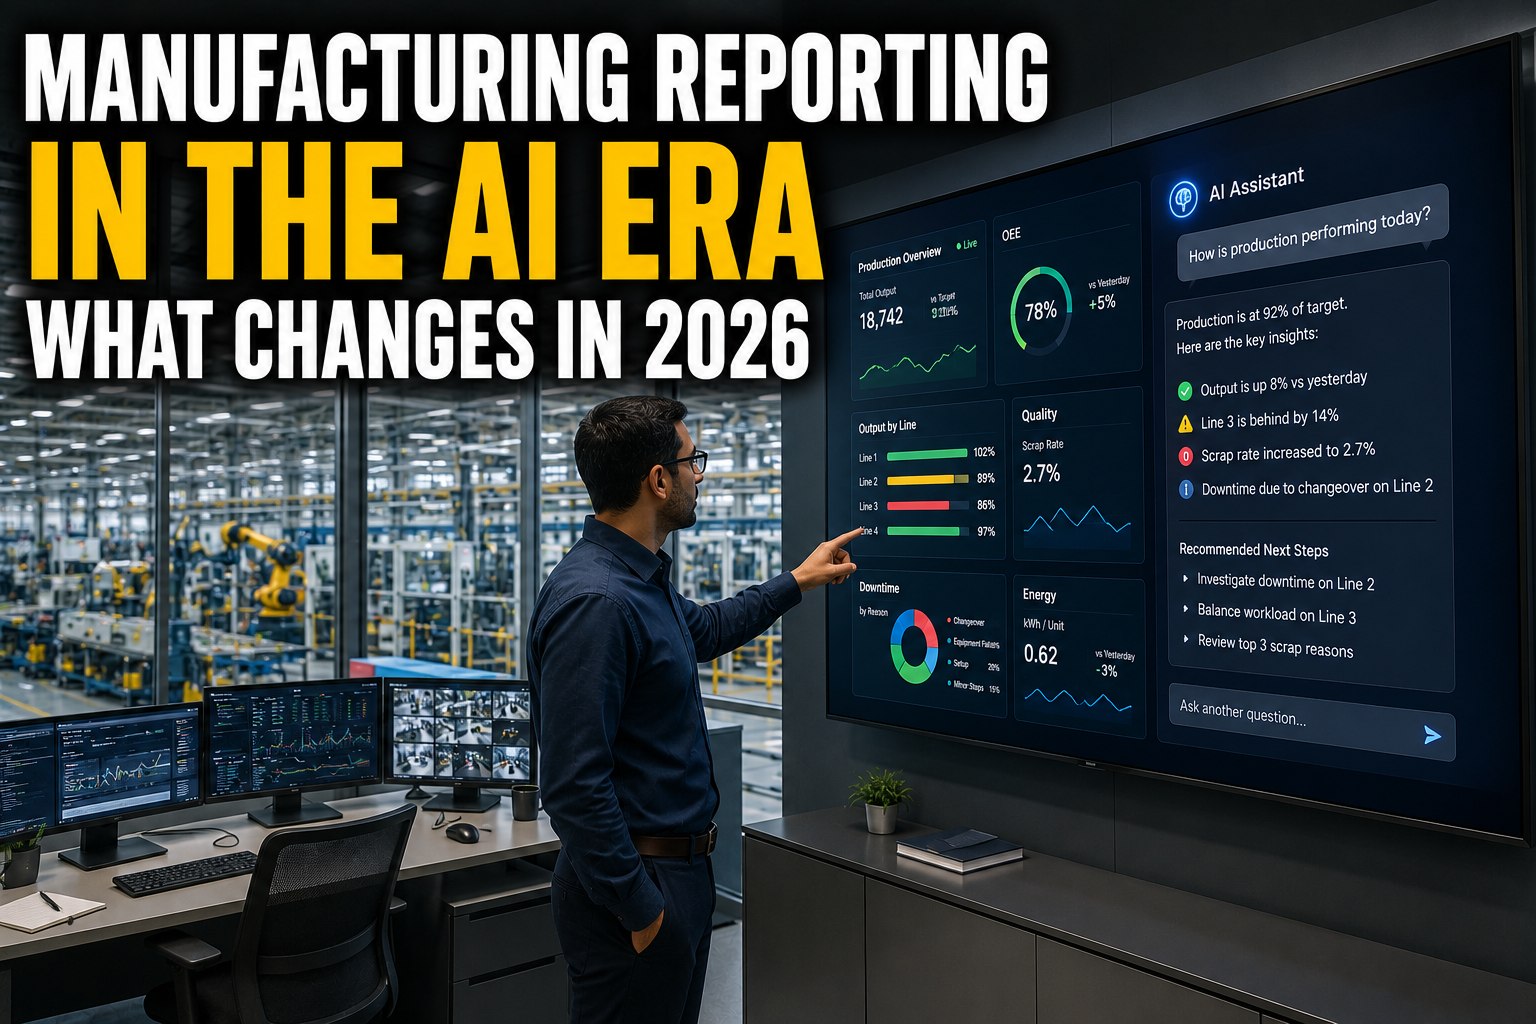
Heavy Equipment Plant Scoreboard
The scoreboard captures the four most critical plant-level metrics that every heavy equipment OEM should track: end-of-line test pass rate reflecting the cumulative quality of thousands of assembly operations, takt time adherence measuring line balance and throughput stability, annual scrap and rework cost as a direct profitability driver, and the number of plants integrated into the analytics platform for multi-site visibility. These four metrics provide an immediate snapshot of plant health and quality performance across the entire heavy equipment assembly operation.
Six Heavy-Equipment-Specific KPIs: Formulas, Benchmarks, and Business Drivers
These six KPIs are the foundation of heavy equipment manufacturing analytics. Each KPI is defined with a clear formula, industry benchmark range, and the business driver that connects the metric to operational and financial outcomes. EOL test pass rate and takt time adherence are the primary leading indicators of production quality and throughput, while warranty claim rate is the critical lagging indicator of field performance. Rework hours per unit, on-time delivery to dealers, and inventory turns complete the picture of operational efficiency and working capital performance.
Heavy Equipment vs Discrete Manufacturing: Eight Key Differences That Matter for Analytics
Heavy equipment OEMs operate under fundamentally different constraints than discrete manufacturers. Production volumes are two orders of magnitude lower, but each unit carries 20x the value and 10x the part count. Assembly cycles are measured in weeks not hours, and EOL testing spans days instead of minutes. This comparison table highlights eight dimensions where analytics requirements diverge significantly — from supply chain structure and quality standards to regulatory obligations and lead time expectations.
| Dimension | Heavy Equipment OEM | Discrete Manufacturing |
|---|---|---|
| Production Volume | 500–2,000 units/yr | 10,000–500,000+ units/yr |
| Product Value | $100K–$5M per unit | $10–$50K per unit |
| Assembly Complexity | 10,000+ parts per BOM | 500–2,000 parts per BOM |
| Testing Phase | Multi-day EOL test cycles | Minutes to hours per unit |
| Supply Chain | Global tier-1/tier-2 network | Regional supplier base |
| Quality Standards | ISO 9001 + customer-specific | ISO 9001 / TS 16949 |
| Lead Time | 6–20 weeks per unit | 1–4 weeks per unit |
| Regulatory | EPA, OSHA, ANSI, CE marking | Industry-specific certifications |
See How Heavy Equipment OEMs Are Using Analytics to Cut Scrap and Warranty Costs
Real-World Results: 26% Scrap Reduction, 18% Warranty Claim Reduction, 62% Faster Root Cause Analysis.
Heavy equipment OEMs using iFactory’s analytics platform consistently achieve measurable improvements within the first two quarters. EOL test analytics identify recurring failure modes that upstream process changes eliminate, directly reducing scrap and rework. Warranty analytics correlate field failures with production data to pinpoint root causes and drive targeted quality improvements. Serial number traceability reduces root cause analysis time from weeks to days by giving quality engineers a complete digital thread from raw material through every assembly station. Book a demo to see analytics dashboards built for excavator, mining truck, and agricultural equipment manufacturing.
Heavy Equipment Assembly Flow: Five Stages with Embedded Quality Gates
A typical heavy equipment assembly line spans five major stages, each with its own quality gate that captures inspection data, test results, and component serial numbers. Frame assembly involves welding, machining, and stress relief. Engine and drivetrain installation adds the powertrain. The hydraulics system includes pump, valve, and cylinder testing. Cab and controls assembly integrates the operator environment with wiring and HMI. The final EOL test stage performs function, load, leak, and paint inspection over one to three days. Each quality gate feeds data into the analytics platform for real-time pass/fail tracking and long-term trend analysis.
Six High-Impact Analytics Use Cases for Heavy Equipment OEMs
These six analytics use cases address the most pressing challenges in heavy equipment manufacturing: reducing end-of-line test failures, tracking warranty costs by model and component, maintaining serial number traceability across multi-plant operations, closing the quality loop with dealer feedback, improving tier-1 supplier quality, and benchmarking performance across plants. Each use case includes the expected business impact based on results achieved by heavy equipment OEMs currently using iFactory’s analytics platform.
Tier-1 Supplier Analytics Scorecard: Four Critical Metrics
Tier-1 supplier quality is a major determinant of heavy equipment assembly quality and field reliability given the high-value, long-lead-time components that go into each machine. The supplier scorecard tracks four metrics: on-time inbound delivery (OTIF), incoming defect rate at receiving inspection, lead time variability that can disrupt the assembly schedule, and cost variance from purchase order to invoice. Each metric is tracked by supplier and commodity, with automatic alerts when performance falls below target thresholds.
Five-Step Implementation Roadmap: Heavy Equipment Analytics Deployment
Deploying analytics across a multi-plant heavy equipment organisation requires a structured approach that respects the complexity of the operating environment. This five-step roadmap takes an OEM from current-state assessment through cross-plant scaling over a 25-to-37-week timeline. Each step includes specific activities, recommended duration, and success criteria. The roadmap is designed to deliver value at each phase — EOL analytics go live in the first two months, warranty tracking follows in months three and four, and multi-plant benchmarking provides ongoing improvement opportunities in the second half of the deployment.
Frequently Asked Questions
What makes heavy equipment analytics different from discrete manufacturing analytics?
Heavy equipment OEMs face fundamentally different analytics challenges than typical discrete manufacturers. Production volumes are one to two orders of magnitude lower, but each unit carries significantly higher value and complexity — a single mining truck or excavator can have 10,000+ parts in its bill of materials and a manufacturing cycle spanning weeks instead of hours. End-of-line testing is a multi-day process involving function tests, load tests, leak tests, and paint inspection, generating vast amounts of quality data per unit. Warranty costs are proportionally much higher because field failures involve expensive component replacements and machine downtime for the end customer. Serial number traceability is critical for regulatory compliance and liability management. Analytics solutions for heavy equipment must therefore handle deep per-unit genealogy, long-cycle quality tracking, and cross-plant aggregation across a small number of high-value data points rather than high-volume streaming data from thousands of identical units.
Which KPIs are most important for heavy equipment manufacturing analytics?
The most impactful KPIs for heavy equipment OEMs centre on quality, throughput, and cost at the unit level. End-of-line (EOL) test pass rate is the single most important quality metric because it reflects the cumulative quality of thousands of assembly operations — a pass rate below 92% typically indicates systemic issues in upstream processes that require immediate attention. Takt time adherence measures whether the assembly line is maintaining its planned cycle time, which is critical for meeting delivery commitments on high-value custom-configured machines. Rework hours per unit is a direct cost driver given the labour-intensive nature of heavy equipment assembly. Warranty claim rate per 1,000 units shipped is the ultimate field quality lagging indicator and directly impacts both profitability and brand reputation. On-time delivery to the dealer network and inventory turns complete the picture by capturing supply chain and working capital performance.
How do I implement serial number traceability for heavy equipment analytics?
Implementing serial number traceability in heavy equipment requires tracking each unit through every assembly station from raw material through final shipment. The approach involves assigning a unique serial number at the frame welding stage and then capturing quality data, test results, and component serial numbers at each subsequent station — engine installation, hydraulics, cab assembly, and EOL testing. The MES system records every operation with timestamps, operator ID, and measurements. This data is then linked to ERP records for the unit’s BOM, purchase orders, and warranty claims. The analytics platform aggregates this genealogy data to enable root cause analysis when field failures occur — for example, identifying that all units with a defective hydraulic pump came from the same supplier lot installed during a specific shift. iFactory’s analytics platform includes pre-built serial number traceability models that connect MES station data with ERP material records, giving quality engineers a complete digital thread for every unit produced across all plants.
What data sources need to be integrated for heavy equipment analytics?
A comprehensive heavy equipment analytics deployment typically integrates data from four primary source categories. The MES system is the most critical source, providing station-level production data, EOL test results, rework events, and serial number genealogy. The ERP system contributes BOM data, purchase order history, inventory levels, and cost accounting information. The quality management system (QMS) supplies non-conformance reports, CAPA records, supplier quality scores, and audit findings. Finally, dealer feedback and warranty systems provide field performance data — warranty claims, service reports, parts replacements, and customer complaints. IoT sensor data from the equipment itself (telematics, engine hours, fault codes) is increasingly being integrated to create a closed loop between production quality and in-service performance. The challenge for heavy equipment OEMs is that these systems often exist in silos across multiple plants, each with different data models, requiring a unified data lake or warehouse layer for integration.
What is the typical ROI timeline for heavy equipment analytics deployment?
Heavy equipment OEMs typically see initial ROI within 6 to 9 months of analytics deployment, with full payback achieved in 12 to 18 months. The fastest value realisation comes from EOL test analytics, which can reduce scrap and rework costs by 15–26% within the first two quarters by identifying recurring failure modes and feeding corrective actions back to upstream assembly stations. Warranty cost analytics typically follow in months 6 through 12 as the quality team correlates field failures with production data and implements targeted improvements. Multi-plant benchmarking generates value in the second year as standardised KPIs reveal performance gaps and enable best-practice transfer across sites. Typical annual savings for a mid-size heavy equipment OEM with three to five plants range from $2M to $5M, driven by scrap reduction, warranty cost reduction, improved labour efficiency, and reduced inventory carrying costs from better production planning.
Build Your Heavy Equipment Analytics Foundation — Start with EOL, Warranty, and Traceability
From Spreadsheets to Serial Number Traceability: Deploy Heavy Equipment Analytics in Weeks, Not Months.
iFactory’s heavy equipment analytics solution gives you the tools to track every unit from frame welding through EOL test and into the field. Pre-built dashboards for EOL pass rate, warranty claims, rework tracking, supplier quality, and multi-plant benchmarking go live without custom development. The platform connects to your existing MES, ERP, and QMS systems and supports the unique data structures of serialised heavy equipment production. Talk to an expert to see a demo configured for your plant’s equipment types and production volumes.