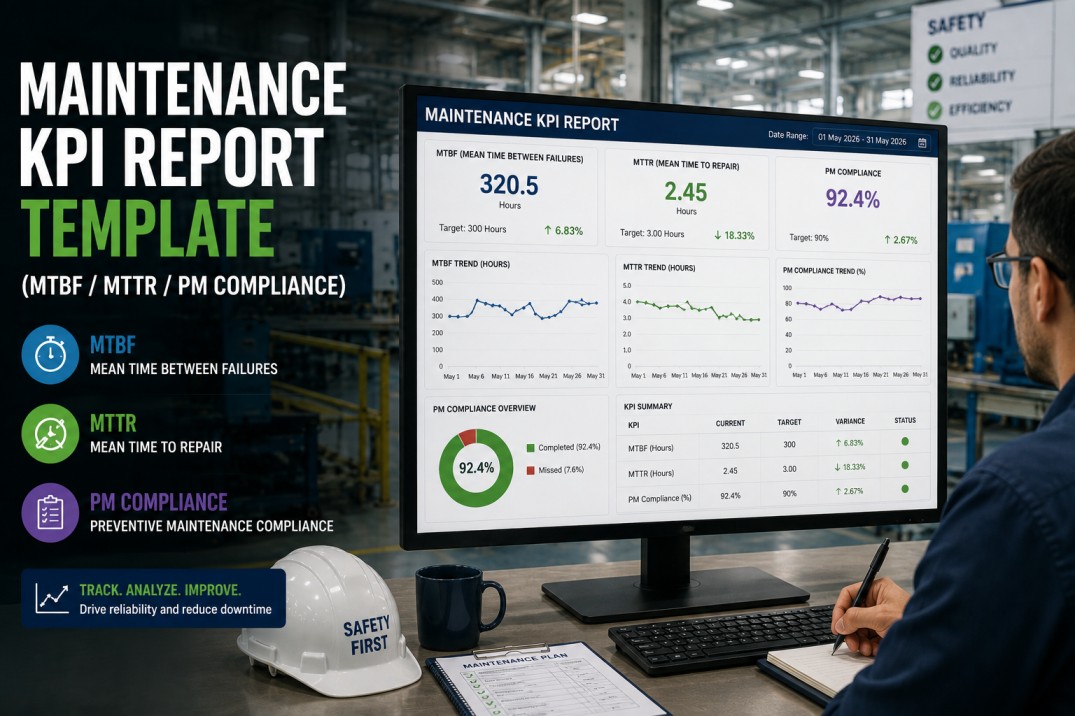
Maintenance reporting is the difference between a reactive firefighting culture and a reliability-driven organisation — yet most plant maintenance teams report only what broke and what was fixed. A complete maintenance reporting system tracks MTBF, MTTR, PM compliance, backlog health, schedule compliance, and maintenance cost per asset — and it connects every metric to the CMMS work order data that drives them. This maintenance reporting checklist covers everything required to build maintenance reports that reliability teams, plant managers, and finance actually use for decision-making. Based on iFactory's deployment across 1,000+ manufacturing plants, these 30 items ensure your maintenance reporting transforms raw work order data into actionable reliability intelligence.
Build Every Maintenance Report From Your CMMS Data — Live, Automated, Accurate
iFactory's maintenance reporting dashboard connects to your CMMS, calculates MTBF, MTTR, PM compliance, and backlog automatically, and delivers daily/weekly/monthly reports to every stakeholder. See your data in a 30-minute session.
Why Structured Maintenance Reporting Drives Reliability
Plants with structured maintenance reporting achieve 2.4x higher PM compliance, reduce emergency work orders by 43%, and extend mean time between failures (MTBF) by 31% within 12 months. The six pillars below form the foundation of a production-grade maintenance reporting system that converts work order data into reliability improvement.
Maintenance KPIs — What Your Reports Must Track
These six KPIs define whether your maintenance reporting system is driving reliability or just documenting breakdowns. Each KPI is calculated automatically from CMMS work order data in iFactory's maintenance reporting dashboard.
Mean Time Between Failures — total operating time divided by number of failures. Increasing trend indicates improving reliability. Calculated per asset, per asset class, and plant-wide.
Mean Time To Repair — total maintenance hours divided by number of repairs. Decreasing trend indicates improving maintainability. Tracked by asset class, failure mode, and shift.
Percentage of scheduled preventive maintenance tasks completed on time. Red-flagged below 85%, yellow 85–92%, green above 92%. The single best predictor of emergency WO reduction.
Total open work orders — breakdown by age (<7 days, 7–30 days, >30 days). Backlog older than 30 days must be reviewed monthly. Backlog trend indicates maintenance team capacity vs workload.
Percentage of planned maintenance tasks completed on the scheduled day. Below 80% indicates poor planning, resource constraints, or excessive emergency work disrupting the schedule.
Percentage of total maintenance hours worked as overtime. Above 15% indicates understaffing, excessive emergency work, or poor scheduling. Tracked per trade and per shift.
Maintenance Report Types — What to Report and to Whom
A complete maintenance reporting system serves four distinct audiences — shift supervisors, reliability engineers, plant management, and executive leadership. Each report type has specific content, cadence, and delivery method. Use this reference to design your reporting stack.
Automate Every Maintenance Report — From Daily Shift to Quarterly Audit
iFactory connects to your CMMS, calculates every maintenance KPI automatically, and delivers daily, weekly, monthly, and quarterly reports to the right people at the right time. No manual spreadsheets, no late reports.
Maintenance Reporting Checklist — 30 Items
Each checklist item includes the specific action required, type, priority, and status toggles. The type indicates whether the item is a pass/fail check, a structured selection, or a numeric configuration. Priority marks implementation order. Use the Photo, Required, and Critical toggles to track completion.
| # | Checklist Item | Type | Priority | Photo | Req. | Crit. |
|---|---|---|---|---|---|---|
| 1 | CMMS work order data feed established — all WOs exported with fields: WO ID, asset ID, WO type (PM, corrective, emergency), status, open date, close date, labour hours, downtime hours | Pass/Fail | High | — | ✓ | ✓ |
| 2 | Asset hierarchy loaded into the reporting system — plant → area → line → asset → component with unique asset IDs matching the CMMS asset register | Pass/Fail | High | — | ✓ | ✓ |
| 3 | Failure code taxonomy standardised across all maintenance teams — root cause, failure mode, and component codes must be consistent; no free-text failure entry allowed in CMMS | Pass/Fail | High | — | ✓ | ✓ |
| 4 | Spare parts inventory and cost data linked to each work order — parts consumed per WO with unit cost, total parts cost per WO, and parts lead time for backlog prioritisation | Pass/Fail | High | ✓ | ✓ | ✓ |
| 5 | Operating hours data feed per asset — PLC runtime totaliser or SCADA historian data matched to asset IDs for MTBF calculation; manual entry fallback if automation not available | Pass/Fail | High | — | ✓ | ✓ |
| # | Checklist Item | Type | Priority | Photo | Req. | Crit. |
|---|---|---|---|---|---|---|
| 6 | MTBF calculated per asset — total operating hours divided by number of failure events in the period; failure event defined as any corrective WO with >0 downtime hours | Pass/Fail | High | — | ✓ | ✓ |
| 7 | MTBF trend chart displayed per asset class — 12-month rolling MTBF with target line; assets below target flagged for reliability improvement review | Pass/Fail | High | — | ✓ | ✓ |
| 8 | Bad actor report configured — top-10 assets ranked by failure frequency, downtime hours, or total maintenance cost; reviewed weekly at maintenance stand-up meeting | Pass/Fail | High | — | ✓ | ✓ |
| 9 | Failure mode Pareto analysis automated — failure codes ranked by frequency with percentage contribution; top-3 failure modes per asset class drive root-cause analysis assignments | Pass/Fail | Med | — | ✓ | — |
| 10 | Weibull analysis or reliability growth chart available per critical asset — distribution fitting of time-between-failures data for predicting future failure probability and planning spares | Pass/Fail | Med | — | — | — |
| # | Checklist Item | Type | Priority | Photo | Req. | Crit. |
|---|---|---|---|---|---|---|
| 11 | MTTR calculated per asset and per failure mode — total repair hours divided by number of repairs; repair hours = labour hours from WO close-out, not estimated | Pass/Fail | High | — | ✓ | ✓ |
| 12 | MTTR breakdown by trade and shift — electrician vs mechanic vs technician MTTR; day shift vs night shift vs weekend MTTR; identifies training and staffing gaps | Pass/Fail | High | — | ✓ | ✓ |
| 13 | Mean time to diagnose vs mean time to repair separated — MTTR split into diagnosis time (troubleshooting) and repair time (hands-on tools); diagnosis time >50% of MTTR flags training or documentation gaps | Pass/Fail | High | — | ✓ | ✓ |
| 14 | Spare parts availability impact on MTTR tracked — WOs delayed waiting for parts flagged; parts stock-out frequency and average delay hours reported monthly | Pass/Fail | Med | — | ✓ | — |
| 15 | Maintenance procedure availability tracking — percentage of critical assets with up-to-date maintenance procedures in CMMS; procedure gaps linked to higher MTTR and flagged for documentation | Pass/Fail | Med | — | — | — |
| # | Checklist Item | Type | Priority | Photo | Req. | Crit. |
|---|---|---|---|---|---|---|
| 16 | PM compliance calculated per asset and per PM type — percentage of PM tasks completed on or before the scheduled due date; tasks completed late count as non-compliant | Pass/Fail | High | — | ✓ | ✓ |
| 17 | Overdue PM report configured — all PMs past due date listed with aging in days, asset ID, PM type, and assigned technician; reviewed daily at morning stand-up | Pass/Fail | High | — | ✓ | ✓ |
| 18 | PM schedule compliance tracked — percentage of PMs completed on the scheduled day vs within the grace period; grace period flag is acceptable only for non-critical PMs | Pass/Fail | High | — | ✓ | ✓ |
| 19 | PM effectiveness metric calculated — failure rate comparison for assets before and after PM program changes; if PM compliance is >90% but failure rate is not improving, the PM content is wrong | Pass/Fail | Med | — | ✓ | — |
| 20 | PM optimisation trigger configured — when PM compliance exceeds 90% for 6 consecutive months AND failure rate for the asset class is flat or increasing, PM content and frequency review is triggered automatically | Pass/Fail | Med | — | — | — |
| # | Checklist Item | Type | Priority | Photo | Req. | Crit. |
|---|---|---|---|---|---|---|
| 21 | Work order backlog by aging bucket visualised — <7 days, 7–30 days, >30 days buckets with count and total estimated hours per bucket; >30-day backlog requires monthly review | Pass/Fail | High | — | ✓ | ✓ |
| 22 | Backlog by priority classification — emergency, urgent, routine, and deferred WOs tracked separately; emergency WO count trend is the lead indicator for maintenance system health | Pass/Fail | High | — | ✓ | ✓ |
| 23 | Maintenance capacity model configured — available technician hours per week vs planned and emergency demand; capacity utilisation reported weekly with trend chart | Pass/Fail | High | — | ✓ | ✓ |
| 24 | Backlog resolution rate tracked — number of WOs closed per week vs number opened; consistent deficit indicates growing backlog and requires root-cause intervention | Pass/Fail | Med | — | ✓ | — |
| 25 | Deferred maintenance value calculated — estimated cost and hours of all WOs deferred beyond 30 days; reported quarterly to plant management with risk assessment for each deferred item | Pass/Fail | Med | — | — | — |
| # | Checklist Item | Type | Priority | Photo | Req. | Crit. |
|---|---|---|---|---|---|---|
| 26 | Daily maintenance stand-up meeting established with live dashboard — review emergency WOs, overdue PMs, backlog changes, and critical asset status; duration ≤15 minutes | Pass/Fail | High | — | ✓ | ✓ |
| 27 | Weekly maintenance review scheduled with standard agenda — bad actor review, top-3 failure modes, overdue PM action plan, capacity vs demand review, action items from prior week | Pass/Fail | High | — | ✓ | ✓ |
| 28 | Monthly reliability report automated to plant manager — all KPIs with trend charts, top-10 bad actors, PM compliance by asset class, maintenance cost summary, and action plan | Pass/Fail | High | — | ✓ | ✓ |
| 29 | Maintenance KPI targets defined and loaded per metric — MTBF target, MTTR target, PM compliance target, schedule compliance target, backlog limit, overtime limit; KPI traffic-light status displayed on dashboard | Numeric | Med | — | ✓ | — |
| 30 | Annual maintenance audit report cycle active — year-over-year KPI comparison, reliability initiative ROI calculation, audit findings register, and strategic improvement plan for next 12 months | Pass/Fail | Med | — | — | — |
PM Effectiveness Classification — Beyond Compliance Percentage
PM compliance alone does not guarantee reliability. A plant can achieve 95% PM compliance while failure rates remain flat if the PM content is wrong. Use this classification to assess the effectiveness of your preventive maintenance program, not just the completion rate.
PM tasks focused on finding problems that have already occurred. Visual inspection, oil analysis, thermography. Essential but not sufficient for proactive reliability. Compliance minimum: 85%.
Time-based replacement of components before expected end of life. Filter changes, lubrication, belt replacement. Compliance minimum: 90%. Requires accurate component life data from MTBF tracking.
Condition-based maintenance triggered by sensor data — vibration, temperature, current, oil particle count. Compliance measured by data collection completeness, not task completion. Minimum data availability: 95%.
AI-optimised maintenance schedule that balances risk, cost, and production schedule. Maintenance is performed at the optimal time — not too early (waste) and not too late (failure). Target state for critical assets.
Maintenance Reporting Maturity Levels
Maintenance reporting maturity progresses from reactive work-order logging to predictive reliability analytics. Each level unlocks new capabilities for reducing downtime, extending asset life, and optimising maintenance spend.
Reactive
Work Order LogMaintenance records what broke and what was fixed. No KPI calculations. No PM compliance tracking. Reports are manual — typically a printed WO log reviewed at weekly meetings. No trend analysis.
Descriptive
KPI DashboardMTBF, MTTR, PM compliance, and backlog calculated automatically from CMMS data. Monthly reliability report generated. Bad actors identified. KPI traffic-light status visible. Trend charts available.
Diagnostic
Root-Cause AnalyticsFailure mode Pareto analysis with root-cause correlation. MTTR breakdown by trade, shift, and failure mode. PM effectiveness analysis. Weibull analysis for critical assets. Deferred maintenance risk quantification.
Predictive
AI-Driven ReliabilityFailure prediction models alert before breakdown. Maintenance schedule optimised by AI balancing risk and cost. Spare parts demand forecasting integrated. Predictive maintenance triggers PM content updates automatically.
Maintenance Reporting Deployment Stages
iFactory deploys maintenance reporting in four stages. Each stage adds reporting depth and analytical sophistication — from basic WO tracking to fully automated reliability intelligence with predictive analytics.
- Connect CMMS data source — WO export, asset hierarchy, failure codes, parts inventory
- Map CMMS fields to standard maintenance KPI schema
- Standardise failure code taxonomy across all maintenance teams
- Link operating hours data feed per asset for MTBF calculation
- Configure MTBF, MTTR, PM compliance, and backlog KPI calculations
- Set up daily, weekly, monthly, and quarterly report templates
- Build bad-actor Pareto and failure mode frequency charts
- Configure KPI target thresholds and traffic-light status indicators
- Enable MTTR breakdown by trade, shift, and failure mode
- Configure PM effectiveness metric — failure rate vs PM compliance correlation
- Set up Weibull analysis or reliability growth charts for critical assets
- Build deferred maintenance value report with risk classifications
- Establish daily stand-up and weekly review meeting with live dashboard
- Automate monthly reliability report to plant manager and quarterly audit report
- Configure PM optimisation triggers — compliance >90% but failure rate flat triggers review
- Deploy capacity model and set annual maintenance audit cycle
Maintenance Reporting — Frequently Asked Questions
What is the difference between MTBF and MTTR in maintenance reporting?
MTBF (Mean Time Between Failures) measures reliability — how long an asset operates on average before it fails. It is calculated as total operating hours divided by number of failures. Higher MTBF is better. MTTR (Mean Time To Repair) measures maintainability — how long it takes on average to repair an asset after failure. It is calculated as total repair hours divided by number of repairs. Lower MTTR is better. These two metrics together define the availability of an asset: Availability = MTBF / (MTBF + MTTR). A maintenance reporting system must track both to provide a complete picture — MTBF tells you if your PM program is working, MTTR tells you if your repair processes and spare parts strategy are effective.
What is a good PM compliance target for manufacturing plants?
The industry benchmark for PM compliance is 90% for non-critical assets and 95% for critical assets. However, the target depends on your maintenance maturity level. Plants operating at Level 1 (reactive) may start with 70% as a realistic target and increase by 5% per quarter. The key insight from iFactory's deployment data is that PM compliance above 92% without corresponding improvement in failure rate indicates that the PM content needs optimisation — you are doing the wrong PM tasks on schedule. The most effective plants maintain 90–95% PM compliance AND track PM effectiveness (failure rate trend) to ensure compliance is translating into reliability improvement.
How does maintenance reporting connect to OEE?
Maintenance reporting provides the availability factor for OEE calculation — one of the three OEE factors alongside performance and quality. The availability factor is calculated as planned production time minus downtime divided by planned production time. The downtime data required for OEE availability comes directly from maintenance work orders — specifically from the downtime hours field on corrective and emergency WOs. A properly configured maintenance reporting system automatically feeds downtime data into the OEE calculation, eliminating the need for separate downtime tracking. Additionally, maintenance backlog and PM compliance are lead indicators for future OEE — a growing backlog or declining PM compliance predicts future OEE degradation before it happens.
How do you calculate maintenance backlog and what is a healthy level?
Maintenance backlog is calculated as the total number of open work orders (or total estimated hours of open WOs) at any point in time. It is typically grouped into aging buckets: less than 7 days (normal), 7–30 days (watch list), and more than 30 days (deferred). A healthy backlog level is 2–4 weeks of planned maintenance work based on available technician capacity. If backlog exceeds 4 weeks, assets are at risk of failure due to deferred maintenance. If backlog is less than 1 week, the maintenance team may be overstaffed or PM frequencies may be too low. The most important metric is not the backlog size itself but its trend — a consistently growing backlog indicates capacity or process problems that require intervention.
What data quality issues commonly affect maintenance reporting accuracy?
Five data quality issues most commonly distort maintenance reporting: (1) inconsistent failure codes — technicians use free-text or different codes for the same failure, making Pareto analysis unreliable, (2) missing downtime hours — WOs closed without recording the actual downtime hours, making MTBF and availability calculations inaccurate, (3) incorrect asset hierarchy — WOs assigned to the wrong asset ID, causing incorrect MTBF per asset, (4) labour hours not recorded — technicians forget to log hours, making MTTR unreliable, and (5) PMs completed late but marked on-time — WOs closed after the due date but recorded as completed on the scheduled date, inflating PM compliance. iFactory's maintenance reporting dashboard includes data quality checks that flag these issues automatically and exclude unreliable data from KPI calculations until corrected.
How does iFactory integrate with existing CMMS systems for maintenance reporting?
iFactory connects to any CMMS that provides data access — including SAP PM, Oracle EAM, IBM Maximo, Fiix, MaintainX, UpKeep, eMaint, and over 50 other CMMS platforms. Integration methods include REST API (preferred for real-time sync), database views (read-only replica for reporting), or flat-file import (CSV/Excel for legacy systems without API support). The integration is read-only — iFactory never writes to your CMMS. Data is extracted, transformed into the standard maintenance KPI schema, and made available in the reporting dashboard within minutes of CMMS data updates. For plants without a CMMS, iFactory includes a built-in work order management module that can serve as the primary maintenance data source.
Automate Your Maintenance Reporting — From MTBF to PM Compliance in One Dashboard
iFactory connects to your CMMS, calculates every maintenance KPI automatically, and delivers daily, weekly, monthly, and quarterly reports to every stakeholder. See your first maintenance report in a 30-minute demo session.