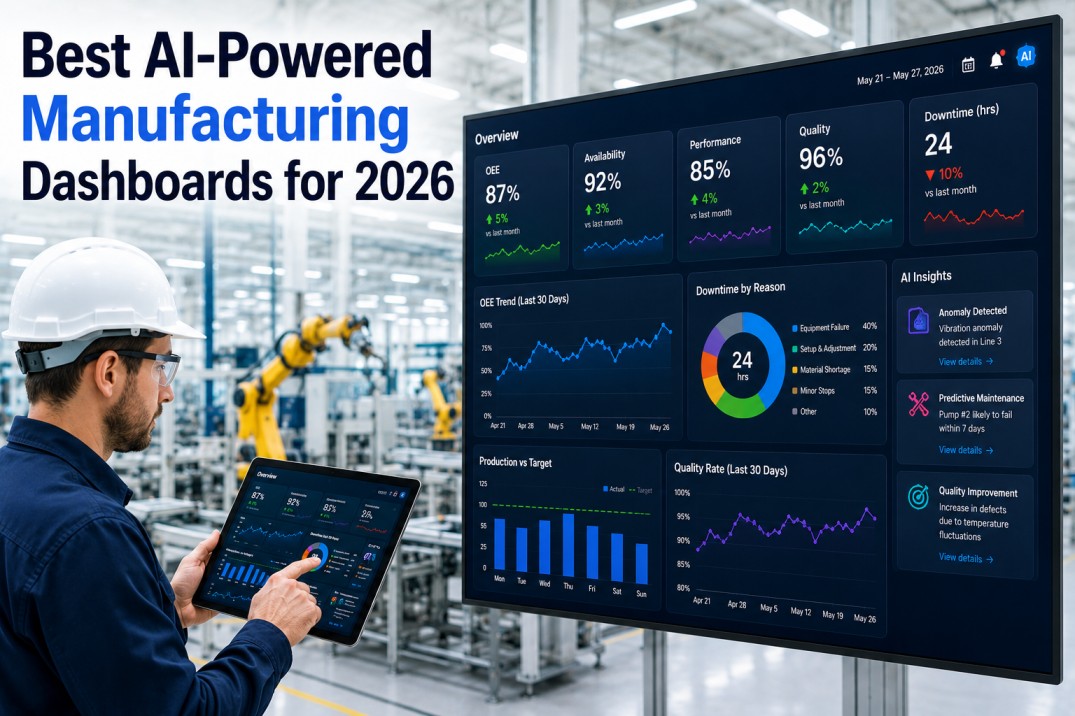
Choosing the right analytics platform for a manufacturing plant is fundamentally different from selecting a general-purpose business intelligence tool. ThoughtSpot pioneered search-driven analytics, allowing users to type natural-language queries and get instant visualisations. That capability is powerful for business analysts exploring broad datasets, but manufacturing environments demand something more: real-time data from production systems, pre-built KPI libraries for metrics like OEE and FPY, role-specific dashboards for operators and plant managers, and connectivity to industrial protocols and plant-floor databases. Many manufacturing teams find that ThoughtSpot’s general-purpose design requires significant custom development, expensive consulting, and ongoing maintenance to meet plant-floor analytics requirements. This guide evaluates eight ThoughtSpot alternatives across ten critical criteria specifically for manufacturing use cases. Each alternative is assessed for its manufacturing readiness, real-time capabilities, total cost of ownership, and suitability for different plant profiles, from small single-line facilities to multi-plant global enterprises. The goal is to help manufacturing leaders make an informed decision based on their specific operational context, data infrastructure, and user community.
See How iFactory Compares Head-to-Head with Every Alternative
Stop Guessing Which Platform Fits Your Plant. Get a Side-by-Side Comparison Across the Ten Criteria That Matter Most for Manufacturing.
Every analytics platform looks good in a demo. The real question is how each one performs under the specific demands of a manufacturing environment — real-time data ingestion, industrial protocol support, pre-built KPI libraries, role-based dashboards, and unlimited user scaling. This comparison table scores eight platforms across ten manufacturing-critical criteria so you can see exactly where each alternative stands. iFactory is the only platform purpose-built for manufacturing, scoring 10/10 on the criteria that matter most to plant-floor teams. Book a demo to see the data behind the comparison.
ThoughtSpot Alternatives Evaluation Scoreboard
The scoreboard provides a quick-reference summary of the evaluation landscape — eight leading alternatives benchmarked against ThoughtSpot for manufacturing-specific analytics use cases. The metrics capture the breadth of the evaluation, the average cost savings reported by organisations migrating to these alternatives, the typical deployment timeline from sign-off to go-live, and the average user adoption rate across manufacturing teams. These four indicators set the stage for a deeper assessment of each platform’s manufacturing readiness.
Eight ThoughtSpot Alternatives: Detailed Tool-by-Tool Review
Each alternative is presented with its category (Full BI, Self-Serve, or Manufacturing Native), a one-line summary of its unique value proposition, a star rating reflecting manufacturing suitability, its best-fit use case, and a concise rationale explaining why it belongs on the shortlist. The eight alternatives span the full spectrum from general-purpose enterprise BI platforms like Power BI and Tableau to manufacturing-native solutions like iFactory that are purpose-built for plant-floor analytics.
Ten-Criteria Comparison Matrix: How the Alternatives Stack Up
The comparison matrix scores each alternative against ten criteria that manufacturing organisations consistently identify as most important when evaluating analytics platforms. Manufacturing Native indicates whether the platform was purpose-built or requires customisation for plant-floor use. Real-Time and Auto-Refresh assess data freshness capabilities. Mobile and Alerts evaluate operational accessibility. Ad-Hoc Query and Drill-Down measure analytical depth. Pre-Built Templates assesses deployment speed. Pricing Tier and Ease of Use capture total cost and learning curve. The verdict column summarises the overall recommendation for manufacturing use.
| Tool | Manufacturing Native | Real-Time | Auto-Refresh | Mobile | Alerts | Ad-Hoc Query | Drill-Down | Pre-Built Templates | Pricing Tier | Ease of Use | Verdict |
|---|---|---|---|---|---|---|---|---|---|---|---|
| Power BI | Low | Strong Alternative | |||||||||
| Tableau | Mid | Strong Alternative | |||||||||
| Looker | Mid | Good Fit | |||||||||
| Qlik | Mid | Good Fit | |||||||||
| Sisense | Mid | Good Fit | |||||||||
| Domo | Mid | Good Fit | |||||||||
| Zoho Analytics | Low | Limited | |||||||||
| iFactory | Low | Strong Alternative |
Which Alternative Fits Your Plant? Take the 3-Minute Assessment
Answer Six Questions and Get a Personalised Recommendation Matched to Your Plant Profile, Data Infrastructure, and Budget.
Not every alternative fits every plant. A single-line facility with five operators has different requirements than a multi-plant automotive tier-1 supplier with dozens of production lines and thousands of data points per second. This short assessment matches your plant profile — including data sources, team size, real-time requirements, budget range, and priority use case — to the alternative that best fits your specific context. The recommendation includes the primary platform, a runner-up, and a rationale explaining the fit. Start the assessment and see which alternative ranks highest for your plant.
Decision Flow Chart: Choose the Right Alternative for Your Plant
This decision flow chart guides manufacturing leaders through a structured selection process based on their most critical requirements. Start by determining whether your analytics need is manufacturing-specific or general-purpose, then follow the branches based on search/query needs, full BI requirements, cloud preference, and real-time plant-floor focus. Each path leads to the most appropriate alternative or set of alternatives for that profile. Use this flow as a starting point for your evaluation process, then dive into the detailed comparison matrix for a full picture.
Six Critical Capability Dimensions: How the Alternatives Compare
Beyond feature checklists, six capability dimensions define how well an analytics platform serves manufacturing use cases in practice. Data Connectivity assesses native support for plant-floor systems and industrial protocols. Real-Time Processing evaluates sub-second data ingestion and alerting. Manufacturing KPIs measures pre-built metric libraries versus manual definition. Mobile Access covers responsive design and alert notifications. User Training Required reflects the learning curve for plant-floor personnel. Total Cost captures licensing, infrastructure, and implementation costs over three years. Each dimension is rated on a five-point scale with the strongest alternatives noted.
Pricing Comparison: Licensing Models and Total Cost of Ownership
Pricing varies dramatically across the eight alternatives, from under $1,000/year for small-plant self-service options to enterprise agreements exceeding six figures for large-scale deployments. The pricing table presents the licensing model (Per-User, Per-Core, or Flat), the typical monthly or per-user price range, the key features included at the entry-level tier, and the best-fit company size for each platform. Manufacturing organisations should pay particular attention to the total cost of scaling — platforms with per-user pricing become expensive when giving dashboard access to dozens or hundreds of plant-floor workers.
Scenario-Based Recommendations: The Right Alternative for Six Common Manufacturing Use Cases
The best analytics platform depends on the specific use case. A plant focused on real-time OEE tracking has different requirements than a corporate team rolling out self-service BI across multiple sites. These six scenario cards map common manufacturing analytics use cases to the recommended platform and runner-up, with a one-sentence rationale explaining why that platform is the best fit for the scenario. Use these recommendations as a starting point and validate them against the full comparison matrix.
Frequently Asked Questions
Why should manufacturers consider ThoughtSpot alternatives?
ThoughtSpot is a powerful search-driven analytics platform, but its general-purpose design means it lacks several manufacturing-specific features that plant-floor teams need. Manufacturing environments require real-time data ingestion from production systems (PLCs, SCADA, MES), pre-built KPI libraries for metrics like OEE, FPY, and DPPM, role-specific dashboards for operators, supervisors, and plant managers, and native support for manufacturing data models like equipment hierarchies and bill-of-material structures. ThoughtSpot excels at search-based analytics for business users, but manufacturing teams often find themselves building custom data models, writing complex formulas for standard manufacturing KPIs, and manually connecting to plant-floor data sources. Alternatives like iFactory, Power BI with manufacturing connectors, and Qlik with associative data modelling offer more manufacturing-ready capabilities with faster deployment timelines and significantly lower total cost of ownership for plant-specific use cases.
What manufacturing-specific features does ThoughtSpot lack?
ThoughtSpot lacks several features that manufacturing teams typically require for effective plant-floor analytics. First, real-time data ingestion from industrial protocols (OPC UA, Modbus, MQTT) is not natively supported, requiring middleware or custom connectors to bridge plant-floor systems. Second, there are no pre-built manufacturing KPI libraries, so every standard metric (OEE, FPY, DPPM, MTBF, MTTR, energy intensity) must be manually defined and calculated. Third, role-based dashboard templates designed for operators, supervisors, and plant managers are absent, forcing teams to build from scratch. Fourth, manufacturing-specific visualisations like control charts, Pareto charts, production loss waterfalls, and equipment hierarchy drill-downs are not available as pre-built components. Fifth, the pricing model (per-user licensing) can become expensive when scaling analytics to dozens or hundreds of plant-floor users who need read-only dashboard access. These gaps mean manufacturing IT teams spend more time building and maintaining the analytics platform than actually analysing production performance.
How does iFactory compare to ThoughtSpot for plant-floor analytics?
iFactory is purpose-built for manufacturing analytics, while ThoughtSpot is a general-purpose search-driven BI platform. For plant-floor use cases, iFactory offers several advantages: it ingests data natively from PLCs, SCADA systems, MES, and ERP through pre-built connectors without middleware; it includes out-of-the-box KPI libraries for OEE, FPY, DPPM, OTD, energy intensity, and dozens of other manufacturing metrics; it provides role-specific dashboards for operators, supervisors, plant managers, and executives with pre-configured layouts; it supports real-time data refresh at sub-second intervals with push-based alerting when thresholds are exceeded; and it uses a flat pricing model with unlimited users, making it cost-effective for scaling across the entire plant workforce. ThoughtSpot remains a strong option for enterprise-wide search-based analytics where users need natural-language querying of large datasets, but iFactory delivers faster time-to-value for plant-floor analytics with significantly less custom development and lower total cost for manufacturing teams.
What is the total cost comparison between ThoughtSpot and its alternatives?
Total cost of ownership (TCO) for analytics platforms varies significantly based on deployment model, user count, and integration requirements. ThoughtSpot’s pricing starts at approximately $60,000/year for cloud deployments with per-user licensing that scales linearly with user count, making it expensive for organisations that need to give dashboard access to dozens or hundreds of plant-floor workers. iFactory offers a flat subscription model starting at $995/month ($11,940/year) with unlimited users, making it substantially more cost-effective for manufacturing teams. Power BI Pro costs approximately $10/user/month ($120/user/year), while Power BI Premium starts at $4,995/month for dedicated capacity. Tableau costs $15–75/user/month depending on the edition. Qlik starts at $15/user/month for basic access. Domo starts at approximately $15/user/month with a minimum user commitment. Zoho Analytics is the most affordable option starting at under $300/year. Beyond licensing, consider implementation costs — general-purpose BI platforms typically require 8–16 weeks of consulting to build manufacturing-specific data models and dashboards, while manufacturing-native platforms like iFactory can deploy in 2–4 weeks with minimal external consulting.
How long does it take to migrate from ThoughtSpot to an alternative platform?
Migration timelines depend on the complexity of your current ThoughtSpot deployment, the number of dashboards and data sources, and the target platform’s manufacturing readiness. A typical migration from ThoughtSpot to a general-purpose BI platform like Power BI or Tableau takes 8–16 weeks and involves data model redesign (ThoughtSpot’s search-index model differs significantly from traditional semantic models), dashboard rebuild (no automated migration path exists for ThoughtSpot dashboards), user retraining (ThoughtSpot’s search interface differs from the drag-and-drop exploration of most BI tools), and integration reconfiguration (data source connections must be re-established and optimised for the target platform). Migration to a manufacturing-native platform like iFactory is typically faster (2–4 weeks) because the platform includes pre-built manufacturing data models, KPI libraries, and dashboard templates that align with common plant-floor use cases. Organisations should budget for a parallel-run period of 4–8 weeks where both systems operate simultaneously to validate data accuracy and user adoption before decommissioning ThoughtSpot.
Stop Evaluating. Start Seeing Results on the Plant Floor.
iFactory Is the Only Manufacturing-Native Analytics Platform in This Comparison. Deploy in Weeks, Not Months.
You have read the comparison, scored the matrix, and followed the decision flow. Now it is time to stop evaluating and start seeing results on your plant floor. iFactory is built from the ground up for manufacturing analytics — pre-built OEE, quality, production, energy, and maintenance dashboards, native connectivity to 200+ industrial data sources, real-time alerts that push to operator mobile devices, and a flat pricing model with unlimited users. Deployment takes two to four weeks, not the eight to sixteen weeks typical of general-purpose BI platforms. Book a demo to see iFactory running on real manufacturing data from a plant like yours.