Overall Equipment Effectiveness is the single metric that tells you whether your manufacturing equipment is actually producing what it should — at the speed it should — with the quality it should. Every minute of unplanned downtime, every cycle running slower than designed, and every defective part that comes off the line reduces OEE. The formula is straightforward: Availability multiplied by Performance multiplied by Quality. What makes OEE powerful is not the number itself — it is that the three factors tell you exactly where to look for the biggest improvement opportunity. If OEE is low, the component that is dragging it down tells you whether the problem is downtime, slow cycles, or quality losses. This page explains what OEE measures, how to calculate it, what world-class looks like, and how to improve each factor systematically.
See OEE Calculated Live for Every Machine, Every Shift — Without Spreadsheets
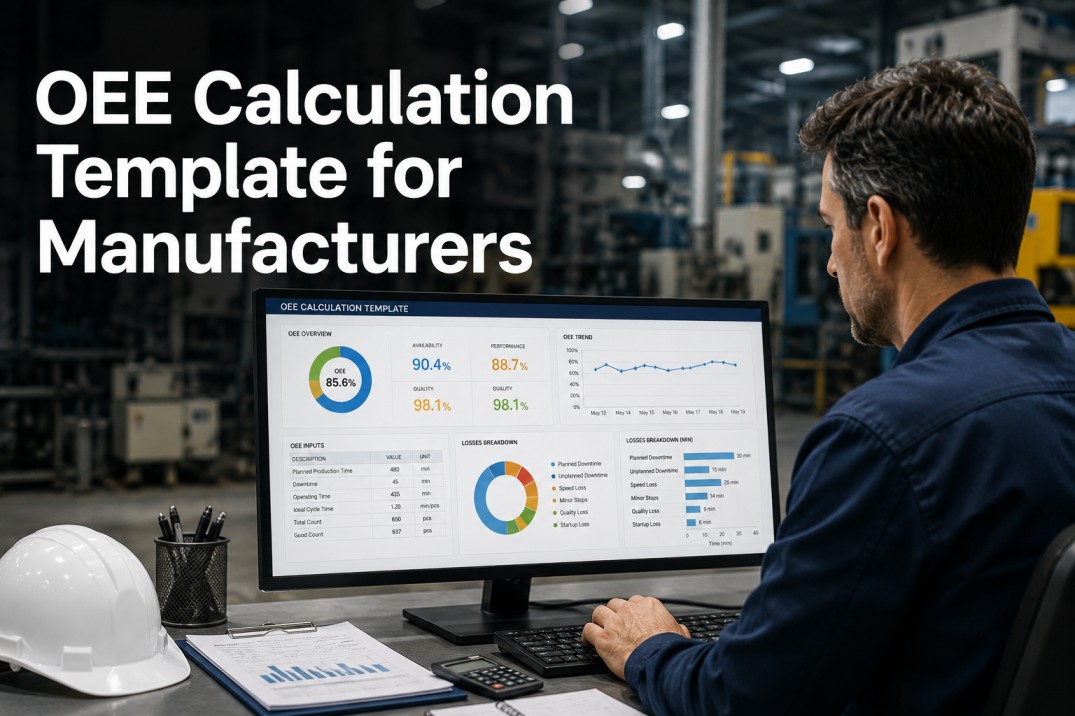
iFactory calculates Availability, Performance, and Quality automatically from production data and PLC signals. OEE dashboards update in real time. Drill down to see which loss category is costing you the most production time.
What Is Overall Equipment Effectiveness (OEE)?
OEE is a manufacturing performance metric defined by the Japan Institute of Plant Maintenance (JIPM) as part of the Total Productive Maintenance (TPM) methodology. It measures how effectively a manufacturing operation is utilised compared to its full potential during planned production time. OEE is expressed as a percentage — 100% OEE means the operation is producing only good parts, at the maximum possible speed, with zero downtime during planned production time.
OEE was developed to support autonomous maintenance and continuous improvement in manufacturing. It is not a diagnostic tool in itself — it is an indicator that tells you a problem exists. When OEE drops below target, the three component factors point to where the problem lives: low Availability means time is being lost to stops, low Performance means speed is below ideal, and low Quality means output is being rejected or reworked.
OEE is always measured against planned production time — the time the equipment is scheduled to run. It does not include time when the plant is not scheduled to operate, such as weekends, holidays, or planned breaks. This is a common misunderstanding: OEE does not penalise you for not running when you were not planning to run.
The OEE Calculation — Availability x Performance x Quality
The OEE calculation is the product of three factors, each expressed as a percentage. Multiplying them together gives the composite OEE score. Each factor measures a different category of loss, and each has its own world-class benchmark target.
World-Class OEE Benchmarks — What the Numbers Mean
The 85% world-class OEE benchmark — established by JIPM and widely adopted across automotive, electronics, and discrete manufacturing — is not an absolute target for every plant. Process industries, high-mix low-volume operations, and older equipment will have different realistic targets. What matters is not hitting 85% — it is understanding your gap and improving systematically.
| OEE Score | Classification | What It Means | Typical Industry |
|---|---|---|---|
| 100% | Perfect | Only good parts, at ideal speed, no downtime — theoretical maximum, not a practical target | — |
| 85% + | World-Class | Excellent — sustained by structured TPM, autonomous maintenance, and continuous improvement | Automotive OEM, high-volume electronics |
| 70-84% | Good | Above average — significant improvement opportunity exists, particularly in one or two loss categories | Aerospace, medical devices, industrial equipment |
| 50-69% | Average | Typical for most discrete manufacturing — substantial losses across all three categories | General manufacturing, packaging, food & beverage |
| < 50% | Low | Significant opportunity — often points to unreliable equipment, frequent changeovers, or chronic quality issues | Job shops, maintenance-intensive operations |
These benchmarks are general guidelines. The right OEE target for a specific plant depends on the industry, equipment age, product mix, and customer requirements. A high-mix plant running 200 changeovers per month with 45-minute average OEE will never hit 85% — but it can track improvement against its own baseline. The power of OEE is not the absolute number; it is the trend and the loss breakdown that tells you where to focus.
The Six Big Losses — Every OEE Reduction Comes From One of These
The Six Big Losses are the categories of production loss that OEE was designed to measure. Every loss maps to exactly one of the three OEE factors. If you understand which loss categories are affecting your line, you know which OEE factor to target and what type of countermeasure to apply.
Stop Calculating OEE in Spreadsheets — iFactory Captures Every Loss Automatically
iFactory connects to your machines via PLC, OPC-UA, or manual entry to calculate OEE in real time. See Availability, Performance, and Quality on every shift. Drill into the Six Big Losses to find where improvement effort pays back fastest. OEE dashboards update every cycle — no manual data collection required.
How to Improve OEE — A Systematic Approach by Loss Category
Improving OEE does not require a plant-wide transformation. It requires knowing which of the three OEE factors is your weakest and applying the right countermeasure. The table below maps each OEE factor to its loss categories, typical root causes, and the highest-impact improvement actions.
| OEE Factor | Big Loss | Typical Root Causes | Highest-Impact Actions |
|---|---|---|---|
| Availability | Breakdowns | No preventive maintenance schedule, worn components, operator not trained to detect early signs of failure | Implement TPM autonomous maintenance; establish MTBF/MTTR tracking; create PM schedules by criticality |
| Availability | Changeovers | Internal setup steps that could be external, unorganised tooling, no standardised procedure | Apply SMED; create setup standards with video reference; pre-stage tools and materials before line stop |
| Performance | Minor Stops | Sensor jams, feed issues, lack of operator response time, no root cause analysis on recurring stops | Log every minor stop with cause; apply 5-Why to top three recurring stop types; install sensors with auto-clear |
| Performance | Slow Running | Machine not restored to original condition, speed reduced to avoid defects, wrong cycle time assumptions | Verify ideal cycle time against OEE data; restore machine to OEM condition; measure actual vs. ideal speed by product |
| Quality | Process Defects | No SPC on critical parameters, process drift not detected early, root cause not driven to corrective action | Implement SPC with control limits; create defect Pareto by operation; apply structured problem-solving (A3, 8D) |
| Quality | Startup Losses | No standardised startup procedure, warm-up not validated, first-piece inspection not completed to spec | Create startup checklists; reduce variability in warm-up through SPC; establish first-piece pass rate target |
A practical approach for most plants: start by identifying which of the three OEE factors is lowest. If Availability is the weakest, focus on breakdowns and changeovers. If Performance is lowest, target minor stops first — they are usually the largest hidden loss. If Quality is the weakest, run a Pareto on defect types and address the top three with A3 problem-solving. Improving one factor by 5-10% will typically increase overall OEE by 3-6%.
Common OEE Mistakes — and How They Create Misleading Numbers
OEE is only useful if it is calculated consistently and honestly. The most common mistakes in OEE measurement produce numbers that look better than reality — leading management to believe the operation is performing well when it is not.
Frequently Asked Questions — OEE Explained
What is a good OEE score for manufacturing?
World-class OEE is considered 85% or higher, based on the JIPM standard established through Total Productive Maintenance. However, 85% is not the right target for every plant. A good OEE score depends on your industry, equipment age, product mix, and process type. Automotive OEMs running high-volume dedicated lines typically target 80-85%. High-mix, low-volume operations may target 65-75% and consider that excellent. The most important benchmark is not a fixed number — it is your own baseline and the rate of improvement over time. A plant that improves OEE from 55% to 65% in twelve months is performing better than a plant that stays at 82% with no improvement trajectory.
How is OEE calculated with an example?
OEE is calculated as Availability x Performance x Quality. Example: A machine is scheduled to run 450 minutes per shift. It experiences 45 minutes of unplanned downtime, producing 380 parts with an ideal cycle time of 1 part per minute. Of those, 8 parts are defective. Availability = (450 - 45) / 450 = 90%. Performance = (380 x 1) / (450 - 45) = 93.8%. Quality = (380 - 8) / 380 = 97.9%. OEE = 90% x 93.8% x 97.9% = 82.6%. This tells you that despite 90% availability and 97.9% quality, the overall OEE is below world-class primarily due to performance losses (minor stops or slow running).
What is the difference between OEE, TEEP, and Overall Line Efficiency?
OEE measures equipment effectiveness against planned production time only — it excludes time when the plant is not scheduled to run. TEEP (Total Effective Equipment Performance) measures against calendar time — 24 hours a day, 7 days a week. TEEP = OEE x Utilization, where Utilization is planned production time divided by total calendar time. A plant running two shifts has lower TEEP than OEE because Utilization is low. Overall Line Efficiency (OLE) applies the same OEE concept to a manual assembly line rather than individual equipment. TEEP tells you how much of the total available time you are using; OEE tells you how well you are using the time you planned to run.
How do I get started with OEE measurement in my plant?
Start by defining the scope: one critical machine or production line, not the entire plant. Collect three data points: planned production time, actual run time (or downtime), and total parts produced with defect count. Measure the ideal cycle time from the equipment specification or from the fastest proven production run. Calculate Availability, Performance, and Quality manually for one shift. Review the results with the production team — do they match what operators and supervisors perceive as the biggest losses? Once manual measurement confirms the data collection method, select a digital OEE system that connects to your equipment (PLC, OPC-UA, or manual entry). Aim to have OEE data visible in real time within 30 days of starting the project. Digital systems like iFactory capture all three factors automatically and eliminate manual calculation errors.
Does OEE apply to manual assembly lines and non-automated processes?
Yes — but the calculation adapts. In manual lines, Availability is the percentage of planned working time that operators are actually working (unplanned breaks, waiting for materials, and line stoppages count as downtime). Performance is actual output divided by the standard output rate (standard time per unit). Quality is first-pass yield. Overall Line Efficiency (OLE) is an alternative metric designed specifically for labour-intensive manual operations — it measures Availability (time operators are present and working), Performance (output against engineered standard), and Quality (first-pass yield). Many lean operations use OLE instead of OEE for manual lines, reserving OEE for automated equipment where the machine cycle time is the governing factor.
Know Your OEE Every Shift — Not After Someone Crunches the Numbers in a Spreadsheet
iFactory measures OEE automatically from your production data — no manual calculation, no spreadsheets, no delays. See Availability, Performance, and Quality live per machine, per line, per shift. Drill into the Six Big Losses to identify exactly where to focus improvement effort. OEE dashboards, loss Pareto reports, and trend analysis are available out of the box. Deploy in weeks, not months.


.png)