Right now, on your shop floor, machines are running below rated speed, micro-stoppages are compounding into hours of lost output, and quality deviations are forming before any alarm goes off. You won't see it in this morning's report — because by the time that report lands, the shift is already over and the losses are already locked in. A production monitoring system changes that entirely. It gives manufacturers real-time visibility into every line, every machine, and every output metric — so problems are caught in seconds, not discovered in spreadsheets the next day. This guide explains what production monitoring systems are, what they track, and why the 84% of manufacturers who still lack real-time shop-floor visibility are losing production capacity they'll never recover.
What Is a Production Monitoring System?
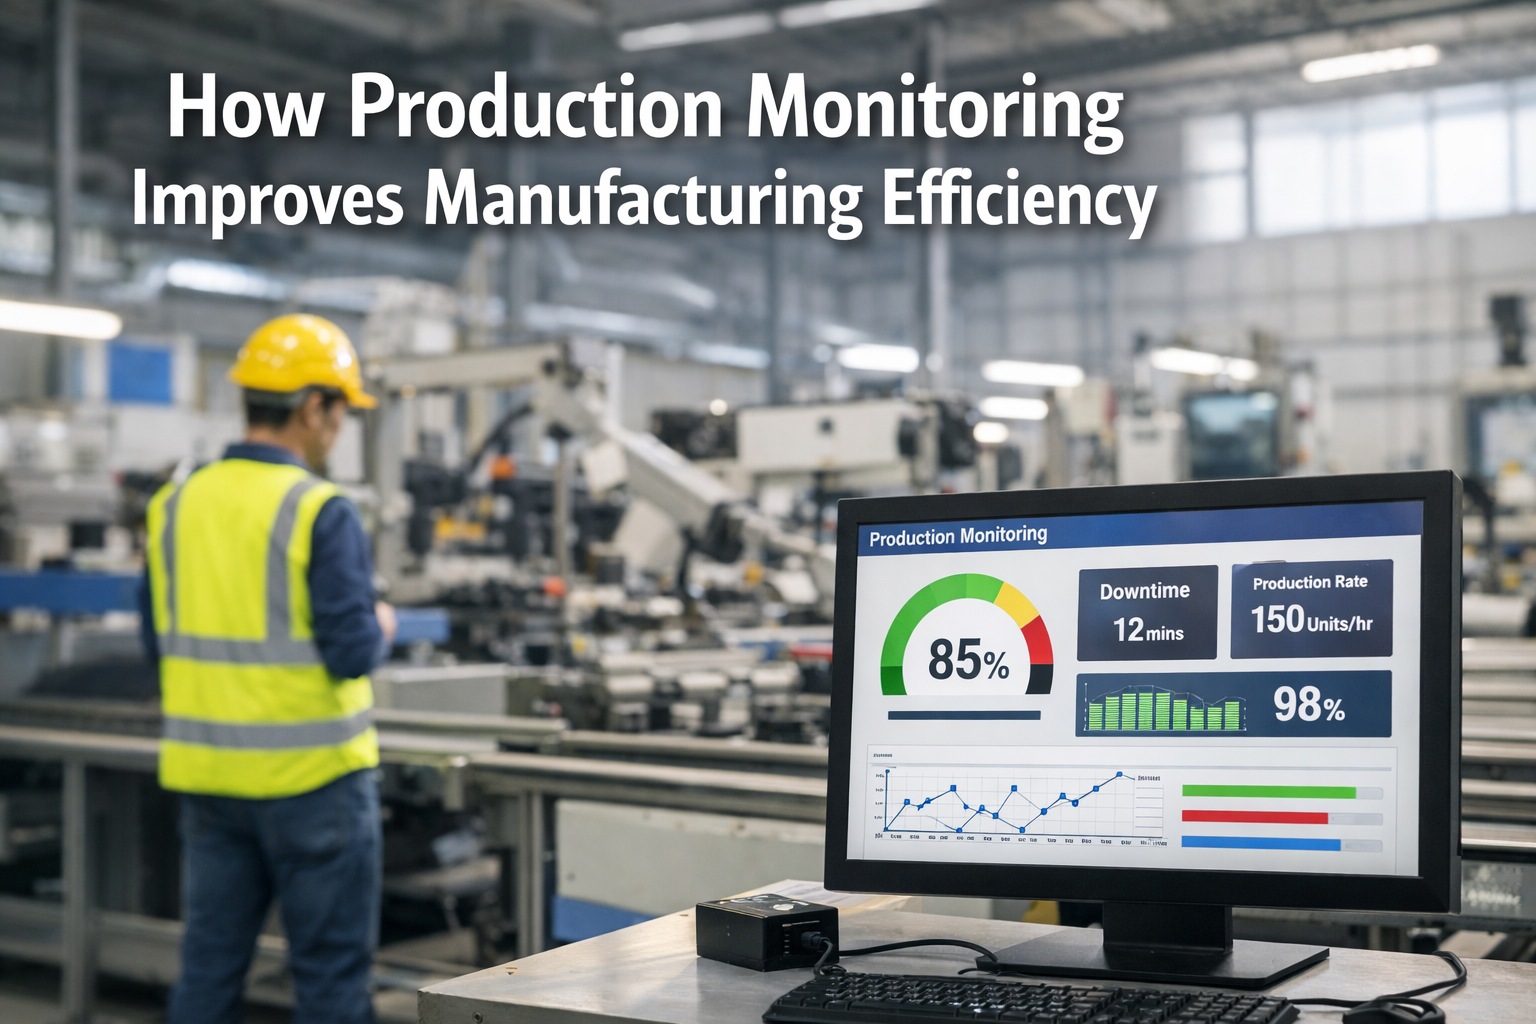
A production monitoring system is a technology platform that collects, processes, and displays real-time data from your manufacturing equipment and production lines — giving operations teams instant visibility into output rates, machine status, quality metrics, downtime events, and OEE (Overall Equipment Effectiveness). Unlike MES or ERP systems that manage production plans and schedules, a production monitoring system focuses on what's actually happening on the shop floor right now — and surfaces deviations before they become losses.
"A production monitoring system is the difference between managing your factory from last night's report and managing it from what's happening right now. One lets you explain losses. The other lets you prevent them."
The global production monitoring market reached $6.47 billion in 2025 and is on track to hit $9.95 billion by 2030 — driven by manufacturers who've discovered that real-time visibility pays for itself in recovered throughput within the first quarter of deployment. See iFactory's real-time production dashboards in a free 30-minute demo — no pitch, just live data →
What a Production Monitoring System Actually Tracks
The best systems don't just count parts — they capture every layer of production performance and connect the data to show you cause and effect. Here's what a modern production monitoring platform monitors across your shop floor:
Machine Availability
Actual runtime vs. scheduled production time. Every planned and unplanned stop is captured with timestamp, duration, and reason code — making downtime patterns visible across shifts and lines.
Performance Rate
Actual output speed vs. designed cycle time. Micro-stoppages, slow cycles, and speed reductions — even 2–3 second delays per cycle — accumulate into thousands of missed units per shift when left untracked.
Quality & First-Pass Yield
Good parts vs. total produced, defect rates by type, and scrap trends by machine and operator. Early quality drift detection prevents defect propagation through the entire batch.
OEE (Overall Equipment Effectiveness)
The composite metric combining Availability × Performance × Quality. A real-time OEE score per machine, line, and facility tells you exactly what percentage of scheduled time is producing good output.
Machine Health & Sensor Data
Vibration, temperature, current draw, pressure, and torque — streaming in real time. Anomalies trigger alerts before they become stoppages. AI correlates sensor patterns to known failure signatures.
Shift & Operator Performance
Output, cycle times, downtime entries, and quality yields broken down by shift and operator. Identifies training gaps, best-practice shifts, and scheduling patterns that consistently outperform others.
The OEE Gap: How Much Capacity Are You Actually Losing?
OEE is the single most revealing metric in manufacturing — and most teams are shocked by their actual score when they measure it properly for the first time. Here's what the numbers look like across the industry:
The hidden cost: A factory running at 62% OEE on a line with a theoretical capacity of 500 units/hour is actually producing only 310. That 190-unit-per-hour gap — running every shift, every week — represents recoverable output that never required buying a single new machine. Real-time monitoring finds and closes that gap.
5 Ways iFactory's Production Monitoring System Improves Manufacturing Performance
Production monitoring isn't just about watching numbers — it's about changing behaviour on the shop floor in real time. Here's how iFactory delivers measurable performance improvement across five dimensions: Book a demo to see all five working live on iFactory's platform →
Real-Time Downtime Detection & Escalation
AvailabilityThe moment a machine stops — planned or unplanned — iFactory captures the event with a timestamp and immediately prompts the operator for a reason code. Managers see the stoppage on their dashboard in real time, not in a shift-end report. Escalation rules automatically notify supervisors if a stop exceeds a configurable threshold. Downtime events that used to hide inside shift summaries are now visible, categorised, and fed into Pareto analysis to identify which machines and failure modes are responsible for the most production loss.
Cycle Time Monitoring & Speed Loss Recovery
PerformanceiFactory compares actual cycle time against the ideal rated speed for every production run. Even a 5% speed reduction — invisible to operators running a "working" machine — compounds into significant output gaps over a full shift. Real-time performance rate alerts notify operators the moment speed drops below threshold, allowing on-the-spot correction before the gap becomes a missed order. Over time, cycle time data by product, operator, and tooling state reveals exactly which variables consistently slow production below its rated potential.
Inline Quality Monitoring & Defect Prevention
QualityiFactory monitors process parameters — temperature setpoints, pressure ranges, torque values, dimensional outputs — against acceptable control limits in real time. When a parameter drifts outside spec, an alert fires before the machine produces a full batch of defective parts. AI vision inspection can be integrated at key quality gates to inspect 100% of parts at line speed. Defect data is linked back to the specific machine state, operator, raw material batch, and tooling condition — turning quality events into root-cause intelligence rather than just rejection counts.
Predictive Maintenance Integration
Asset HealthProduction monitoring and predictive maintenance become one system in iFactory. Sensor data streaming through the production monitoring layer — vibration, current draw, thermal patterns — is simultaneously analysed by AI for early failure signatures. When anomaly patterns match known degradation profiles, iFactory auto-generates a maintenance work order before the machine trips a production alarm. Automotive manufacturers using predictive analytics have reduced unplanned breakdowns by up to 70% — recovering an average of $100M in equipment lifetime value per fleet.
Shift & Cross-Site Performance Benchmarking
Continuous ImprovementiFactory makes performance differences between shifts, lines, and facilities visible and quantifiable. When shift A consistently outperforms shift B on the same machine, the gap is visible in real time and the contributing factors — changeover times, downtime reason distribution, cycle time consistency — are available for analysis. Multi-site manufacturers use iFactory to identify which facilities are closest to world-class OEE and replicate their best practices across the portfolio, turning top-performer knowledge into organisation-wide standard operating procedure.
See Your Factory's Real OEE — Live, In 30 Minutes
iFactory will connect to your production data and show you live availability, performance, and quality metrics on a single dashboard — then calculate exactly how much throughput you're leaving on the table each shift. No obligation. Real numbers from your facility.
How iFactory Connects to Your Existing Equipment
A production monitoring system is only as good as the data it receives. iFactory uses a layered connectivity architecture that works with your existing machines — no controller replacement, no production interruptions. Confirm your machine compatibility in a free demo call — our engineers will assess your setup before the conversation ends →
Production Monitoring KPIs: What to Track on Your Dashboard
Effective production monitoring isn't about tracking everything — it's about tracking the right metrics that drive action. These are the six KPIs iFactory displays on every production dashboard, updated in real time from shop-floor data:
Overall Equipment Effectiveness
Availability × Performance × Quality. The single number that tells you what fraction of scheduled time produced good parts at full speed.
Total Effective Equipment Performance
OEE applied against total calendar time — not just scheduled time. Reveals hidden capacity in underutilised shift windows.
First-Pass Yield
Good units produced without rework or scrap as a percentage of total output. The cleanest indicator of process stability and quality consistency.
Mean Time Between Failures
How long machines run between stoppages. Rising MTBF confirms that predictive maintenance is extending production run lengths.
Throughput Rate
Units produced per hour vs. rated capacity. Real-time throughput tracking exposes speed losses before they accumulate into missed order quantities.
Cost Per Unit
Total production cost divided by good output. The ultimate financial metric — rising CPU signals inefficiency before it shows up in P&L reports.