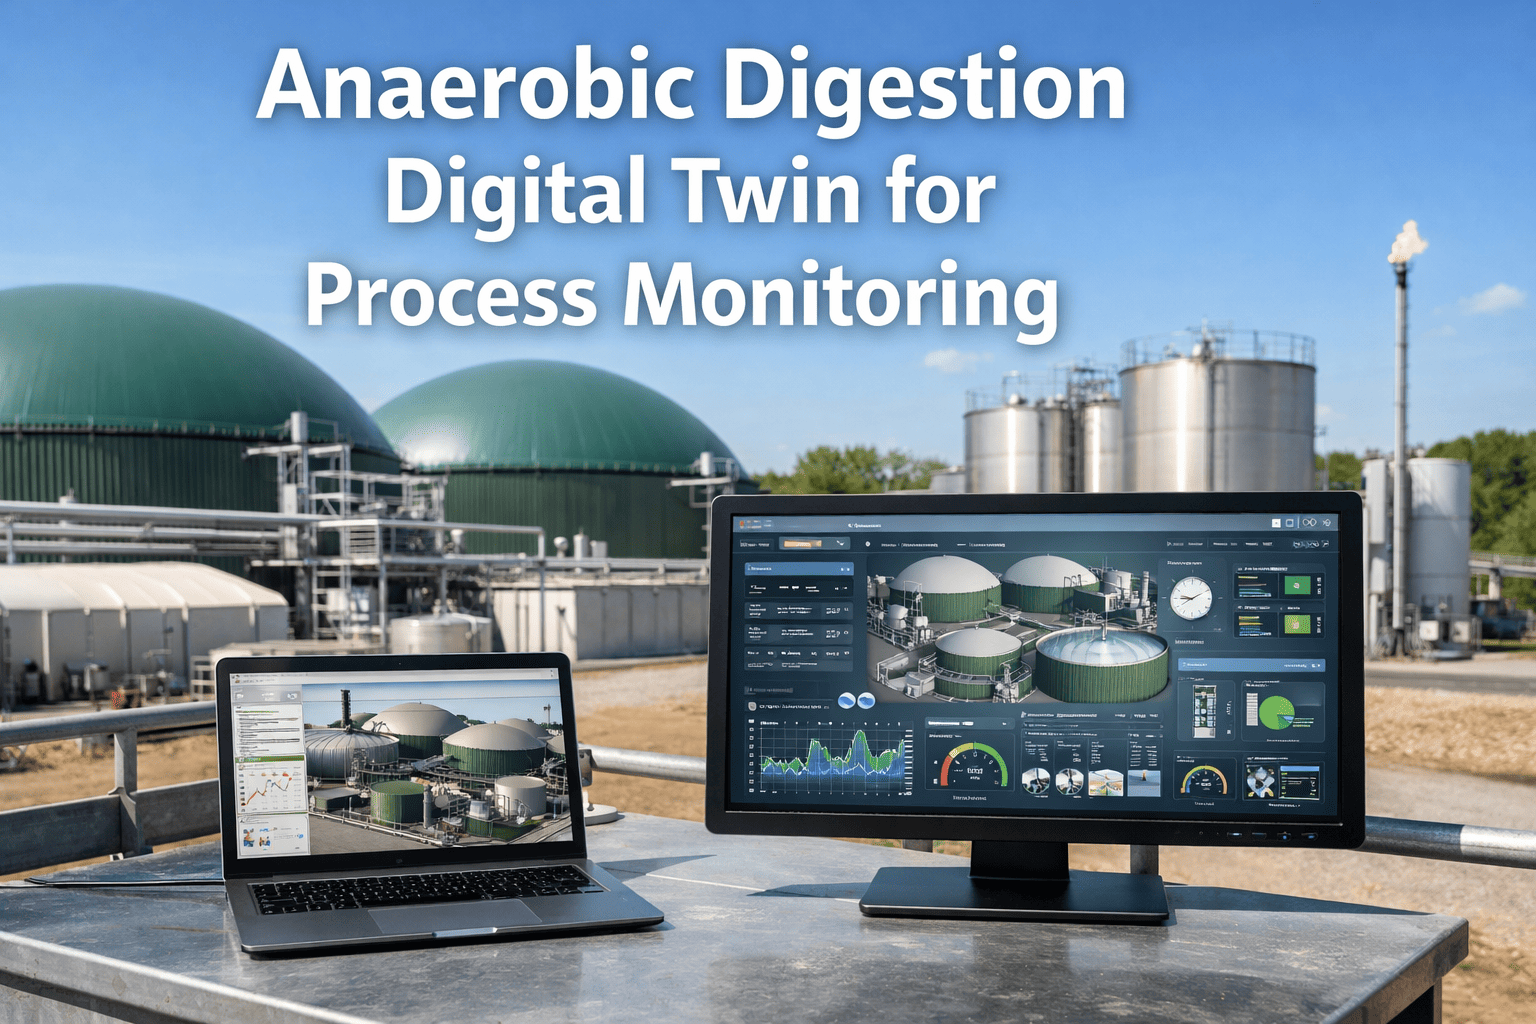
A digital twin of your anaerobic digestion process creates a real-time virtual replica that mirrors every biological, chemical, and mechanical aspect of your digester operation — from microbial population dynamics and VFA metabolism to heat exchanger performance and gas composition trends. While operators see current pH and temperature readings in SCADA, the digital twin reveals the underlying biological trajectory: methanogen stress developing 5 days before pH drops, substrate overload building 48 hours before VFA spikes, or heat exchanger fouling reducing thermal efficiency 12% before temperature deviation becomes visible. Most biogas plants monitor individual parameters in isolation without understanding how they interact systemically or how current conditions will evolve into future performance. iFactory's anaerobic digestion digital twin integrates all process data — sensors, lab measurements, substrate inputs, environmental conditions — into a unified biological model that predicts process behavior 3–7 days ahead, identifies root causes of performance deviations, and simulates intervention outcomes before implementation. Book a demo to see your digester's digital twin in action.
Core Concept
A digital twin is a live computational model of your anaerobic digestion process that continuously synchronizes with real-world sensor data, learns from operational history, and forecasts biological behavior based on current trajectory. Unlike static dashboards that show what's happening now, the digital twin predicts what will happen in 3–7 days, explains why performance is deviating from optimal, and tests "what-if" scenarios to evaluate intervention strategies before executing them in the physical digester.
Digital Twin Architecture — Five Integrated Layers
The digital twin combines five computational layers that work together to create a complete virtual representation of anaerobic digestion biology, chemistry, and mechanical systems.
Real-time sensor streams (pH, temperature, flow, pressure, gas composition, VFA online analyzers) ingested every 60 seconds. Lab measurements (alkalinity, ammonia, trace elements, BMP tests) integrated on weekly/monthly schedules. Substrate feeding logs, dosing records, and operational events captured from SCADA or manual entry. All data validated, outliers flagged, missing values interpolated using physics-based constraints.
12 real-time sensors
8 lab parameters
Substrate composition logs
Operational event history
Mechanistic anaerobic digestion model (ADM1-based) simulates four-stage biological pathway: hydrolysis → acidogenesis → acetogenesis → methanogenesis. Microbial population dynamics, substrate degradation kinetics, VFA production/consumption rates, pH buffering chemistry, and inhibition effects (ammonia, sulfide, oxygen) calculated every model timestep. Model parameters continuously calibrated against measured gas yield, VFA levels, and pH to match plant-specific biology.
Example output: Acetoclastic methanogen population currently 65% of maximum due to nickel limitation. VFA production rate 180 kg/day exceeds consumption rate 165 kg/day — accumulation trajectory predicts 2,800 mg/L in 4 days.
Heat exchanger thermal efficiency, mixing system power consumption, pump flow characteristics, gas handling equipment performance modeled alongside biology. Heat transfer coefficient calculated from supply/return temperatures and flow rates. Mechanical degradation tracked (bearing wear, impeller fouling, valve leakage). Equipment failures predicted from vibration signatures, temperature anomalies, and energy consumption trends.
Heat Exchanger U-value: 1,420 W/m²K (baseline 2,100) — 32% fouling
Mixer Power: 18.4 kW (baseline 14.2 kW) — impeller resistance increasing
Machine learning models trained on 12–24 months operational history learn correlations between process conditions and future outcomes. Gradient boosting classifiers predict process upset probability (VFA accumulation, pH crash, foam events). LSTM neural networks forecast gas yield 3–7 days ahead based on current biological trajectory. Anomaly detection algorithms identify deviations from normal operating patterns before they impact performance.
78% probability VFA >3,000 mg/L within 5 days (current trajectory)
42% probability pH <7.2 within 7 days if no intervention
"What-if" analysis tests intervention strategies before implementation. Operators simulate OLR reduction, alkalinity dosing, trace element addition, substrate mix changes, or temperature adjustments — digital twin predicts biological response, time to stabilization, and expected yield impact. Optimization algorithms recommend intervention sequence that maximizes gas production while minimizing cost and maintaining stability constraints.
Scenario tested: Reduce OLR from 3.8 to 3.2 kg VS/m³/d + add 10 kg/day NaHCO3 for 5 days. Predicted outcome: VFA declines to 2,200 mg/L by day 6, pH stabilizes at 7.5, gas yield recovers 14% by day 8. Cost: $1,400. ROI: 8.2x.
Digital Twin Capabilities — What You Can Do
The digital twin transforms from passive monitoring to active decision support across six operational use cases.
3–7 Day Process Forecasting
Predict VFA concentration, pH trajectory, gas yield, and biological stability 3–7 days ahead based on current conditions and planned substrate feeding schedule. Forecast accuracy: 85–92% for VFA, 88–94% for gas yield, 91–96% for pH. Early warning enables proactive intervention before process upset develops.
Root Cause Analysis
When gas yield drops or VFA accumulates, digital twin identifies contributing factors from 20+ potential causes: substrate composition change, trace element deficiency, temperature deviation, inhibitor accumulation, mixing inefficiency, or biological population shift. Root cause ranked by impact severity with supporting evidence from sensor/lab data.
Intervention Outcome Simulation
Test proposed interventions virtually before executing in real digester. Simulate alkalinity dosing strategies (NaHCO3 vs Ca(OH)2), OLR adjustment scenarios, substrate mix changes, or trace element supplementation. Digital twin predicts biological response timeline, stabilization duration, yield impact, and intervention cost-effectiveness.
Optimal Operating Envelope
Digital twin identifies maximum sustainable OLR, optimal substrate composition ratio, ideal HRT for current feedstock, and safe operating boundaries for pH, VFA, and temperature. Operating envelope adapts seasonally and with feedstock changes. Operators receive alerts when approaching stability limits.
New Substrate Commissioning
When introducing new feedstock (e.g., switching from cattle slurry to food waste), digital twin simulates acclimation schedule: gradual percentage increase, expected VFA response, microbial adaptation timeline, and biological stress indicators to monitor. Reduces commissioning time 40–60% vs trial-and-error approach.
Equipment Degradation Tracking
Heat exchanger fouling, mixer impeller wear, pump efficiency decline, and valve leakage detected from equipment performance model. Digital twin calculates remaining service life, optimal maintenance timing, and performance impact of degradation. Maintenance scheduled proactively based on predicted failure timeline.
Digital Twin vs Traditional Monitoring
Traditional SCADA shows current pH, temperature, and VFA readings. Digital twin explains why pH is 7.3 instead of 7.5 (trace element deficiency reducing methanogen activity), predicts pH will drop to 7.1 in 5 days if current VFA accumulation continues, and simulates three intervention options with predicted outcomes and costs. It's the difference between a rearview mirror and a GPS navigation system.
How iFactory Builds Your Digital Twin
Digital twin deployment follows a four-phase process over 8–14 weeks from data integration to full predictive operation.
Data Integration & Baseline Establishment
Connect to SCADA sensors, lab information systems, substrate feeding logs, and operational databases. Ingest 60–90 days historical data to establish baseline performance ranges. Identify data quality issues (sensor drift, missing values, outliers). Configure data validation rules and interpolation methods.
✓ Real-time sensor integration (12–20 parameters)
✓ Historical data ingestion (60–90 days)
✓ Baseline performance profile established
Model Calibration & Validation
Configure ADM1 biological process model with plant-specific parameters (digester volume, HRT, temperature regime, substrate characteristics). Calibrate model against measured gas yield, VFA trajectories, and pH dynamics. Train machine learning models on historical upset events, yield variations, and intervention outcomes. Validate prediction accuracy against holdout data.
✓ Biological model calibrated (±8% gas yield accuracy)
✓ ML models trained (85–92% forecast accuracy)
✓ Equipment performance baselines established
Predictive Feature Development
Deploy 3–7 day forecasting models for VFA, pH, and gas yield. Implement root cause analysis algorithms. Configure scenario simulation engine for intervention testing. Build optimal operating envelope calculator. Enable equipment degradation tracking. Operator dashboard and alert configuration customized to plant priorities.
✓ Forecasting models operational
✓ Scenario simulation enabled
✓ Operator interface deployed
Optimization & Continuous Learning
Monitor digital twin prediction accuracy in live operation. Refine model parameters based on prediction errors. Expand scenario library based on operator requests. Train operations team on digital twin interpretation and decision-making workflows. Enable continuous model learning from new operational data.
✓ Prediction accuracy optimized (>90% target)
✓ Operations team trained
✓ Continuous learning enabled
Digital Twin Performance Validation
Measured outcomes across 45 biogas plants operating with digital twin decision support over 18-month validation period.
88%
VFA Forecast Accuracy (±200 mg/L) at 5-Day Horizon
91%
Gas Yield Forecast Accuracy (±5%) at 7-Day Horizon
73%
Process Upset Events Prevented Through Early Intervention
4.8 days
Average Early Warning Before Biological Instability
82%
Intervention Outcome Prediction Accuracy (Simulated vs Actual)
16%
Average Gas Yield Improvement vs Pre-Digital-Twin Baseline
Digital Twin Use Case Example — VFA Accumulation Prevention
Real operational scenario showing how digital twin forecast prevented process upset through early intervention.
Day 0
Initial Condition
VFA: 1,900 mg/L (stable), pH: 7.6, gas yield: 285 m³/tonne VS. Digital twin biological model shows methanogen consumption rate 165 kg VFA/day matching acidogen production rate 168 kg/day — steady state equilibrium.
Day 1
Substrate Change Detected
Substrate composition shifted to higher food waste percentage (increased from 40% to 55% of total VS). Digital twin substrate model calculates increased easily-degradable carbohydrate fraction — predicts VFA production rate will increase to 195 kg/day while methanogen consumption capacity remains 165 kg/day. Net accumulation: +30 kg/day.
Day 2
5-Day Forecast Alert
VFA currently 2,050 mg/L (+150 mg/L from Day 0). Digital twin forecast: VFA will reach 3,200 mg/L by Day 7 if current substrate composition continues. Predicted pH decline to 7.2 by Day 8. Upset probability: 68%. Alert severity: HIGH — intervention recommended within 24 hours.
Day 3
Scenario Simulation & Decision
Operations team tests three intervention scenarios in digital twin: (A) Reduce OLR 15% for 7 days, (B) Add 12 kg/day NaHCO3 for 5 days, (C) Combine OLR reduction 10% + NaHCO3 8 kg/day. Digital twin predicts Option C delivers fastest stabilization (VFA <2,400 mg/L by Day 8) with lowest cost ($840 vs $1,200 for Option B alone). Option C implemented.
Day 8
Outcome Validation
VFA measured: 2,320 mg/L (digital twin predicted 2,380 mg/L — 2.5% error). pH: 7.5 (stable). Gas yield: 278 m³/tonne VS (temporary 2.5% reduction during intervention). Biological stability restored. Process upset prevented. Intervention cost: $840. Value of avoided upset: estimated $12,000 (prevented 3-week recovery period with 30% yield loss).
iFactory's digital twin transforms your anaerobic digestion operation from reactive troubleshooting to predictive optimization. Forecast biological behavior 3–7 days ahead, test intervention strategies virtually before implementation, and optimize performance continuously as feedstock and conditions change.
88%
VFA Forecast Accuracy
From the Field
"Before the digital twin, we managed our digester by looking at yesterday's VFA lab result and today's pH reading — always reacting after biology already shifted. Now we see a 5-day forecast: 'VFA will hit 3,000 mg/L on Thursday if you keep feeding this substrate mix.' We run simulations Tuesday morning, test three different intervention strategies virtually, pick the one with best cost-effectiveness, and execute Wednesday. By Thursday, VFA peaks at 2,600 mg/L instead of 3,000+, pH stays stable, and we avoid the upset entirely. It's like having a weather forecast for your digester biology — you can see the storm coming and prepare instead of getting caught in the rain."
Operations Manager
2.4 MW Biogas Plant — Agricultural Co-Digestion — Denmark
Frequently Asked Questions
QWhat data does the digital twin require to operate?
Minimum: real-time pH and temperature sensors, weekly VFA and alkalinity lab measurements, substrate feeding records. Enhanced: online VFA analyzer, gas composition monitoring, additional lab parameters (ammonia, trace elements). More data improves accuracy but basic digital twin operates effectively with minimal sensor suite.
QHow accurate are the 5–7 day forecasts?
VFA forecasts: 85–92% accuracy (±200 mg/L) at 5-day horizon. Gas yield: 88–94% accuracy (±5%) at 7-day horizon. pH: 91–96% accuracy (±0.15) at 5-day horizon. Accuracy improves over time as model learns plant-specific patterns from operational history.
QCan the digital twin handle multiple digesters?
Yes. Each digester modeled independently with separate calibration. Multi-digester plants benefit from cross-digester insights (substrate allocation optimization, comparative performance benchmarking). System scales from single 500 m³ digester to 10+ digester facilities with centralized monitoring.
QWhat happens if forecast predicts process upset — does system intervene automatically?
No. Digital twin provides decision support — forecasts, root cause analysis, and simulated intervention outcomes. Operators make final decisions and implement interventions manually or via SCADA. This human-in-loop approach ensures operational safety and maintains operator expertise.
Build Your Digester's Digital Twin — Predict, Simulate, Optimize.
Transform from reactive monitoring to predictive optimization with a live computational model of your anaerobic digestion biology.