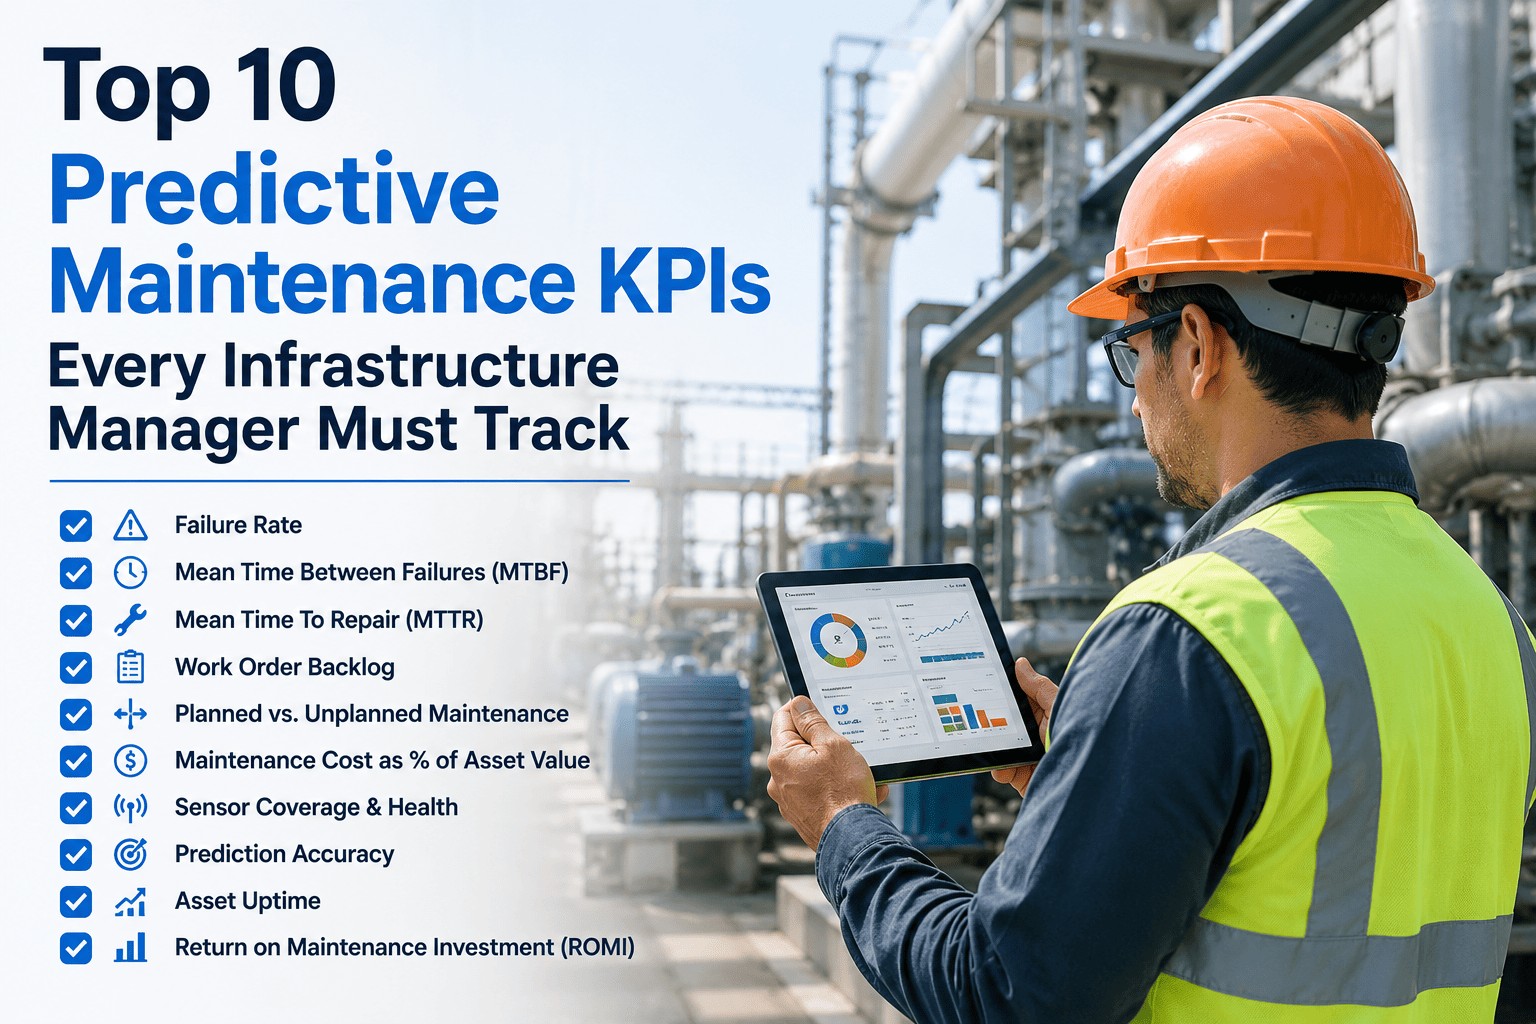
Top 10 Predictive Maintenance KPIs Every Infrastructure Manager Must Track

By Grace on May 25, 2026

top-10-predictive-maintenance-kpis-every

Most infrastructure programs track what already broke—not what's about to. These 10 predictive maintenance KPIs give infrastructure managers the forward-looking signals they need to prevent failures, justify CapEx, and prove ROI. Check each KPI your program currently tracks. Book a Demo to see how iFactory auto-calculates every metric below in real time.

Stop Reacting. Start Predicting. iFactory tracks all 10 KPIs automatically across your bridge, pipeline, and tunnel portfolio — zero manual data entry required.
35%
Reduction in maintenance OPEX with the right KPIs
20 yrs
Extra asset life achievable through AI monitoring
95%
Of PdM programs report positive ROI
18 mo
Typical full payback period on a PdM retrofit

The 10 KPIs: Your Tracking Checklist

Tick each KPI your program actively measures today. Every gap is a blind spot in your infrastructure oversight.

01 Mean Time Between Failures (MTBF) Reliability

Tracks how long assets operate before a failure event. A declining MTBF trend over 12 months is the earliest warning sign of accelerating structural fatigue. Target: trending upward Q-o-Q; any single-quarter drop of 15%+ triggers an inspection.

02 Mean Time to Repair (MTTR) Response Speed

Measures how fast your team diagnoses and resolves a structural failure. AI pre-routes diagnosed failure data to field technicians before they arrive on site, slashing MTTR. World-class target: under 4 hours for critical asset failures.

03 Asset Health Score (AHS) Structural Integrity

AI composite of vibration, corrosion, load stress, thermal, and historical repair data — scored 0–100 and updated in real time. AHS above 75 = healthy; 50–74 = monitor closely; below 50 = work order auto-triggered.

04 Remaining Useful Life (RUL) Life Extension

Physics-of-Failure AI model that projects how many years an asset has left at its current degradation rate. Prevents premature multi-million dollar replacements and unlocks emergency CapEx before failures occur — not after.

05 Predictive Failure Probability (PFP) AI Confidence

The AI's direct prediction — expressed as % likelihood of failure within 24 hours, 7 days, or 30 days. Turns AI from a black box into a labor-prioritization engine. Any asset exceeding 40% PFP in a 30-day window triggers automatic work order escalation.

06 Sensor Network Coverage Rate Data Quality

Percentage of your highest-risk structural nodes that are actively monitored. A portfolio with 60% sensor coverage has a dangerous blind spot. Target: minimum 80% on Tier 1 critical assets; 100% within 18 months of program launch.

07 Planned vs. Unplanned Maintenance Ratio Program Maturity

Single ratio that reveals your entire program's maturity at a glance. A 70% reactive program is burning emergency premiums and public safety. World-class programs achieve 90%+ planned maintenance. Industry average sits at just 55–65%.

08 AI Model Accuracy Rate AI Performance

Holds your predictive platform accountable — did predicted failures actually occur? Monitoring accuracy monthly ensures the model keeps improving. Mature models reach 85–95% accuracy. Any month below 80% triggers model recalibration.

09 Maintenance Cost per Asset Unit Financial

Reveals which structures are consuming disproportionate budget. Maintenance cost should stay below 2.5% of asset replacement value annually. Above 4% signals end-of-life candidacy — a data point that prevents over-investing in a dying asset.

10 Inspection-to-Work-Order Conversion Rate Field Efficiency

If 100 inspections produce only 8 work orders, 92 were wasted field labor. AI-routed inspection programs achieve 40–60% conversion vs. 8–15% for reactive programs. This KPI directly proves PdM ROI to leadership.

How the 10 KPIs Stack Together

These metrics form three layers of intelligence. Tracking only one layer gives you an incomplete — and potentially dangerous — picture.


Financial & Strategic Layer
Maintenance Cost per Asset Unit Remaining Useful Life Planned vs. Unplanned Ratio
Answers: Are we investing wisely?
Operational Intelligence Layer
MTBF MTTR Asset Health Score Inspection Conversion Rate
Answers: Where do we send our team today?
AI & Sensor Foundation Layer
Predictive Failure Probability Sensor Network Coverage AI Model Accuracy Rate
Answers: Can we trust the data we're acting on?

FAQs

Which KPI should infrastructure managers start with first?
Start with Asset Health Score and Sensor Network Coverage Rate together. AHS shows where your most vulnerable assets are; Coverage Rate shows how much of your portfolio is invisible. These two define the full scope of your risk exposure before you optimize anything else.
How are these different from traditional annual inspection ratings?
Traditional ratings are a snapshot taken every 12–24 months on-site. Predictive maintenance KPIs are continuous, sensor-driven, and forward-looking — they update every few seconds and tell you where an asset is headed, not just where it stands today.
Can iFactory track all 10 KPIs on assets with no existing sensors?
Yes. iFactory specializes in non-intrusive sensor retrofitting on legacy civil assets. A pilot on 5 critical assets typically takes 4–6 weeks, after which all 10 KPIs are generated in real time. Historical KPIs are reconstructed from digitized maintenance logs. Book a Demo to see the retrofit process.
How do these KPIs support safety compliance and regulatory audits?
Every KPI tracked by iFactory is timestamped, sensor-verified, and stored in an immutable audit log. RUL data, AI failure predictions, and Asset Health Scores contribute to audit-ready lifecycle documentation meeting FHWA, PHMSA, and similar regulatory standards.
Ready to Track All 10 KPIs Automatically? iFactory deploys on legacy bridges, pipelines, and tunnels in under 6 weeks — no blueprints required, no service disruption, and every KPI live from day one.

Share This Story, Choose Your Platform!