A single forced outage at a 500MW power plant can drain $2.8 million in just 14 days — lost revenue, emergency repairs, penalty fees, and replacement power costs stacking up by the hour. Across the U.S., forced outage rates have hit their highest levels since 2021. The good news? Up to 43% of these failures are preventable with the right monitoring. Here's what every plant manager needs to know in 2026.
Why Forced Outage Rates Keep Climbing
NERC's 2024 State of Reliability report confirms that conventional generation forced-outage metrics remain at historically high levels, exceeding rates for all years prior to 2021. Coal-fired plants now show a Weighted Equivalent Forced Outage Rate (WEFOR) of approximately 12% — compared to a pre-2021 average of around 10%. Meanwhile, aging infrastructure (the average U.S. coal plant is now 39 years old) and increased cycling between baseload and load-following operations are accelerating fatigue, creep, and thermal stress on critical components.
Source: NERC GADS Data, NRDC Analysis
Want to know where your plant stands compared to these benchmarks? Our specialists can run a free outage risk assessment on your facility and show you exactly which equipment needs attention first.
What Causes Forced Outages?
According to the National Energy Technology Laboratory (NETL), the root causes are concentrated in a handful of critical systems. Boiler tube failures alone account for over half of all forced outages at coal plants — driven by fatigue, corrosion, creep, and thermal stress. Every one of these failure modes produces detectable warning signs weeks before catastrophic breakdown.
Turbines, boilers, and generators together cause 77% of all mechanical forced outages. Focusing monitoring on just these three asset categories delivers the fastest ROI.
The Hidden Multiplier Effect
Direct repair costs are just the tip of the iceberg. Siemens' True Cost of Downtime 2024 report found that unscheduled downtime now costs the world's 500 largest companies $1.4 trillion annually — representing 11% of total revenues. For power generators, the cascading effects hit harder with every passing hour.
And the least visible cost? 70% of plants have little insight into when equipment is due for maintenance, upgrades, or replacement. This visibility gap directly translates into higher forced outage rates — and every outage damages capacity auction standing and long-term customer relationships.
Modern condition monitoring can provide weeks of advance warning before most mechanical failures — enough time to order parts, schedule repairs during planned outages, and avoid this entire cost cascade. See how it works for your plant.
Calculate Your Outage Risk
Find out how much forced outages are costing your facility — and how predictive monitoring can reduce that by 40% or more.
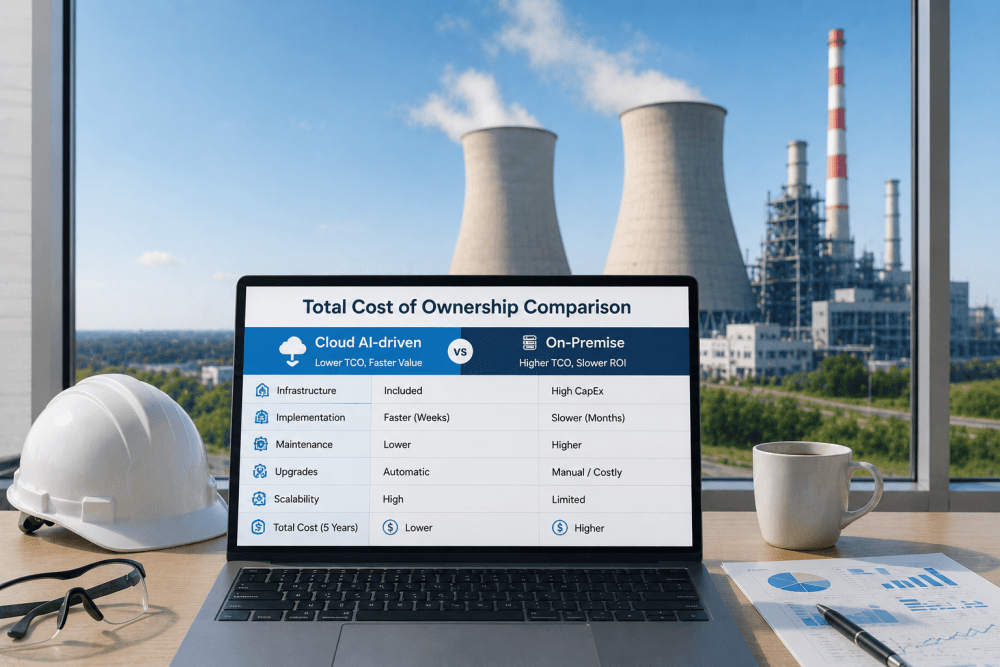
The Economics of Prevention
The financial case for predictive maintenance is no longer theoretical. Duke Energy achieved a 36% reduction in unplanned outages across its fossil fleet. A large U.S. utility deployed over 400 AI models across 67 generation units and saved $60 million annually while cutting 1.6 million tons of CO₂. The DOE reports that predictive maintenance can eliminate 70–75% of equipment breakdowns entirely.
4-Step Outage Prevention Framework
Transitioning from reactive to predictive maintenance doesn't require wholesale infrastructure replacement. Many plants begin with wireless sensors on their most critical equipment and start seeing results within weeks.
Identify Critical Assets
Rank equipment by outage impact and failure history. Turbines, boilers, and generators — responsible for 77% of outages — should top your list.
Deploy Condition Monitoring
Install IoT sensors for vibration, thermal, and electrical parameters on priority equipment. Wireless sensors establish baselines within weeks.
Integrate with CMMS
Connect sensor intelligence to maintenance workflows. Alerts automatically generate work orders, assign technicians, and schedule repairs during planned windows.
Optimize and Scale
Refine alert thresholds, expand to auxiliary systems, and measure ROI continuously. Most facilities see payback after preventing just one major outage.
Ready to see how quickly you can gain equipment visibility? Schedule your iFactory demo and move from hoping equipment holds together to knowing exactly when intervention is needed.
Stop Paying the Price of Unplanned Outages
Every forced outage drains revenue, damages reputation, and triggers regulatory scrutiny. iFactory's AI-powered CMMS detects failures weeks in advance — turning emergency shutdowns into scheduled maintenance.