A Francis turbine runner operating with 3mm of leading edge cavitation erosion loses 2–4% efficiency — worth $400K–$800K annually in lost generation at a 200MW hydro plant — and the erosion compounds between inspections. A Pelton bucket with fatigue cracks will not announce itself until the bucket separates. A penstock with wall thinning in an inaccessible section represents a catastrophic failure risk that a fixed inspection schedule visits once every 5 years. iFactory's hydropower analytics platform addresses all three — continuous AI monitoring of turbine performance, structural integrity tracking, and dam safety compliance management, purpose-built for the long asset cycles and high-consequence failure modes of hydroelectric generation. Book a free hydro analytics assessment.
Quick Answer
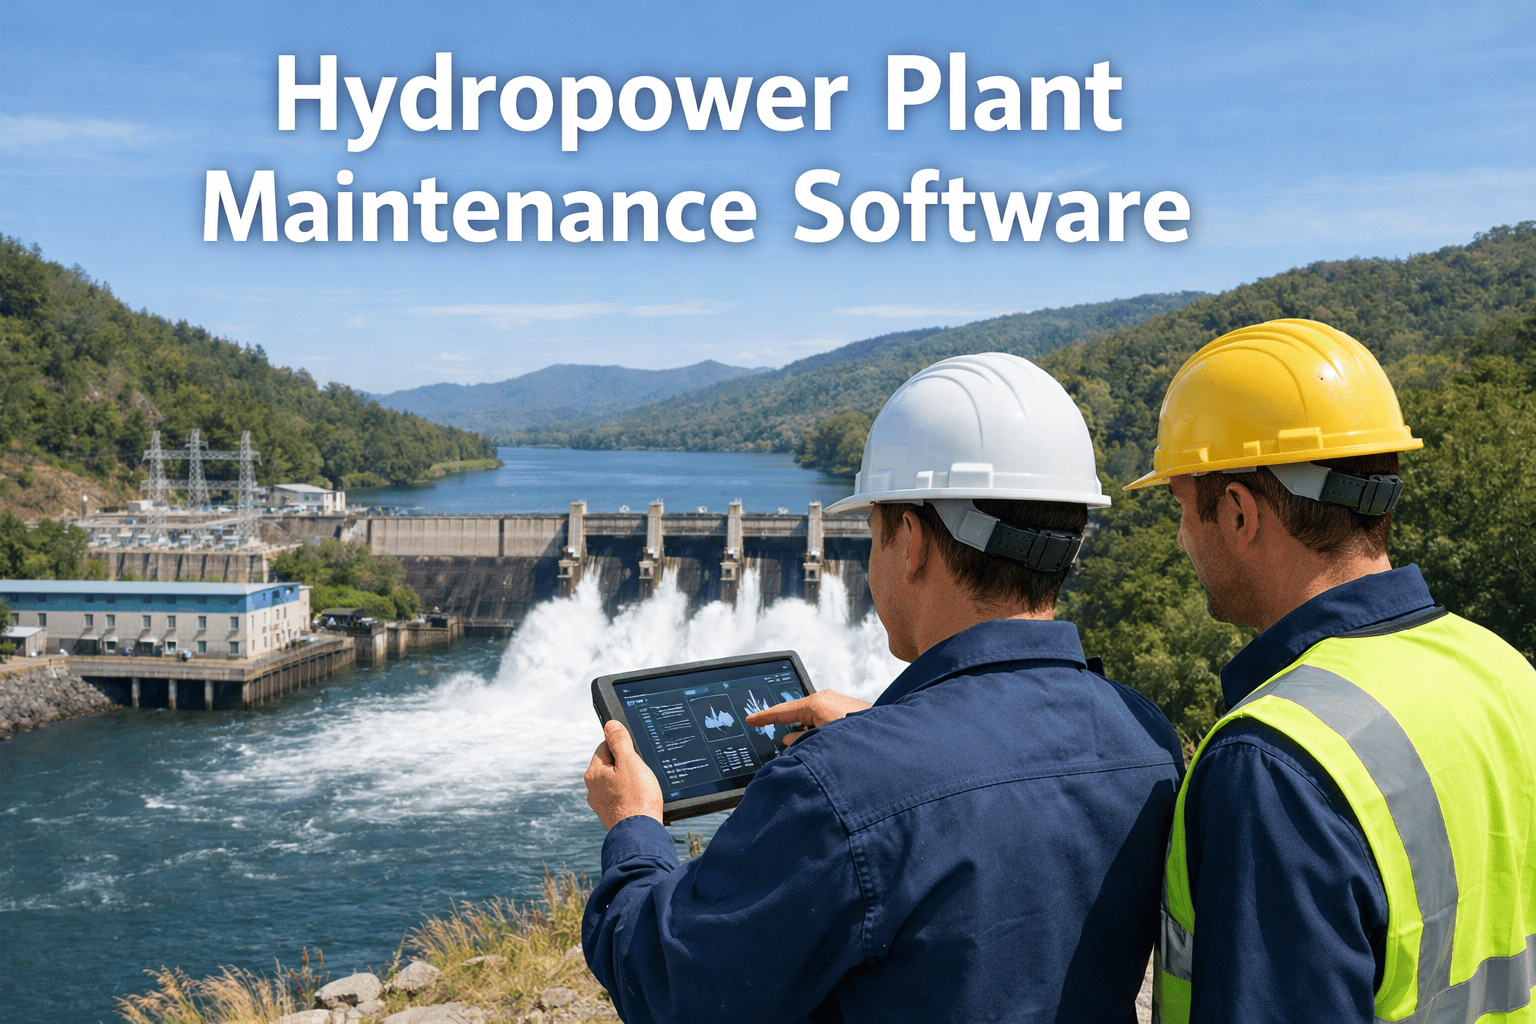
iFactory's hydropower analytics platform monitors turbine efficiency degradation, runner condition, penstock structural health, generator winding status, and dam safety parameters — combining continuous AI monitoring with long-cycle asset management and automated compliance records for FERC Part 12, ICOLD, and regional dam safety authorities.
How iFactory Solves the Core Challenges of Hydropower Plant Operations
Hydropower asset failure modes are distinct from thermal generation — cavitation erosion, runner fatigue, penstock corrosion, and gate seal degradation all operate on longer cycles with higher consequences. iFactory's hydro platform is calibrated for these failure modes and their regulatory frameworks. Book a demo to see hydro analytics applied to your plant.
Turbine Efficiency & Cavitation Monitoring
2–4%Efficiency Recovery
iFactory tracks hydraulic efficiency against head and flow-corrected design curves continuously — detecting cavitation onset from acoustic emission signatures before runner erosion compounds. Hill curve benchmarking identifies optimal operating zones and triggers tuning recommendations when efficiency deviates.
$400K–$800K annual efficiency loss recovered per unit
Runner & Blade Structural Health Tracking
6 wksFatigue Warning
Shaft vibration, bearing load, and acoustic emission monitoring track runner fatigue accumulation — integrating historical start/stop cycles, load rejection events, and hydraulic transient stress to project structural remaining life. Inspections triggered by condition, not fixed intervals, with RUL calculated per runner and per Pelton bucket.
Runner replacement planned — not emergency after failure
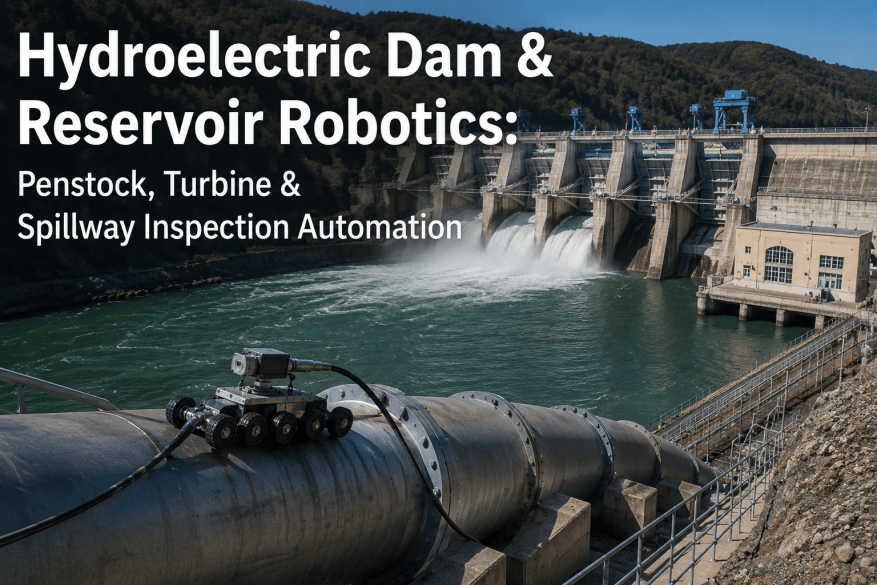
Penstock & Civil Structure Monitoring
Real-timeStructural Integrity
Penstock strain gauges, pressure transients, and wall thickness trending monitored continuously — detecting corrosion-induced wall thinning, expansion joint degradation, and surge pressure anomalies between 5-year inspection cycles. AI identifies accelerated degradation locations for targeted inspection during the next planned dewatering window.
Targeted penstock inspection — not blanket dewatering costs
Dam Safety & FERC Compliance
AutomatedFERC Part 12 Records
Seepage flows, piezometric levels, embankment settlement, and gate leakage monitored continuously against FERC Part 12 and ICOLD guidelines. Every reading, anomaly, and engineering decision logged in an immutable record structured for Annual Dam Safety Inspection and Periodic Dam Safety Review packages.
FERC Part 12 evidence assembled automatically — no sprint
Generator & Transformer Health Monitoring
6+ wksWinding Fault Warning
Stator winding insulation resistance, thermal asymmetry, and partial discharge proxy indicators monitored continuously — with 6+ weeks advance warning on developing winding failures. Thrust and guide bearing RUL projections aligned to the next overhaul window for planned replacement rather than emergency intervention.
Generator winding failure avoided — $1.2M+ event cost
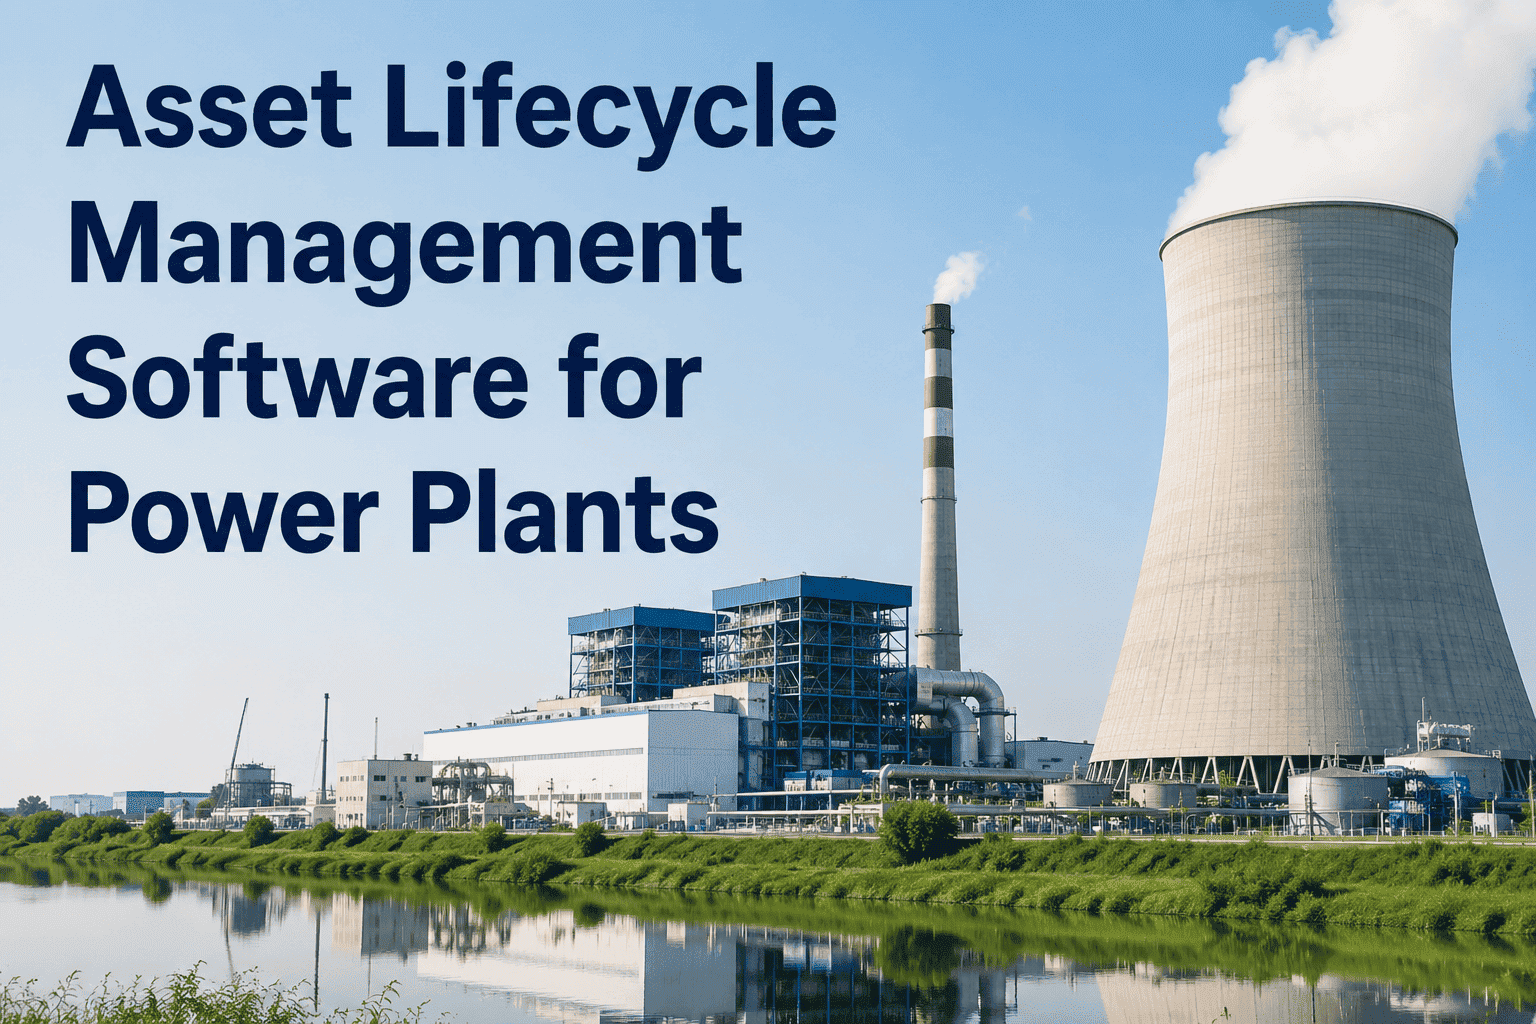
Overhaul Planning & Long-Cycle Asset Management
15–20%Asset Life Extension
Hydro overhaul intervals of 6–12 years are optimised from condition data — extending healthy units, accelerating degrading ones, and providing 12–18 months advance notice for long-lead procurement. Overhaul scope defined from AI condition data rather than the previous cycle's generic work list, reducing unnecessary expenditure by 20–30%.
Overhaul scope from condition — 20–30% unnecessary spend eliminated
Hydro Asset Failures Are High-Consequence and Long-Cycle. AI Makes Them Predictable.
iFactory connects to your existing SCADA, dam safety instrumentation, and CMMS. First turbine efficiency and bearing anomalies detected within 30 days.
Hydropower ROI — Four Value Streams
Hydro ROI differs from thermal — fewer failure events but much higher individual costs, and efficiency losses compounding silently over years.
Turbine Efficiency Recovery — $400K–$800K per Unit Annually
Cavitation erosion and operating point drift compound silently between overhaul cycles. Continuous hill curve benchmarking identifies efficiency losses in real time, recovering 2–4% efficiency worth $400K–$800K per year per 200MW unit.
Payback from efficiency recovery alone: typically <12 months
Overhaul Scope Reduction — 20–30% Overhaul Cost Eliminated
Hydro overhauls are priced on the previous cycle's work list, not on current condition. iFactory defines overhaul scope from AI-detected degradation — eliminating 20–30% of scheduled work with no condition justification. At $2M–$8M per major overhaul, scope reduction delivers $400K–$2.4M in savings per cycle.
Overhaul scope from condition — long-lead parts procured 12–18 months early
Runner & Generator Failure Avoidance — $1.2M–$4M per Event
Runner fatigue or generator winding failure at a hydro plant costs $1.2M–$4M per event — crane access, dewatering, and long-lead parts combine beyond thermal generation costs. iFactory's 6+ week advance warning converts emergency interventions to planned overhaul inclusions.
Single prevented failure typically covers 2–3 years of platform cost
Regulatory
FERC & Dam Safety Compliance — Audit Prep in Hours, Not Weeks
FERC Part 12 periodic dam safety reviews previously required 3–4 weeks of engineering time to compile. iFactory structures every dam safety monitoring reading into FERC-compliant evidence continuously — audit packages generated in 2 hours. FERC licence violations carry fines up to $1.1M per day.
FERC evidence continuous — zero retrospective compilation required
Our Numbers
2–4%
Turbine Efficiency Recovery
20–30%
Overhaul Scope Cost Reduction
6+ wks
Runner & Winding Fault Warning
15–20%
Asset Life Extension
2 hrs
FERC Audit Package vs Weeks Manual
Real-time
Dam Safety Monitoring vs Periodic
100%
Overhaul Scope from Condition Data
6 wks
To Full Platform Go-Live
iFactory vs Competitor Hydropower Analytics Platforms
GE Vernova hydro, Andritz Digital, Voith DiCo, and ABB Ability each offer hydro-specific monitoring. None combines turbine efficiency AI, dam safety compliance automation, runner fatigue tracking, and CMMS integration in a single deployable platform. Book a demo to compare.
| Capability |
iFactory |
GE Vernova Hydro |
Andritz Digital |
Voith DiCo |
ABB Ability |
| Turbine & Mechanical |
| Hill curve efficiency AI — all OEMs | All manufacturers | GE units only | Andritz units only | Voith units only | ABB scope limited |
| Cavitation onset acoustic detection | Continuous AI | GE units only | Andritz units | Not available | Limited |
| Runner fatigue RUL with load history | All runner types | GE runners only | Andritz runners | Voith runners | Not available |
| Civil & Dam Safety |
| Penstock structural health AI | Continuous monitoring | Not available | Not available | Not available | Not available |
| FERC Part 12 / dam safety auto-records | Continuous — 2 hr audit | Not available | Not available | Not available | Not available |
| Operations & Compliance |
| Auto CMMS work order from AI finding | SAP / Maximo / native | Not available | Not available | Not available | Limited |
| Overhaul scope from condition data | AI-generated scope list | GE engineering service | Andritz service | Voith service | Not available |
| On-premise / data sovereignty | Full on-premise | Cloud primary | Cloud primary | Cloud primary | Cloud primary |
Based on publicly available product documentation as of Q1 2025. Verify current capabilities with each vendor before procurement decisions.
Regional Compliance — Hydropower Dam Safety & Generation Frameworks
| Region |
Key Frameworks |
How iFactory Solves It |
| USA & Canada | FERC Part 12, ICOLD bulletins, NERC CIP, USACE dam safety, provincial dam safety acts | FERC Part 12 seepage, piezometric, and settlement records structured for Annual Inspection and Periodic Dam Safety Review packages. All data on-premise. NERC CIP compliance by architecture. |
| UK & EU | Reservoirs Act 1975 (UK), EU Water Framework, ICOLD, IEC 62443, national dam safety regulations | UK Reservoirs Act inspection records with continuous monitoring evidence. GDPR satisfied on-premise. IEC 62443 OT security enforced. ISO 55001 asset management evidence continuous. |
| Australia | ANCOLD Guidelines, state dam safety regulations, AEMO NEM, SOCI Act 2018 | ANCOLD dam safety monitoring records structured for state regulatory reporting. SOCI obligations met by on-premise architecture. AEMO generation records maintained automatically. |
| India | CWC Dam Safety Act 2021, CPCB, CEA Technical Standards, National Dam Safety Authority | Dam Safety Act 2021 monitoring records with immutable evidence. CWC reporting automated from continuous sensor data. Full data sovereignty on-premise. |
| Norway / Scandinavia | NVE dam safety regulations, energy authority reporting, ISO 55001 | NVE dam safety monitoring evidence assembled continuously. Energy authority generation reporting automated. Norwegian data sovereignty satisfied by on-premise architecture. |
FERC Part 12 Evidence Assembled Automatically — Audit-Ready at All Times.
iFactory structures every dam safety monitoring reading into FERC-compliant evidence from the moment it is recorded. No retrospective compilation. No documentation sprint before inspection.
What Our Clients Say
"We operate four Francis units and two Pelton units across two sites — all different OEMs, all different SCADA vintages. Our previous monitoring only covered two of the six units adequately. iFactory gave us a single fleet dashboard for all six in 5 weeks. Efficiency benchmarking identified one Francis unit operating 3.1% below its head-corrected design curve — a loss of $520,000 annually building for 18 months. The cause was runner leading edge erosion our 4-year inspection interval had not yet surfaced. We scheduled a targeted inspection for the next low-water window. Our FERC Part 12 package for the last annual dam inspection took 4 hours instead of 3 weeks."
Chief of Operations
340MW Multi-Site Hydroelectric Portfolio — Pacific Northwest, USA
Frequently Asked Questions
QDoes iFactory support Pelton, Francis, and Kaplan turbine types in the same platform?
Yes. AI models are calibrated per turbine type — Francis head-efficiency curves, Pelton bucket fatigue and jet impact analysis, Kaplan blade angle and runner seal monitoring are all supported within the same fleet dashboard. Mixed-type portfolios run as a unified programme.
Book a turbine type compatibility review.
QHow does iFactory handle dam safety monitoring for embankment dams vs concrete gravity dams?
Both dam types are supported. Embankment dams: piezometric levels, seepage flow, settlement, and slope deformation monitored continuously. Concrete gravity dams: joint opening, uplift pressures, thermal expansion, and structural displacement tracked. FERC Part 12 evidence templates are configured per dam type during deployment.
QCan iFactory integrate with our existing dam safety monitoring instruments — vibrating wire piezometers, tiltmeters, and seepage weirs?
Yes. iFactory connects to vibrating wire piezometers, tiltmeters, extensometers, seepage weirs, and GNSS displacement monitors via datalogger API, Modbus, or direct data feed. Most dam safety monitoring dataloggers (Campbell Scientific, Geokon, Geosense) are supported natively. Existing instrumentation is preserved and enhanced — no replacement required.
Book an instrumentation compatibility review.
QHow does iFactory account for seasonal head variation in turbine efficiency benchmarking?
All turbine efficiency metrics are normalised against actual head, flow, and water temperature at each reading — benchmarked against the unit's own head-efficiency curve at the operating point, not against a fixed design value. Seasonal head variation is factored into every efficiency comparison, so summer low-head performance is never compared against spring flood-head performance.
Continue Reading
Monitor Every Turbine, Every Penstock, Every Dam Safety Parameter — In One Platform.
iFactory hydropower analytics connects to your existing SCADA, dam safety instruments, and CMMS. All OEMs and turbine types supported. FERC Part 12 compliant from go-live. On-premise. Live in 6 weeks.
Hill Curve Efficiency AI
Cavitation Detection
FERC Part 12 Auto-Records
Runner RUL Tracking
All Turbine Types