Most industrial facilities receive their energy bill weeks after the consumption has already happened. That bill tells you what you spent — not what you wasted, not when it happened, not which machine or shift or process drove the spike. The typical manufacturing facility wastes 20–30% of its energy through compressed air leaks, phantom loads, motors running at full capacity during idle production, and HVAC systems cycling with no load to serve. Without real-time monitoring, that waste is invisible. It keeps happening every hour of every shift, compounding silently into a cost structure that erodes competitiveness — one that even well-managed facilities often cannot see. Energy monitoring systems eliminate that invisibility. The global energy management systems market has grown to $49 billion in 2025 and is projected to reach $112 billion by 2032 — because industrial facilities that implement real-time monitoring consistently reduce energy costs by 10–30%, achieve full system payback within 6–18 months, and unlock operational benefits that extend far beyond the utility bill. This is precisely what those benefits are, how they work, and what a well-deployed system delivers across every dimension of industrial performance.
01 Real-Time Visibility Into Energy Consumption — The Foundation of Every Other Benefit
You cannot manage what you cannot measure. Every benefit of an energy monitoring system — cost reduction, sustainability compliance, equipment protection, demand charge avoidance — begins with the same foundational capability: seeing exactly what is happening with energy, at the equipment level, in real time.
Traditional utility metering gives facility managers a monthly aggregate number that arrives weeks after the consumption occurred. It provides no information about which shift, which production line, which machine, or which idle period drove the cost. Real-time energy monitoring replaces that monthly snapshot with continuous granular data — equipment-level consumption, production-correlated efficiency metrics, and immediate anomaly alerts — measured in seconds, not months.
The operational impact of this visibility is immediate. Facilities deploying real-time monitoring consistently discover energy waste that was hidden for years: compressed air systems leaking 30% of their output, HVAC units competing against each other maintaining incompatible setpoints in adjacent zones, motors running at full load during non-production periods, and equipment drawing significant phantom loads during scheduled downtime. None of these waste sources are visible from a monthly utility bill. All of them are immediately visible on a real-time monitoring dashboard.
The IEA's analysis of more than 300 energy management case studies across 40 countries found that even companies which had already invested in energy efficiency discovered significant new opportunities once real-time monitoring was implemented. The act of measurement itself accelerates improvement — because it makes the cost of inefficiency visible to everyone from facility managers to production supervisors to the executive team.
iFactory's energy monitoring platform delivers sub-second real-time visibility at machine, zone, and facility level — with production-correlated dashboards that show energy consumption per unit produced, not just total kWh consumed. This is the difference between knowing your energy cost and knowing your energy efficiency.
02 Documented Cost Reduction — 10 to 30% Off the Energy Bill
The most direct and measurable benefit of energy monitoring is cost reduction — and the documented range of 10–30% savings across industrial deployments is wide enough to encompass nearly every facility type, size, and sector.
For a facility spending $300,000 annually on energy, a conservative 15% reduction delivers $45,000 per year — compounding as energy prices rise, and compounding further as AI models accumulate facility-specific data and identify progressively deeper optimization opportunities. The Department of Energy estimates that compressed air systems alone account for 10–30% of industrial energy consumption, with approximately 30% of that energy wasted through leaks that are only detectable through continuous monitoring.
| Waste Source | % of Facility Energy Affected | Detection Method | Annual Savings Potential |
|---|---|---|---|
| Compressed Air Leaks | 10–30% of total consumption | Pressure drop monitoring + acoustic sensors | $15K–$90K for mid-size facility |
| Motor Inefficiency | 60–70% of industrial electricity | Current draw vs. load correlation | 12–18% energy reduction on motor systems |
| HVAC Conflict Zones | 15–25% of building energy | Zone temperature + setpoint monitoring | Up to 30% HVAC cost reduction |
| Phantom / Idle Loads | 5–15% of total consumption | Off-hours consumption baseline monitoring | Immediate elimination once identified |
| Peak Demand Spikes | 30–50% of commercial electricity bill | Real-time demand curve monitoring | Demand charge reduction of 15–25% |
| Variable Speed Drive Drift | Variable — affects pumps, fans, conveyors | Power factor + efficiency trending | 10–20% reduction on drive-controlled systems |
Peak demand charges deserve particular attention because they represent 30–50% of commercial and industrial electricity bills — yet most facility managers have almost no real-time visibility into the demand curve that drives them. A single unexpected equipment startup during a demand measurement window can add thousands of dollars to a monthly bill. Real-time monitoring makes the demand curve visible and manageable: automated alerts warn when consumption approaches demand-charge thresholds, and AI-driven load scheduling redistributes non-critical loads to flatten the curve before charges are incurred.
iFactory's platform includes an automated demand charge management module that monitors your facility's real-time demand curve, provides threshold alerts before expensive demand windows close, and recommends load scheduling adjustments that reduce peak demand charges without impacting production throughput.
Want a facility-specific energy cost reduction estimate? Book a 30-minute consultation with iFactory — we'll model potential savings against your current utility spend, facility size, and equipment profile.
03 Equipment Health Protection Through Energy Signature Analysis
Energy consumption is one of the most sensitive early indicators of equipment degradation — often detectable weeks before any vibration, thermal, or acoustic anomaly reaches alarm threshold. Energy monitoring is not just a cost tool; it is a precision maintenance instrument.
Every piece of industrial equipment has a characteristic energy signature under normal operating conditions: a specific current draw curve, a power factor profile, a load-versus-speed relationship. As mechanical components degrade — bearings wearing, windings deteriorating, impellers eroding — those signatures shift. A motor drawing 12–18% more energy than its baseline for the same production load is a motor with a developing fault. Without continuous monitoring, that excess energy cost is invisible on a utility bill, and the fault goes undetected until it manifests as a breakdown.
Condition-based maintenance enabled by energy monitoring typically reduces total maintenance costs by 20–40% while extending equipment life by 15–25%. Emergency repair costs — which run 2–3 times the cost of planned maintenance due to overtime rates, expedited parts sourcing, and rushed execution — decline dramatically when energy signature anomalies provide weeks of advance warning rather than seconds of failure notification.
Current draw deviation from load baseline detects rotor bar faults, eccentricity, and winding degradation 2–6 weeks before thermal symptoms appear
Power-versus-flow efficiency trending identifies impeller wear, seal degradation, and cavitation conditions before output pressure drops measurably
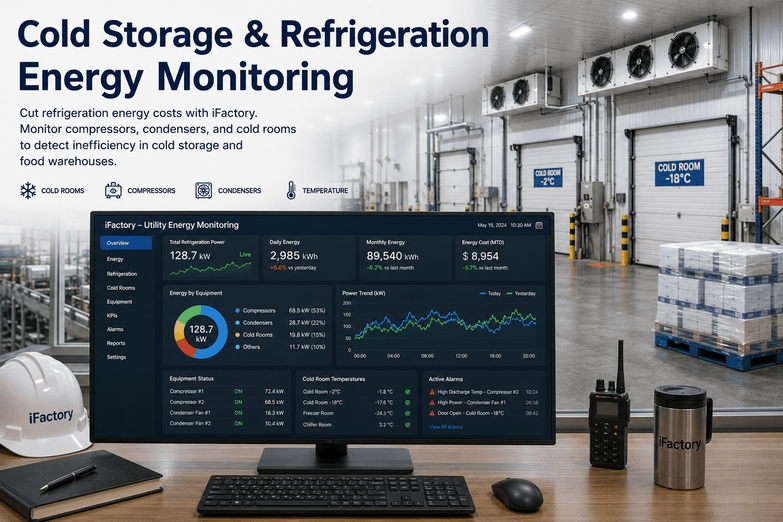
Energy-per-degree-of-cooling monitoring catches refrigerant loss, coil fouling, and compressor efficiency decay — conditions that increase energy cost 20–40% before failing
Pressure drop rate monitoring identifies developing leaks with a precision no manual audit achieves — catching waste that builds gradually between scheduled inspection rounds
Load-normalized energy monitoring detects mechanical friction increases, belt wear, and misalignment through power draw trending before mechanical symptoms are audible
Energy-per-unit-output efficiency monitoring detects refractory degradation, burner inefficiency, and heat exchanger fouling — conditions that silently inflate operating costs for months
iFactory's AI energy monitoring layer establishes a continuously-learning baseline energy signature for each monitored asset — automatically alerting maintenance teams when consumption deviates in the patterns that precede specific failure modes, and routing those alerts directly to the CMMS work order system with the asset ID, deviation magnitude, and recommended intervention priority.
04 ISO 50001 and Sustainability Compliance — Automated, Audit-Ready
Energy reporting and sustainability compliance requirements are tightening across every major industrial market. Facilities without automated monitoring face an escalating burden of manual data collection, third-party auditing costs, and regulatory exposure. Facilities with real-time monitoring generate compliance documentation automatically.
ISO 50001 — the international standard for energy management systems — has seen new certifications grow from 450 in 30 countries in 2011 to nearly 25,000 in more than 100 countries in 2023, accelerated by EU Energy Efficiency Directive mandates, carbon reduction targets, and the US Department of Energy's 50001 Ready programme. For large industrial companies in regulated markets, energy management certification is becoming a procurement and supply chain requirement, not merely a voluntary sustainability signal.
Real-time energy monitoring systems generate the continuous consumption data, trend analysis, and documented efficiency improvement records that ISO 50001 and equivalent standards require — automatically. What previously required periodic manual meter readings, spreadsheet compilation, and expensive third-party energy audits is now produced continuously by the monitoring platform and exportable in audit-ready formats on demand. The compliance cost savings alone justify a significant portion of the system investment for facilities operating under mandatory reporting frameworks.
| Compliance Requirement | Without Monitoring | With Real-Time Monitoring | Operational Impact |
|---|---|---|---|
| ISO 50001 Certification | Manual data collection, periodic audits, significant consultant cost | Continuous automated data — audit-ready reports generated on demand | Eliminates annual audit preparation burden |
| Carbon Footprint Reporting | Estimated calculations from billing data — low accuracy | Scope 1 & 2 emissions calculated from real consumption data — high accuracy | ESG reporting credibility and precision |
| EU Energy Efficiency Directive | Complex manual compliance with significant regulatory risk | Automated consumption reporting meets directive requirements continuously | Regulatory exposure eliminated |
| Customer Sustainability Requirements | Unable to provide verified facility-level consumption data | Verifiable, timestamped consumption data available for supply chain reporting | Qualifies facility for sustainability-conscious customer programs |
| Utility Demand Response Programs | Manual participation — limited ability to respond reliably | Automated load shedding during demand response events — guaranteed participation | Utility rebates and incentive payments captured automatically |
iFactory's compliance reporting module generates ISO 50001-aligned energy performance documentation continuously — including EnPI (Energy Performance Indicator) tracking, consumption baseline comparisons, and Scope 1 & 2 emissions calculations — so audit preparation is eliminated rather than compressed into a stressful quarterly event.
Operating under ISO 50001 or EU Energy Efficiency Directive requirements? Talk to iFactory about automated compliance reporting — we'll map your specific regulatory requirements to the monitoring architecture that generates the documentation you need.
05 Production Efficiency Correlation — Energy Cost Per Unit, Not Just Total kWh
Total energy consumption is a misleading metric for manufacturing facilities. A day with high production volume should consume more energy than a day with low volume. The meaningful metric is energy consumed per unit produced — and that metric is only visible when energy monitoring is correlated with production data in real time.
Production-correlated energy monitoring reveals inefficiencies that aggregate data completely obscures. Identical machines running the same product at the same line speed may have energy-per-unit profiles that differ by 15–25% — due to minor mechanical wear, lubrication conditions, tooling quality, or operator behavior — and that difference is invisible on a total-consumption dashboard but immediately apparent on a per-unit efficiency view.
Shift-level energy performance analysis is another powerful application. When energy-per-unit is tracked by shift, the performance differences between production crews become visible — enabling targeted training, process standardization, and best-practice replication across shifts. Manufacturers using production-correlated energy monitoring gain a 15–20% cost advantage over facilities still relying on aggregate consumption data, because they can quantify and address efficiency gaps that their competitors cannot even see.
Combines real-time energy consumption with production count data to produce a continuous kWh/unit metric — the true measure of manufacturing energy efficiency, comparable across machines, shifts, products, and time periods.
Identifies performance variance between shifts and crews — making efficiency gaps visible and giving operations managers the data to standardize best practices and eliminate lowest-performing patterns at the process level.
Assigns accurate energy cost to each product SKU based on measured consumption data rather than standard cost estimates — improving pricing accuracy, margin visibility, and product mix decisions in customer negotiations.
Quantifies energy consumed during changeovers, idle periods, planned downtime, and unplanned stoppages — making the hidden energy cost of production inefficiency visible and creating a direct financial case for OEE improvement.
For operations with multiple plants, normalised energy-per-unit comparisons across facilities identify the highest and lowest performers — enabling best-practice transfer and realistic efficiency improvement targets grounded in actual operational data.
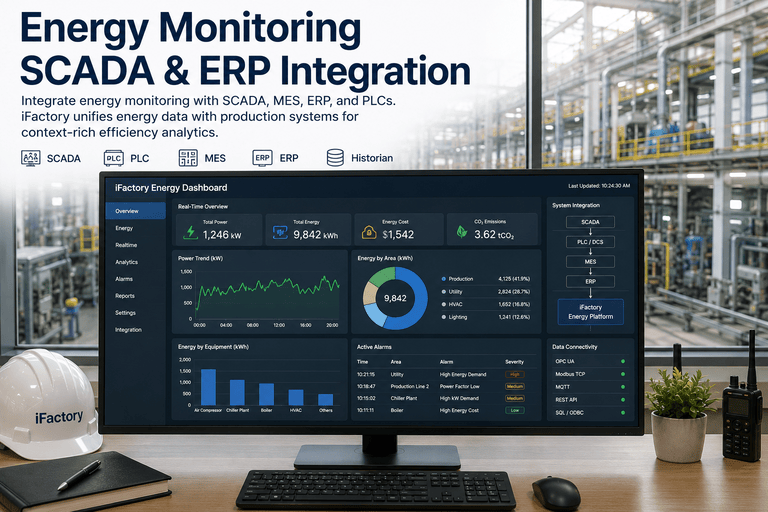
iFactory's MES and ERP integration layer connects real-time energy data to production counts, product codes, and shift records — automatically generating energy-per-unit dashboards, shift comparison reports, and product-level energy cost allocations that make operational efficiency visible at the granularity that drives real decisions.
06 Operational Control and Remote Management — The Always-On Facility Manager
Modern energy monitoring systems do not just display data — they give facility managers active operational control over energy-consuming systems from any location, on any device, with automated responses to anomalies that do not wait for a human to notice.
Remote monitoring and control capabilities allow facility managers to set energy consumption schedules, establish automated load-shedding responses to demand threshold alerts, and receive real-time notifications when consumption deviates from expected patterns — whether due to equipment faults, unauthorized after-hours operation, or process inefficiency. This operational reach transforms energy management from a periodic review activity into a continuous control function.
The commercial value of this capability is substantial. A California manufacturing facility with real-time energy monitoring identified $284,000 in annual waste — including refrigeration systems operating 40% harder than required due to a setpoint misconfiguration that had been invisible on monthly utility bills for years. The monitoring system did not find this through a scheduled audit. It found it through continuous anomaly detection that compared actual consumption against the expected baseline and flagged the deviation automatically.
Automated notifications when consumption deviates from expected patterns — delivered to mobile devices immediately, not discovered at month-end billing review
Pre-programmed equipment startup sequences that stagger high-current loads to prevent demand charge peaks — executing automatically without operator intervention
Adjust HVAC setpoints, lighting schedules, and non-critical equipment operation remotely — enabling off-hours energy reduction without requiring physical facility access
Scheduled energy performance summaries delivered to management, operations teams, and sustainability stakeholders — eliminating manual data compilation from multiple sources
Continuous comparison of current consumption against established baselines — making efficiency improvements visible as they accumulate and identifying regression when performance deteriorates
AI-driven consumption forecasting based on production schedules, weather data, and historical patterns — enabling proactive cost management and utility procurement optimization
iFactory's mobile-first energy management dashboard gives facility managers full operational visibility and control from any device — with push alerts, remote equipment control integration, and AI-driven energy recommendations that surface the highest-value actions every day rather than waiting for quarterly reviews.
Ready to see what real-time visibility reveals in your facility? Book a free 30-minute energy assessment with iFactory — we'll walk through your facility profile and estimate what continuous monitoring would uncover.
Your Facility Is Wasting Energy Right Now — And Your Utility Bill Won't Tell You Where
iFactory's energy monitoring platform delivers real-time visibility, AI-driven anomaly detection, and closed-loop action across every energy-consuming system in your facility — purpose-built for smart manufacturing.
Energy Monitoring Implementation Readiness Matrix
This matrix helps industrial facility managers understand the deployment priority, expected impact, and readiness level for each major benefit area of energy monitoring — and how iFactory addresses each one.
| Benefit Area | Deployment Priority | Typical Savings / Impact | Payback Timeline | iFactory Capability |
|---|---|---|---|---|
| Real-Time Consumption Visibility | Immediate — foundational | Reveals 20–30% hidden waste immediately | Days — waste identified within first week | Sub-second equipment-level dashboard |
| Direct Energy Cost Reduction | Immediate | 10–30% reduction on annual energy spend | 6–18 months full payback | AI waste identification + load optimization |
| Peak Demand Charge Avoidance | High — demand charges are 30–50% of bill | 15–25% reduction in demand charges | First billing cycle impact | Real-time demand curve + automated load scheduling |
| Equipment Health Protection | High — prevents costly breakdowns | 20–40% maintenance cost reduction | 1–2 prevented failures often justify full investment | Energy signature anomaly detection → CMMS integration |
| Sustainability / ISO 50001 Compliance | Strategic — growing regulatory pressure | Eliminates audit costs; reduces compliance risk | Immediate operational benefit | Automated EnPI tracking + audit-ready reporting |
| Production Energy Efficiency | Medium-term — requires MES integration | 15–20% cost advantage vs. non-monitored competitors | 6–12 months post-integration | Energy-per-unit dashboards + shift benchmarking |
| Remote Operational Control | Ongoing — continuous operational value | Prevents emergency costs; enables off-hours savings | Immediate operational benefit | Mobile-first control dashboard + automated alerts |
Want a customized energy monitoring roadmap for your facility? Schedule a free strategy session with iFactory — we'll prioritize benefits by your facility's energy profile and build a deployment sequence that maximizes first-year ROI.
Frequently Asked Questions
Every Inefficiency Your Facility Has Is Generating Data Right Now
The only question is whether you have the monitoring infrastructure to read it. Book a strategy call to see how iFactory turns your facility's energy data into documented cost savings, compliance documentation, and operational control.