Manufacturing margins sit at 5–15%. Energy prices rose 7% in 2025 and are projected to keep climbing. Yet across industrial facilities, 40% of every dollar spent on electricity is wasted — through degrading motors, leaking compressed air systems, demand spikes no one saw coming, and equipment running long after production stopped for the shift. That is $510 in waste for every $1,000 on the utility bill. The uncomfortable reality is that the bill itself cannot tell you where the waste is coming from. It shows up four weeks after the fact, as a single number, with no breakdown by machine, shift, zone, or process. Energy monitoring systems solve this by replacing that delayed aggregate number with equipment-level, real-time consumption data — making waste visible the moment it starts, and giving manufacturers the analytics to act on it before it compounds. Across 300+ documented case studies in 40 countries, the IEA found an average 11% energy cost reduction in Year 1 alone. The practical range across industrial deployments runs from 10% to 30% — and the mechanisms behind those savings are precise, repeatable, and applicable to any facility that currently has no real-time visibility into where its electricity actually goes.
01 Why Your Current Setup Cannot Reduce What It Cannot Measure
The fundamental problem with traditional energy management in manufacturing is not a lack of effort — it is a structural data gap. Monthly utility bills are the only instrument most facilities have, and they are the wrong instrument entirely for identifying waste at the source.
A monthly utility bill answers one question: how much did the facility consume in total this period? It cannot answer any of the questions that actually matter for cost reduction — which equipment ran when it should have been idle, which production line consumes 18% more energy per unit than the one beside it, which shift consistently peaks the demand charge, or which compressor has been leaking the equivalent of $3,900 per year since the last manual inspection missed it.
This is the data gap that energy monitoring systems close. Instead of a monthly aggregate delivered four weeks after the fact, real-time monitoring produces continuous, equipment-level consumption data — measured in seconds, not billing cycles. The moment a motor starts drawing above its baseline, the moment a compressed air pressure drops in a pattern that indicates a leak developing, the moment a production line's energy-per-unit ratio drifts upward — the monitoring platform detects it, quantifies it, and surfaces it as an actionable alert. That shift from reactive to proactive is what produces the 10–30% cost reduction documented across industrial deployments.
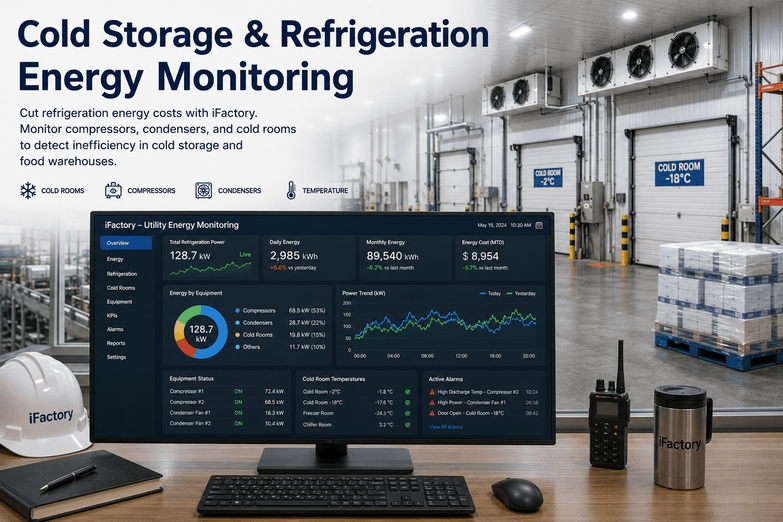
iFactory's energy monitoring platform closes this data gap with sub-second equipment-level visibility, AI-driven anomaly detection, and automated alerting — so the 40% of energy your facility is wasting right now becomes visible, attributable, and actionable within days of deployment, not months.
02 The Six Mechanisms That Actually Reduce Manufacturing Energy Costs
Energy monitoring does not reduce costs by itself. It reduces costs by making six specific types of waste visible that are invisible without real-time data — and giving operations teams the precision to eliminate each one systematically.
Understanding these six mechanisms is the difference between deploying an energy monitoring system as a compliance exercise and deploying it as a cost reduction program that compounds value quarter over quarter. Every percentage point of energy savings documented across industrial case studies traces back to one or more of these mechanisms operating in sequence.
Compressed air accounts for 10–30% of industrial facility energy consumption. Approximately 30% of that is wasted through leaks — at an average cost of $3,900 per leak per year. Continuous pressure-drop rate monitoring identifies developing leaks as they form, not during the next scheduled walkthrough. A single 100,000 sq ft facility typically recovers $35,000–$75,000 annually from compressed air optimization alone.
Demand charges represent 30–50% of commercial and industrial electricity bills — yet most facilities have no real-time visibility into the demand curve driving them. A single unplanned equipment startup during a demand measurement window adds $3,900–$47,000 to a monthly bill. Real-time monitoring makes the demand curve visible; automated load scheduling staggers equipment startups to prevent peaks before they are measured and charged.
Motors and drives account for 60–80% of industrial electricity consumption. As bearings wear and windings degrade, motors draw 12–18% more energy for the same output — waste that is invisible on a utility bill but immediately apparent as a baseline deviation in real-time current monitoring. Catching this degradation early reduces energy waste and prevents the equipment failure that costs 2–3 times more to address as an emergency than as a scheduled intervention.
Most manufacturing facilities have never measured what they consume during non-production hours. Monitoring consistently reveals that 5–15% of total consumption occurs when no production is scheduled — from HVAC systems running without any process load to justify it, idle equipment still drawing significant standby power, and lighting zones running full overnight shifts. These loads are eliminated within the first week of monitoring in virtually every deployment.
HVAC and process cooling systems account for 15–40% of facility energy consumption depending on process type. Monitoring detects competing setpoints between adjacent zones, identifies refrigerant loss through energy-per-degree-of-cooling trends, and flags HVAC systems running during unoccupied periods. Correcting these conditions delivers up to 30% reduction on HVAC energy cost — without any equipment replacement, just operational changes informed by real-time data.
When energy monitoring is correlated with production output, facilities gain visibility into energy cost per unit produced — the only metric that accounts for both consumption and productivity simultaneously. Identical machines running the same product may differ by 15–25% in energy-per-unit efficiency due to mechanical condition, operator behavior, or tooling quality. Making this visible drives targeted interventions that reduce energy cost without reducing output, delivering a 15–20% competitive cost advantage over unmonitored facilities.
iFactory's platform targets all six mechanisms simultaneously — with dedicated dashboards for compressed air monitoring, demand curve management, motor efficiency trending, off-hours baseline analysis, HVAC correlation, and production energy-per-unit tracking — so your facility's cost reduction is systematic rather than opportunistic.
Want to see which of these six mechanisms represents the largest opportunity in your facility? Book a 30-minute energy waste assessment with iFactory — we'll map your facility profile to the waste sources most likely driving your current energy bill.
03 How the Analytics Engine Turns Sensor Data Into Cost Savings
Sensors collect data. The analytics platform is what turns that data into specific, prioritized, financially quantified actions that operations and maintenance teams can execute immediately — without requiring a dedicated energy analyst to interpret raw readings.
The analytics layer in a mature energy monitoring system does four things that manual energy management cannot: it establishes dynamic baselines that account for production schedule, ambient temperature, and seasonal variation — so it knows what normal consumption should be for current conditions, not just historical averages. It correlates data streams across multiple sensors to confirm anomalies before alerting — eliminating the false positives that cause teams to stop responding to alerts. It quantifies the financial impact of each identified inefficiency in dollar terms, prioritizing the action list by savings potential rather than leaving that calculation to the engineer receiving the alert. And it tracks improvement over time, building the documented savings record that supports both internal ROI reporting and external compliance requirements.
The AI model learns your facility's normal consumption patterns for every asset under every operating condition — production schedules, temperature profiles, shift configurations. This dynamic baseline is the reference against which all anomalies are measured, eliminating false alerts driven by normal variation.
Deviations from baseline trigger cross-stream correlation — confirming anomalies against multiple sensor inputs before generating an alert. A current spike confirmed by a temperature rise and a power factor shift is a confirmed motor fault, not a measurement artifact. This multi-stream confirmation is what makes alerts actionable rather than noise.
Every identified inefficiency is automatically translated into dollar impact — the annual cost of the anomaly at current energy rates, projected against future price trajectories. Operations managers see a prioritized action list ranked by savings potential, not a raw list of sensor deviations requiring individual financial analysis to prioritize.
When the analytics engine identifies an actionable inefficiency — a compressed air leak, a degrading motor, an HVAC conflict zone — it automatically generates a work order in the CMMS with the asset ID, deviation magnitude, financial impact, and recommended intervention. The loop from sensor signal to maintenance action closes without requiring a human to manually bridge the two systems.
As interventions are completed, the platform compares post-intervention consumption against the pre-intervention baseline to document realized savings in kWh and dollar terms. This creates the audit trail that supports internal ROI reporting, ISO 50001 compliance documentation, and utility incentive program claims — automatically, without manual compilation.
iFactory's analytics engine is built on facility-specific AI models trained on your production schedules, asset profiles, and operational patterns — not generic industry benchmarks. This means the anomaly detection, financial quantification, and intervention prioritization it produces are calibrated to your facility from day one of deployment.
04 The Financial Case: What Documented Savings Actually Look Like
The financial case for energy monitoring in manufacturing is not theoretical. These outcomes come from documented deployments — and the range of savings is wide enough to include facilities of almost any size operating in almost any sector.
For a facility spending $300,000 annually on electricity — a modest figure for mid-size manufacturing — a 15% reduction delivers $45,000 per year in direct savings. At 20%, that is $60,000. These numbers compound as energy prices rise and as AI models accumulate facility-specific data and identify progressively deeper optimization opportunities. The average payback period across industrial monitoring deployments is 6–11 months, meaning most facilities recover their full investment within the same fiscal year they deploy — and every year thereafter is net benefit.
| Annual Energy Spend | Conservative (10%) | Mid-Range (15%) | Strong (20%) | Best-Case (25%) | Payback Period |
|---|---|---|---|---|---|
| $120,000/yr | $12,000/yr | $18,000/yr | $24,000/yr | $30,000/yr | 8–14 months |
| $250,000/yr | $25,000/yr | $37,500/yr | $50,000/yr | $62,500/yr | 6–11 months |
| $500,000/yr | $50,000/yr | $75,000/yr | $100,000/yr | $125,000/yr | 4–8 months |
| $1,000,000/yr | $100,000/yr | $150,000/yr | $200,000/yr | $250,000/yr | 3–6 months |
| $3,000,000/yr | $300,000/yr | $450,000/yr | $600,000/yr | $750,000/yr | 2–4 months |
These direct energy savings are compounded by the maintenance cost reductions that come from equipment health monitoring — condition-based maintenance typically reduces total maintenance costs by 20–40% while extending equipment life by 15–25%. Emergency repair costs, which run 2–3 times higher than planned maintenance, decline dramatically when energy signature anomalies provide weeks of advance warning. The full 5-year ROI for a well-deployed energy monitoring system, accounting for both energy savings and maintenance cost reduction, consistently exceeds 300–500% across documented industrial deployments.
iFactory builds facility-specific ROI models before deployment begins — projecting savings ranges against your current energy spend, equipment profile, and operational pattern so you have a financially grounded business case before committing to infrastructure investment. The demo shows this model live against your own numbers.
Ready to see what your facility's savings range looks like? Book a 30-minute iFactory demo — we'll build a live ROI projection against your current energy spend, facility size, and highest-waste equipment categories.
Every Day Without Monitoring Is a Day You Pay for Waste You Cannot See
Facilities spending $300,000 annually on energy waste $90,000 through inefficiencies that real-time monitoring identifies and eliminates. Book a demo to see exactly where your facility's $90,000 is going — and how fast iFactory recovers it.
05 Implementation: From First Sensor to First Savings
The most common reason manufacturing facilities delay energy monitoring deployment is the belief that implementation requires significant production disruption, specialized IT resources, or complete infrastructure replacement. None of these are accurate for modern IoT-based monitoring platforms.
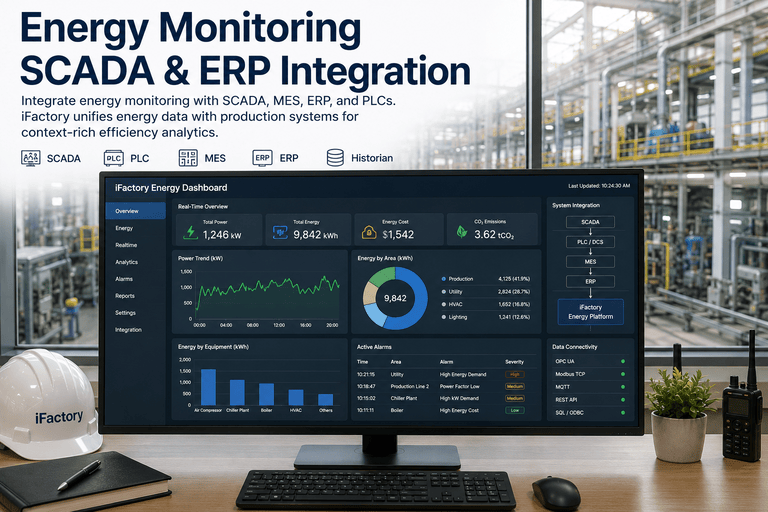
Deployment of a well-designed energy monitoring system follows a 90-day sequence that starts with the highest-waste assets first — delivering measurable savings within weeks, not at the end of a multi-month rollout. The hardware-agnostic design of modern platforms means existing smart meters, BMS sensors, and PLC data streams can be integrated without replacement, reducing deployment cost substantially compared to legacy building management system upgrades.
Identify the 20% of assets driving 80% of energy cost risk. Specify sensor types, placement positions, and connectivity protocol for each Tier 1 asset. Map integration points with existing BMS, PLC, and SCADA infrastructure. Establish pre-deployment energy baselines from available utility data.
Install sensors on priority assets — typical installation time under 30 minutes per sensor with no production interruption for wireless deployments. Commission platform data ingestion, configure equipment profiles, and begin baseline learning period. Most platforms begin generating consumption data within 24 hours of commissioning.
AI baseline models mature after 2–4 weeks of operational data. First anomaly alerts begin identifying compressed air leaks, phantom loads, HVAC inefficiencies, and demand spike patterns. Quick-win interventions — zero or near-zero capital cost — typically deliver the first documented savings within 30–45 days of commissioning.
Connect energy anomaly alerts to maintenance work order workflows. Integrate production data for energy-per-unit tracking. Expand monitoring to Tier 2 assets based on findings from Tier 1 deployment. Document realized savings against pre-deployment baseline for ROI reporting and any applicable utility incentive claims.
AI models now have sufficient operational data to detect subtle degradation patterns and seasonal efficiency variations. Shift the program focus from waste elimination to systematic efficiency optimization — using energy-per-unit benchmarking to drive production process improvements and using documented savings history to build the business case for capital equipment upgrades with quantified ROI.
iFactory provides the complete implementation support across all five phases — from asset criticality ranking and sensor specification through CMMS integration and optimization planning — so your team does not need dedicated energy management expertise to run a program that consistently delivers double-digit cost reductions.
06 2026 Energy Cost Context: Why the Urgency Is Higher This Year
Energy costs in manufacturing are not a stable input that efficiency improvements can offset once and then maintain. They are a rising, compounding pressure — and the competitive gap between facilities with energy visibility and facilities without it is widening every quarter.
US industrial electricity prices averaged 8.32 cents per kilowatt-hour in 2025, up from 8.15 cents in 2024 — and are projected to rise a further 7% in 2026. Manufacturing electricity demand itself increased 3% in 2024, the fifth-highest rise this century, driven by reshoring, electrification, and data center buildout competing for grid capacity in manufacturing-heavy regions. Supply is not keeping pace with demand in these regions, creating persistent upward pressure on industrial rates that shows no sign of reversing.
Manufacturing margins averaging 5–15% have almost no capacity to absorb these increases without operational response. The facilities that deploy real-time energy monitoring in 2026 gain a cost structure advantage that compounds: they reduce waste while their competitors absorb rising rates in full. That gap — documented at 15–20% in operational cost comparison between monitored and unmonitored facilities — does not close. It widens each time energy prices increase, because the monitored facility's cost base grows more slowly than the unmonitored one's.
The business case for energy monitoring in 2026 is not marginal. For a facility spending $500,000 annually on electricity, a 7% price increase means $35,000 in additional cost that was not in last year's budget. A 15% monitoring-driven reduction means $75,000 in annual savings. The net swing between deploying and not deploying is $110,000 per year — recurring, and growing as prices continue rising.
iFactory's energy monitoring deployments are scoped and prioritized specifically to address the 2026 cost environment — targeting the waste sources that deliver the fastest payback at current and projected energy prices, so the system's financial contribution is maximized from the first billing cycle after deployment.
With electricity prices rising 7% in 2026, every month of delay costs more than the month before. Book your iFactory demo now — and see the projected impact of monitoring on your 2026 energy budget before the next billing cycle arrives.
Your Competitors Are Monitoring. Are You?
Manufacturers with real-time energy monitoring hold a 15–20% cost structure advantage over facilities still running blind on monthly utility bills. In a 5–15% margin business, that advantage is the difference between winning and losing contracts. Book a demo to see iFactory live — and start building that advantage today.
Energy Monitoring ROI Readiness Matrix for Manufacturing
Use this matrix to understand where your facility stands on each cost-reduction mechanism, what impact to expect, and the deployment priority that maximizes first-year return.
| Cost Reduction Mechanism | Typical Waste Volume | Annual Savings Range | Monitoring Method | Time to First Savings |
|---|---|---|---|---|
| Compressed Air Leak Detection | 30% of compressed air energy lost | $35K–$75K per facility | Pressure drop rate + acoustic sensors | 2–4 weeks post-commissioning |
| Peak Demand Charge Avoidance | 30–50% of electricity bill | 15–25% demand charge reduction | Real-time demand curve monitoring | First billing cycle after deployment |
| Motor Degradation Correction | 12–18% excess draw per degrading motor | Proportional to motor count and rating | Current draw baseline deviation | 3–6 weeks — after baseline learning |
| Off-Hours Phantom Load Elimination | 5–15% of total facility consumption | Immediate once identified | Overnight consumption baseline | First week of monitoring |
| HVAC and Cooling Optimization | Up to 40% HVAC energy wasted | Up to 30% HVAC cost reduction | Zone temperature + energy correlation | 2–3 weeks post-commissioning |
| Production Energy Efficiency | 15–25% variance between identical machines | 15–20% competitive cost advantage | kWh per unit + production data correlation | 6–8 weeks — requires MES integration |
Want iFactory to map this matrix to your specific facility? Book a 30-minute session — we'll identify which mechanisms represent the highest savings potential for your facility type, energy spend, and equipment profile, and show you the platform live.
Frequently Asked Questions
See Exactly Where Your Facility's Energy Budget Is Going — Live, In the Demo
iFactory's demo is built around your facility's numbers. Bring your annual energy spend and we'll show you the projected savings range, the highest-waste mechanisms in your facility type, and the deployment roadmap that delivers first savings within 30 days.