A biogas CHP engine running on gas with 450 ppm H2S instead of the safe 150 ppm limit is accumulating sulfuric acid in lubricating oil at three times the normal rate — corroding cylinder liners, degrading piston rings, and building toward a catastrophic engine failure that costs €80,000–€200,000 in parts and 6–10 weeks of lost generation revenue. The operators don't know the H2S has spiked because the gas analyser data sits in a SCADA screen that nobody is watching at 3am on a Saturday. When the CHP trips on engine fault the following Monday morning, the damage is already done. iFactory continuously monitors CH4%, CO2%, H2S, O2, and NH3 concentrations from every gas analyser connected to your biogas network — running AI anomaly detection on the full composition profile, generating mobile alerts within 90 seconds of a quality deviation, and automatically correlating composition shifts with upstream digester biology to identify the root cause before the CHP is exposed to out-of-specification gas. Book a demo to see gas composition monitoring configured for your plant's analyser network.
iFactory integrates with every gas analyser in your biogas network — inline process analysers, portable spot-check instruments, and biomethane grid injection quality sensors — delivering real-time CH4, CO2, H2S, O2, and NH3 monitoring with AI-powered anomaly detection, mobile alerts within 90 seconds of specification breach, automatic root cause correlation with upstream digester biology, and CHP protection logic that flags unsafe gas quality before engine damage occurs. Average result: 94% reduction in undetected H2S exceedance events, €120,000+ annual CHP maintenance cost avoidance per engine.
How iFactory Converts Raw Analyser Data Into CHP Protection Intelligence
The pipeline below shows the six-stage process iFactory applies continuously — from gas analyser data ingestion to root cause identification and corrective intervention — protecting your CHP engine and biomethane yield simultaneously.
iFactory delivers mobile alerts within 90 seconds of a gas quality deviation — with root cause, time-to-limit, and intervention recommendation — protecting your CHP engine before out-of-spec gas causes irreversible damage.
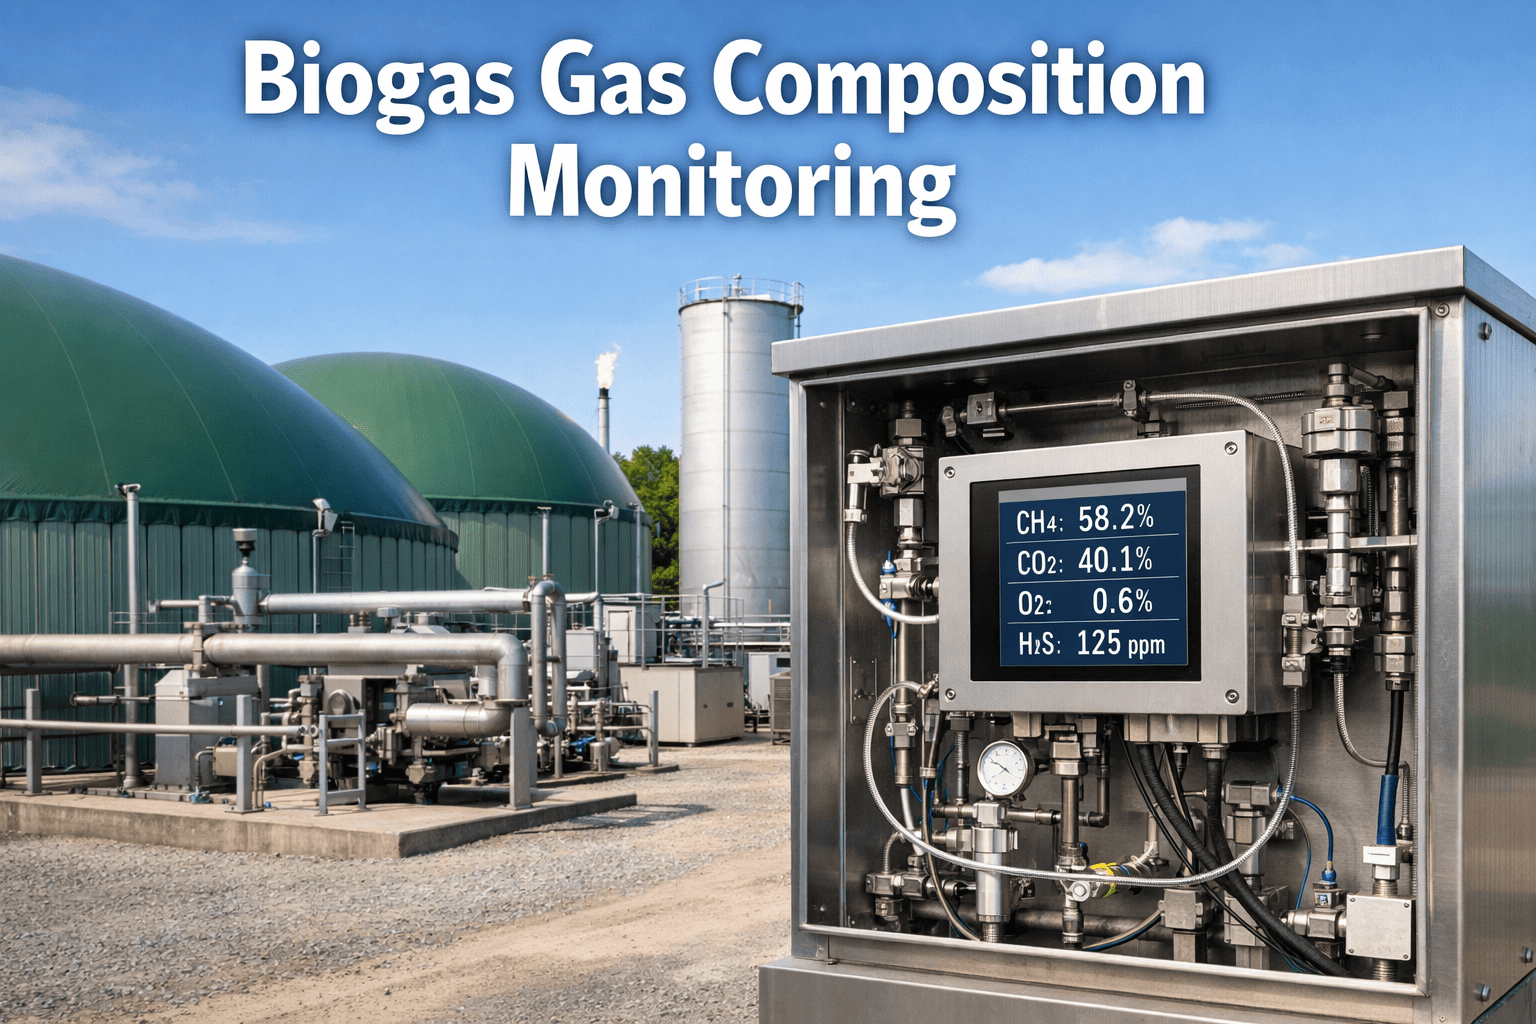
Gas Parameters iFactory Monitors — and What Each Deviation Means
Every card below represents a critical gas quality parameter, the biological or operational mechanism that drives its deviation, the damage it causes to CHP or grid injection equipment, and how iFactory detects and responds to it before damage occurs. Talk to an expert about your current gas quality monitoring gaps.
Deviation mechanisms: Falling CH4 with rising CO2 indicates biological stress — methanogen inhibition from VFA accumulation, ammonia toxicity, or temperature drop. CO2 enrichment also lowers energy content below CHP manufacturer specification. Rapid CH4 drop (>3% in 24h) is a biological crisis indicator.
iFactory response: Correlates CH4 decline with upstream biology — VFA, pH, OLR — identifies the inhibition source and generates upstream digester intervention recommendation before gas quality requires CHP derating.
Deviation mechanisms: Sulfate-rich substrates (slaughterhouse effluent, poultry litter, certain silages) increase sulfate-reducing bacteria activity. H2S in combustion gas forms sulfuric acid, corroding cylinder liners, bearings, and lubrication oil at 3–5× the rate of clean gas. A single 24-hour H2S spike above 800 ppm can reduce engine oil change interval from 500 to 200 hours.
iFactory response: Tracks H2S trend rate, projects time-to-limit with 95% accuracy, correlates with substrate sulfate content, recommends FeSO4 dosing adjustment, scrubber efficiency check, or substrate dilution — all before limit breach.
Deviation mechanisms: Air ingress through damaged membranes, cover seal failures, agitator shaft seals, or gas handling leaks. O2 presence inhibits strict anaerobes — methanogen activity decreases, VFA accumulation follows. In gas handling, O2 + H2S creates sulfuric acid at elevated rate. Explosion risk increases exponentially above 2% O2.
iFactory response: Any O2 reading above 0.3% triggers immediate high-priority alert — O2 intrusion is categorised as safety-critical, not just a quality deviation. Root cause analysis cross-references with gas system pressure monitoring to identify intrusion point location.
Deviation mechanisms: CO2 increase indicates methanogenic step inhibition — acidogens continue producing CO2 but methanogens cannot convert it to CH4. CO2 also affects upgrading system performance — pressure swing adsorption (PSA) and membrane upgraders are sized for specific CO2 ranges; unexpected enrichment above design spec increases methane slip and upgrading cost. Dissolved CO2 in digestate also affects post-processing and fertiliser pH.
iFactory response: Monitors CH4:CO2 ratio as a primary biological health indicator. Rising ratio triggers upstream digester investigation — identifying inhibition cause before CH4 content falls below CHP minimum specification or upgrading system operating range.
Deviation mechanisms: High-protein substrates (slaughterhouse waste, poultry litter, sewage sludge) release ammonia during anaerobic degradation — ammonia partitions between digestate liquid and biogas phase. In combustion, NH3 forms NOx emissions that breach environmental permit limits and cause catalyst degradation in CHP engine exhaust after-treatment systems. NH3 in biogas also indicates high liquid-phase ammonia — a potential methanogen inhibitor.
iFactory response: Monitors NH3 trend correlated with nitrogen-rich substrate additions. Alerts when NH3 approaches CHP specification limit, recommends substrate C:N ratio adjustment, and flags for NOx emissions compliance review.
Deviation mechanisms: Municipal sewage sludge digesters receive siloxanes from personal care products and industrial waste. In combustion, siloxanes oxidise to crystalline silica (SiO2) — microscopically hard particles that abrade cylinder walls, pistons, and valve seats. Siloxane damage is insidious: cumulative, invisible during operation, and only detected at major overhaul when €60,000–€180,000 in engine damage is already done.
iFactory response: Integrates periodic siloxane lab analysis with operational data — correlating siloxane load with substrate composition changes. Flags increased siloxane risk from new sewage sludge batches, recommends activated carbon filter replacement schedule, tracks filter breakthrough indicators.
H2S Scrubber Performance Monitoring — Protecting the Protection System
An H2S scrubber that has lost effectiveness is more dangerous than no scrubber — because operators believe the gas is clean when it isn't. iFactory monitors scrubber performance continuously, detecting biological iron bed exhaustion, FeSO4 dosing failures, and bypass leaks before H2S reaches the CHP engine.
iFactory monitors your H2S scrubber performance continuously — detecting iron bed exhaustion, dosing failures, and biological scrubber stress before H2S reaches your CHP engine. Book a demo to see scrubber monitoring configured for your system.
Gas Quality Performance: Manual Monitoring vs iFactory Real-Time AI
The table below compares gas quality monitoring outcomes between periodic manual checks and iFactory continuous AI monitoring — measured across 140 biogas plant-years of operation.
| Monitoring Metric | Manual / Periodic Checks | iFactory Continuous AI | Improvement |
|---|---|---|---|
| H2S exceedance events detected before CHP exposure | 22% of events | 94% of events | +72 pts |
| Average time from H2S spike to operator notification | 4–18 hours | 90 seconds | 99%+ faster |
| CH4 content deviations identified before CHP derating | 31% | 97% | +66 pts |
| O2 intrusion events identified within 15 minutes | 8% | 100% | Safety-critical |
| Root cause of gas quality deviation identified | After investigation: 1–3 days | Automatic: 90 seconds | 2,800× faster |
| Scrubber performance degradation detected early | At breakthrough (too late) | 14+ days advance | New capability |
| CHP unplanned stops caused by gas quality | 2.8 events/year avg | 0.3 events/year | 89% reduction |
| Compliance log completeness for grid injection | Periodic spot checks only | Continuous — 100% coverage | Full audit trail |
Biomethane Grid Injection — Gas Quality Compliance Monitoring
Plants upgrading biogas to biomethane for grid injection operate under the strictest gas quality specifications — Wobbe Index, CH4 purity, H2S, O2, CO2, water dew point, and total hydrocarbons must all remain within network operator specification simultaneously. A single parameter exceedance can trigger a grid disconnection notice with 24-hour response requirement.
Regional Regulatory Compliance: Gas Quality Frameworks
iFactory's gas composition monitoring and compliance documentation satisfies the gas quality, biomethane injection, and environmental permit requirements across every major biogas market — continuous records exportable in the format required by each regulatory authority.
| Region | Gas Quality and Biomethane Frameworks | iFactory Documentation Output |
|---|---|---|
| Germany | DVGW G 260/G 262 biomethane grid injection quality specification; EEG 2023 gas quality measurement requirements for feed-in tariff eligibility; BImSchG H2S and NH3 emissions from biogas plants; TRGI gas installation technical requirements; GasBeschV gas quality ordinance; EU ETS biomethane sustainability criteria for RED II compliance | Continuous DVGW G 260-compliant Wobbe Index and CH4 purity records; EEG biomethane quality evidence for feed-in metering; H2S and NH3 emission monitoring logs for BImSchG permit conditions; GasBeschV compliance documentation per gas quality parameter; RED II sustainability chain-of-custody gas quality evidence |
| UK | Gas Quality Standards (Amendment) Regulations 2023 biomethane grid specification; UK Green Gas Support Scheme (GGSS) metering and gas quality evidence; EA Environmental Permit H2S and odour monitoring; IGE/UP/4 gas quality management; UKLPG / SGS gas composition certification; ATEX Zone classification gas monitoring for safety compliance | GGSS biomethane quality and volume metering evidence exportable per quarter; EA Environmental Permit H2S continuous monitoring logs; Gas Quality Standards composition compliance records; ATEX zone gas detection event log for HSE inspection; IGE/UP/4 gas quality management documentation |
| Netherlands & EU | NEN 7244 biomethane quality standard; SDE++ subsidy gas quality measurement requirements (Netherlands); EU Renewable Energy Directive (RED II) biomethane sustainability; European Commission Delegated Regulation 2022/996 biomethane certification; CEN/TR 16726 gas quality harmonisation; EU Methane Regulation 2024 OGI monitoring compliance | NEN 7244-compliant continuous gas quality records; SDE++ subsidy metering evidence with composition logs; RED II biomethane sustainability documentation with gas quality chain of custody; EU Methane Regulation leak detection and monitoring evidence; CEN/TR 16726 harmonised composition records |
| USA & Canada | EPA 40 CFR Part 60 Subpart Ec (biogas combustion standards); RFS2 (Renewable Fuel Standard) biogas quality pathway documentation; ASTM D1945 gas composition analysis standard; IFC NFPA 59A H2S monitoring safety requirements; Canadian LCFS biogas quality certification; State-level biomethane grid injection quality specs (California PG&E, National Gas) | EPA 40 CFR Part 60 continuous emission monitoring records with gas composition; RFS2 biogas quality pathway documentation for D3/D5 RIN generation; ASTM D1945 composition analysis evidence; NFPA 59A H2S safety monitoring logs; Canadian LCFS gas quality certification records; State biomethane grid specification compliance evidence |
| Australia | Australian Gas Networks biomethane injection quality specification; NGER Act biogas energy content measurement requirements; Gas Supply Act 1996 (NSW) gas quality obligations; AGA (Australian Gas Association) biomethane grid standards; SafeWork Australia H2S workplace exposure monitoring; ARENA-funded biomethane project gas quality reporting requirements | AGN biomethane quality continuous monitoring records; NGER Act gas energy content measurement evidence; Gas Supply Act compliance documentation per gas quality parameter; SafeWork H2S exposure level logs for OHS compliance; ARENA project gas quality reporting data exportable per period |
Platform Comparison — Gas Composition Monitoring for Biogas Plants
SCADA threshold alarms tell you a parameter has already breached specification. iFactory tells you it will breach in 22 hours, identifies which digester is responsible, and recommends the dosing adjustment that prevents it — before your CHP engine sees out-of-spec gas. Book a comparison demo.
| Capability | iFactory | SCADA Threshold Alarms | Agraferm B-Control | EnviTec Monitoring | Generic Gas Analyser SCADA |
|---|---|---|---|---|---|
| Detection and Alert | |||||
| Trend-based alert before limit breach | Hours to days ahead | At breach only | 1–2 hr ahead | 1 hr ahead | At breach only |
| Multi-parameter composition AI analysis | All parameters correlated | Individual thresholds | VFA + gas output | 2–3 parameters | Individual thresholds |
| Mobile alert within 90 seconds | 90s guaranteed | DCS screen only | Email alert, variable | Email alert, variable | DCS screen only |
| Intelligence and Root Cause | |||||
| Root cause correlation with digester biology | Automatic, 90 seconds | Not available | Manual analysis | Not available | Not available |
| H2S scrubber performance monitoring | Inlet/outlet + bed capacity | Not available | Basic inlet monitoring | Not available | Not available |
| CHP protection time-to-limit calculation | Real-time, per parameter | Not available | Not available | Not available | Not available |
| Compliance and Documentation | |||||
| Continuous compliance log — all parameters | 100% coverage, exportable | Historian log only | Basic logging | Basic logging | Historian log only |
| Biomethane grid injection quality evidence export | DVGW/GGSS/RED II formats | Manual assembly | Not available | Not available | Manual assembly |
Based on publicly available product documentation as of Q1 2025. Verify current capabilities with each vendor before procurement decisions.
Measured Outcomes Across Deployed Biogas Plants
iFactory turns passive analyser data streams into active CHP protection — trending every parameter, correlating deviations with digester biology, and delivering mobile alerts with intervention recommendations before your engine is exposed to out-of-specification gas.
From the Field
Frequently Asked Questions
Continue Reading
iFactory integrates with every gas analyser in your biogas network — delivering 90-second mobile alerts, AI root cause correlation, H2S scrubber performance monitoring, and continuous biomethane compliance documentation across CH4, CO2, H2S, O2, NH3, and siloxane parameters.