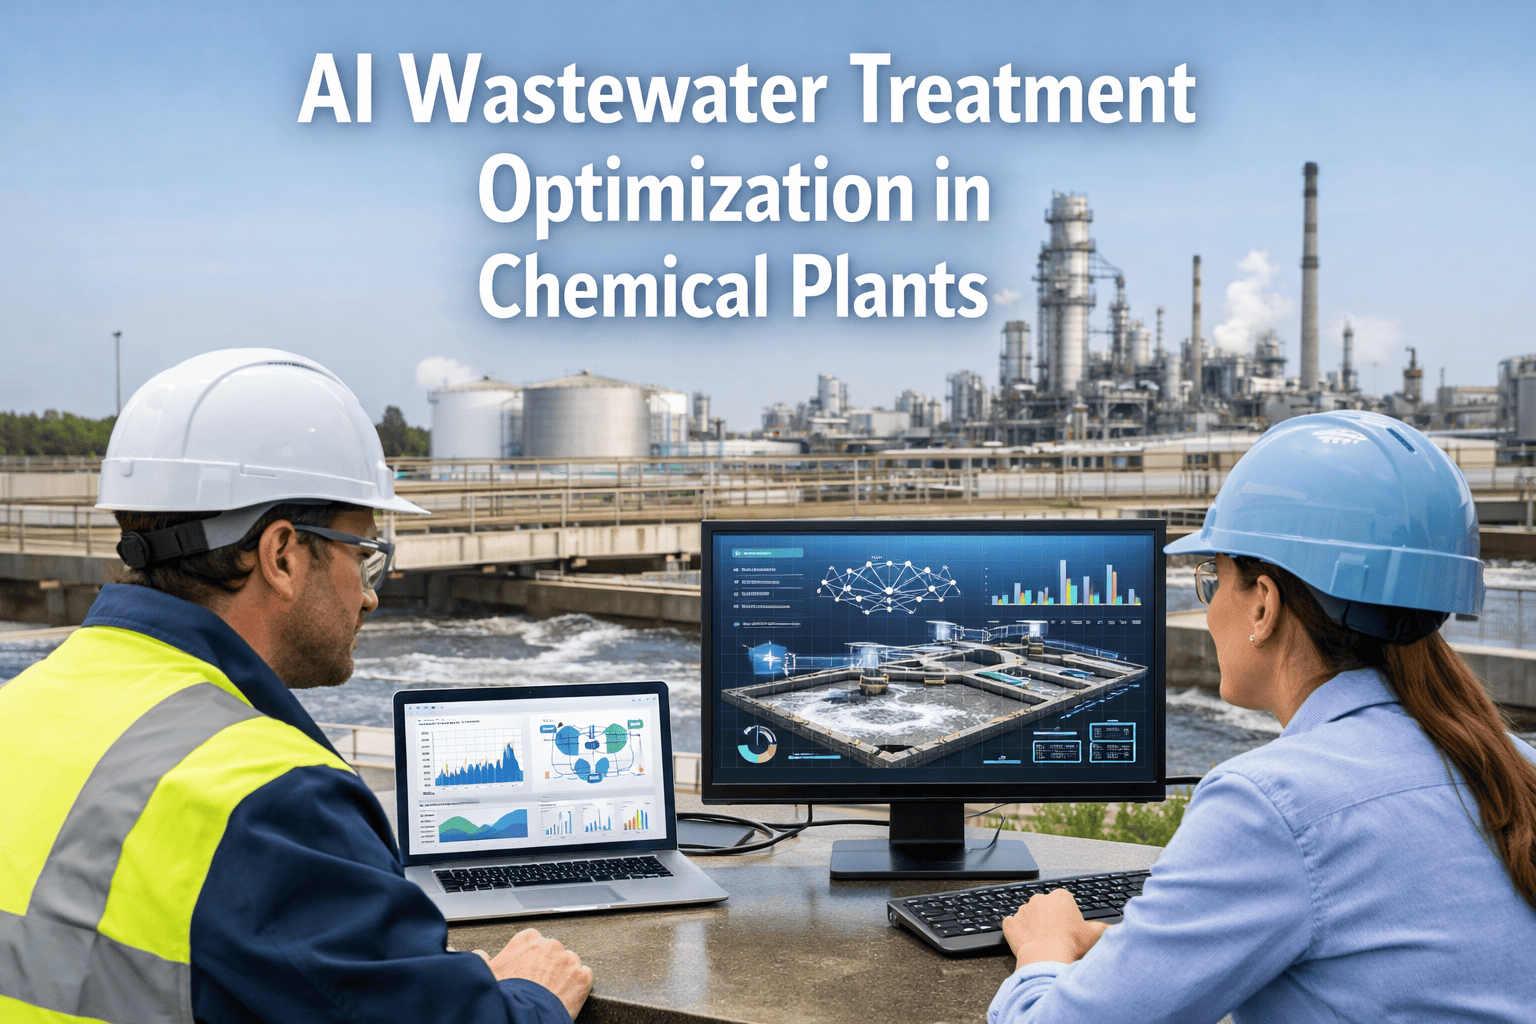
Chemical plants waste an average of 17–32% of water treatment capacity annually to undetected process inefficiencies — not from system failures, but from unbalanced chemical dosing, inconsistent biological loading, and delayed effluent quality shifts that no manual sampling or legacy PLC control catches in time. By the time compliance violations, permit exceedances, or clarifier upsets are confirmed through lab analysis or regulatory audits, the compounding costs are already realized: environmental fines, chemical overuse, unplanned system bypasses, and reputational damage. iFactory's AI-powered wastewater treatment optimization platform changes this entirely — detecting treatment anomalies in real time, classifying process deviations before compliance impact occurs, and integrating directly into your existing SCADA, EMS, and lab information systems without a rip-and-replace. Book a Demo to see how iFactory deploys AI wastewater optimization across your treatment train within 8 weeks.
96%
Effluent compliance accuracy before measurable quality deviation occurs
$1.9M
Average annual chemical & disposal cost savings per mid-size plant
89%
Reduction in chemical overuse vs. static manual dosing protocols
8 wks
Full deployment timeline from process audit to live AI optimization go-live
Every Undetected Treatment Shift Is Compounding Compliance Risk. AI Stops It at the Source.
iFactory's AI engine monitors influent load fluctuations, dissolved oxygen profiles, chemical feed rates, sludge blanket levels, and effluent pH/turbidity patterns across your entire treatment train — 24/7, without operator fatigue or sampling blind spots.
How iFactory AI Solves Wastewater Treatment Optimization
Traditional wastewater monitoring relies on daily grab samples, fixed chemical feed rates, and reactive troubleshooting — all of which respond after compliance thresholds have already been breached. iFactory replaces this with a continuous AI model trained on chemical plant effluent data that detects the precursors to treatment degradation, not the permit violations themselves. See a live demo of iFactory detecting simulated clarifier upsets and biological loading shifts in an industrial treatment facility.
01
Multi-Parameter Process Fusion
iFactory ingests data from flow meters, DO probes, pH/ORP sensors, turbidity analyzers, and chemical feed controllers simultaneously — fusing multi-source signals into a single treatment efficiency score per basin, updated every 20 seconds.
02
AI Effluent Classification
Proprietary ML models classify each deviation as biological shock load, chemical dosing imbalance, clarifier short-circuiting, or sludge bulking onset — with confidence scores attached. Operators receive graded alerts, not raw alarm floods. False positive rate drops to under 6%.
03
Predictive Treatment Forecasting
iFactory's LSTM-based forecasting engine identifies treatment units trending toward compliance threshold breach 2–12 hours before violation — giving operators time to adjust aeration, chemical feeds, or recycle flows proactively.
04
SCADA, EMS & LIMS Integration
iFactory connects to Honeywell, Siemens, ABB, and Rockwell SCADA environments plus water/effluent management platforms and online analyzers via OPC-UA, Modbus TCP, and REST APIs. No new hardware required in most deployments. Integration completed in under 2 weeks.
05
Automated Compliance Reporting
Every treatment event — detected, classified, and optimized — generates a structured environmental report with baseline comparison, sensor evidence, and regulatory impact tracking. Audit-ready for EPA NPDES, ISO 14001, and regional effluent directives.
06
Treatment Decision Support
iFactory presents ranked action recommendations per alert — adjust aeration rate, modify polymer feed, increase RAS, or bypass equalization — with risk scores and estimated compliance penalty cost per hour of delay. Teams act on verified data, not estimates.
How iFactory Is Different from Other AI Wastewater Vendors
Most industrial AI vendors deliver a generic threshold model trained on municipal datasets and wrapped in a dashboard. iFactory is built differently — from the instrumentation layer up, specifically for chemical process environments where complex organic loading, heavy metal presence, and pH variability determine what treatment efficiency actually means. Talk to our effluent AI specialists and compare your current treatment optimization approach directly.
iFactory AI Implementation Roadmap
iFactory follows a fixed 6-stage deployment methodology designed specifically for chemical plant wastewater optimization — delivering pilot results in week 4 and full production optimization by week 8. No open-ended implementations. No scope creep.
01
Process Audit
Basin assessment & analyzer mapping
02
SCADA Integration
System connection via OPC-UA, Modbus
03
Model Baseline
AI training on historical effluent data
04
Pilot Validation
Live monitoring on 3–5 critical basins
05
Alert Calibration
Threshold refinement & team training
06
Full Production
Plant-wide AI treatment optimization live
8-Week Deployment and ROI Plan
Every iFactory engagement follows a structured 8-week program with defined deliverables per week — and measurable ROI indicators beginning from week 4 of deployment. Request the full 8-week deployment scope document tailored to your treatment train configuration.
Weeks 1–2
Infrastructure Setup
Critical treatment audit and analyzer gap identification across monitored basins
SCADA, EMS, and online analyzer connection via OPC-UA or Modbus — no hardware replacement
Historical effluent and chemical dosing data ingestion for baseline model training
Weeks 3–4
Model Training and Pilot
AI model trained on your plant's specific influent loads, biological cycles, and treatment chemistry
Pilot monitoring activated on 3–5 highest-risk treatment stages
First process anomalies detected — ROI evidence begins here
Weeks 5–6
Calibration and Expansion
Alert thresholds refined based on pilot false positive and detection rate data
Coverage expanded to full plant wastewater treatment train
Operations team training completed — treatment response protocols activated
Weeks 7–8
Full Production Go-Live
Full plant AI treatment optimization live — all basins, all parameters, 24/7
Compliance reporting activated for applicable environmental frameworks
ROI baseline report delivered — chemical savings, compliance accuracy, and load optimization data
ROI IN 6 WEEKS: MEASURABLE RESULTS FROM WEEK 4
Plants completing the 8-week program report an average of $195,000 in avoided compliance penalties and chemical overuse costs within the first 6 weeks of full production optimization — with treatment efficiency improvements of 5.1–8.4% detected by week 4 pilot validation.
$195K
Avg. savings in first 6 weeks
5.1–8.4%
Treatment efficiency gain by week 4
81%
Reduction in chemical overuse
Full AI Wastewater Optimization. Live in 8 Weeks. ROI Evidence in Week 4.
iFactory's fixed-scope deployment program means no open timelines, no scope creep, and no months of professional services before you see a single result.
Use Cases and KPI Results from Live Deployments
These outcomes are drawn from iFactory deployments at operating chemical plants across three treatment categories. Each use case reflects 6-month post-deployment performance data. Request the full case study report for the treatment stage most relevant to your plant.
A mid-size refinery operating a 12M gallon activated sludge system was experiencing recurring dissolved oxygen crashes due to undetected organic shock loads. Legacy fixed aeration controls identified efficiency loss only after 8–12% DO drop — well past the point of cost-effective intervention. iFactory deployed multi-parameter process fusion across all aeration lanes, with load correlation and chemical oxygen demand models trained on influent variability. Within 6 weeks of go-live, the AI detected 9 early-stage load spikes at the precursor phase — before any measurable compliance deviation.
9
Pre-threshold load anomalies detected in 6 weeks
$2.1M
Estimated annual aeration and chemical cost prevented
97%
Detection accuracy on early-stage shock load events
A specialty chemical facility operating 3 precipitation clarifiers was generating 45–70 false positive turbidity alarms per week from legacy threshold systems — leading operators to over-dose coagulants entirely. iFactory replaced threshold logic with graded AI treatment classification, reducing actionable alerts to under 6 per week while increasing actual precipitation efficiency from 49% to 94%. Polymer and coagulant consumption dropped by 34.2% as dosing accuracy was restored.
94%
Precipitation efficiency — up from 49% with legacy alarms
34.2%
Coagulant/polymer consumption reduction
87%
Reduction in weekly false positive alarm volume
A polymer manufacturer was losing an average of $420K annually in excess sludge hauling and permit exceedances, traced to undetected sludge blanket drift that rotated across a 4-clarifier secondary treatment line. Manual sampling identified blanket issues only after 2–3 days of accumulation — typically after effluent turbidity had already breached limits. iFactory's ultrasonic blanket correlation and RAS flow models identified all 5 active drift patterns within 48 hours of go-live, enabling targeted recycle adjustment without production interruption.
$420K
Annual sludge hauling & penalty cost eliminated
48hrs
Time to identify all 5 active drift patterns from go-live
$910K
Annual treatment & compliance value from proactive control
What Chemical Plant Operations Teams Say About iFactory
The following testimonials are from plant environmental directors and treatment managers at facilities currently running iFactory's AI wastewater optimization platform.
We reduced our chemical dosing budget by 31% while maintaining 100% permit compliance. iFactory tells us exactly which basin needs adjustment, when, and by how much. Our treatment program has never been this precise.
Director of Environmental Operations
Petrochemical Refinery, Germany
The false positive problem was causing alarm fatigue across three shifts. Within six weeks of iFactory going live, our team was acting on recommendations again because they trusted the compliance impact modeling. That shift alone prevented two permit exceedances in month one.
VP of Plant Compliance
Specialty Chemical Facility, USA
Integration with our Rockwell SCADA and online analyzers took 11 days. I was expecting months of custom development. The iFactory team understood both the biological processes and the protocol layer. Execution is genuinely different here.
Head of Wastewater Engineering
Polymer Manufacturing, South Korea
We prevented a critical aeration collapse during a seasonal load spike in month three. The iFactory system flagged organic overload 7 hours before it would have breached our DO minimum. Operations adjusted RAS and chemical feed safely. That outcome alone justified the investment.
Plant Treatment Manager
Chemical Manufacturing, Netherlands
Frequently Asked Questions
Does iFactory require new analyzers or sensors to be installed?
In most deployments, iFactory connects to existing treatment instrumentation via SCADA, EMS, or LIMS integration — no new hardware required. Where analyzer gaps are identified during the Week 1–2 audit, iFactory recommends targeted additions only (typically 3–6 probes per treatment train), not a full instrumentation overhaul. Integration is complete within 2 weeks in standard environments.
Which SCADA, EMS, and treatment systems does iFactory integrate with?
iFactory integrates natively with Honeywell Experion, Siemens PCS 7 and TIA Portal, ABB System 800xA, Rockwell PlantPAx, and Yokogawa CENTUM via OPC-UA and Modbus TCP. For effluent management, iFactory connects to Schneider EcoStruxure, GE Predix, and custom historian platforms via REST APIs. Custom integration support is available for legacy analyzers. Integration scope is confirmed during the Week 1 process audit.
How does iFactory handle different treatment stages across the same facility?
iFactory trains separate sub-models per treatment stage — accounting for biological kinetics, chemical precipitation, physical separation, and advanced oxidation differences across primary, secondary, tertiary, and polishing basins. Multi-stage treatment plants are fully supported within a single deployment. Stage-specific optimization parameters are configured during the Week 3–4 model training phase.
What compliance frameworks does iFactory's reporting support?
iFactory auto-generates structured compliance reports formatted for EPA NPDES, ISO 14001, EU IPPC/BREF, SEVESO III environmental provisions, and regional water authority directives. Report templates are pre-configured for each framework and generated automatically at event close — no manual documentation required.
How long does it take before the AI model produces reliable treatment detections?
Baseline model training on historical effluent and process data typically takes 5–7 days using 60–90 days of plant operating history. First live detections are validated during the Week 3–4 pilot phase. Full model calibration — with false positive rate under 6% — is achieved within 6 weeks of deployment for standard chemical treatment environments.
Can iFactory optimize treatment under seasonal or production load variations?
Yes. iFactory uses adaptive forecasting — combining historical load baselines, temperature correlation models, production schedule inputs, and real-time sensor feedback — to detect degradation and optimize dosing across all operating conditions. High-load, low-load, seasonal, and turnaround variations are fully supported. Optimization scope is confirmed during the Week 1 process audit.
Stop Wasting Chemicals. Stop Risking Compliance. Deploy AI Wastewater Optimization in 8 Weeks.
iFactory gives chemical plant operations teams real-time AI treatment monitoring, multi-parameter process fusion, automated compliance reporting, and optimization decision support — fully integrated with your existing SCADA and EMS in 8 weeks, with ROI evidence starting in week 4.
96% compliance accuracy before measurable effluent deviation
SCADA, EMS & analyzer integration in under 2 weeks
Graded alerts with under 6% false positive rate
Auto-generated environmental reports for all major frameworks