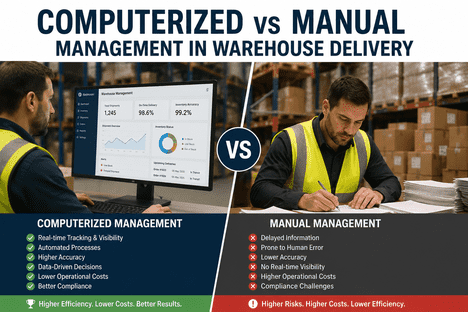
Warehouses running manual analytics management are operating with a critical blind spot — missing 60% of early failure signals that computerized systems catch before they escalate. Every late-discovered anomaly, every trend buried in a spreadsheet, every decision based on stale data compounds into avoidable downtime, inflated carrying costs, and compliance exposure that manual processes cannot keep pace with. The gap between computerized and manual analytics in warehouse delivery operations is no longer a technology preference — it is a performance and compliance divide. Teams that Book a Demo with iFactory AI see how automated analytics replaces reactive data-gathering with real-time intelligence that surfaces anomalies, trends, and optimization opportunities without any manual assembly.
Stop Running Warehouse Analytics on Manual — Switch to Real-Time Intelligence
iFactory AI's computerized analytics platform captures, surfaces, and acts on every data signal from your warehouse and delivery operations — without spreadsheets, without delays, without manual effort.
Computerized vs Manual Analytics: The Real Performance Gap in Warehouse & Delivery
Most warehouse and delivery operations generate enormous volumes of operational data — pick rates, dock utilization, fleet fuel consumption, order cycle times, inventory turnover, equipment condition. The difference between high-performing and struggling operations is not the data they collect. It is whether that data is analyzed by a human staring at spreadsheets or by a computerized analytics engine that surfaces patterns, anomalies, and optimization signals in real time. The performance gap between the two approaches is measurable, widening, and directly tied to operating margins.
Where Manual Analytics Breaks Down in Warehouse Operations
Manual analytics feels manageable until the moment it isn't. These are the six failure points that warehouse managers consistently report — each one preventable with a computerized analytics platform like iFactory AI. The pattern is always the same: data exists, but it lives in disconnected spreadsheets, siloed systems, or paper logs that never get cross-referenced until something breaks. iFactory's unified analytics dashboard eliminates every one of these gaps.
With manual analytics, problems surface only when someone looks at the data — or when a failure occurs. A conveyor bearing that has been running 12°C above normal for three days goes unnoticed because temperature logs are reviewed weekly. iFactory AI's computerized analytics engine monitors every sensor feed continuously and flags anomalies in real time, before failure. Automated alerts reach the maintenance team with context: asset ID, trend data, and recommended action — all without a human touching the data.
On a spreadsheet or manual log, an overdue preventive maintenance task or past-due inspection sits silently. There are no alerts, no escalations, no visibility into accumulating risk across 50 forklifts, 12 dock doors, and 8 conveyor lines. Computerized analytics surfaces every overdue task with aging status, priority ranking, and automatic reassignment logic. iFactory's analytics reporting module generates exception reports daily so nothing falls through the cracks.
What the outgoing shift knew about an in-progress repair, a recurring fault pattern on dock leveler #4, or a back-ordered part — gone at shift change. Manual handoff notes are incomplete, illegible, or forgotten. iFactory AI builds persistent asset timelines that survive across every shift, storing full repair histories, fault patterns, and pending actions against each asset. A technician starting a new shift opens the asset record and sees everything: last three inspection results, open work orders, trending sensor data.
Technicians on manual systems walk to the storeroom not knowing if the part they need exists. Emergency procurement delays extend every unplanned repair from hours to days. Computerized analytics integrates inventory data with work order history, automatically flagging stockout risks before they become downtime events. iFactory's Parts & Inventory module tracks stock levels, reorder points, and usage velocity across every warehouse location from a single dashboard.
Preparing documentation for OSHA, fire safety, or forklift certification audits with manual records means pulling paper logs, chasing technicians for sign-offs, and manually compiling data from inconsistent sources. Computerized analytics generates audit-ready reports instantly — every inspection timestamped, signed, and linked to the specific asset. iFactory's Safety and Compliance module reduces audit prep from weeks to under two hours.
Manual analytics reports what was spent — it cannot tell you which conveyor line consumed 35% of your maintenance budget, whether contractor labor matched the quoted scope, or which asset is trending toward a cost-overrun threshold. iFactory's Automated Analytics Reporting module gives real-time cost attribution by asset, by equipment class, and by cost category — so decisions are made on current data, not last month's numbers.
Head-to-Head: Computerized vs Manual Analytics in Warehouse & Delivery
This is how the two approaches compare across every dimension that affects warehouse performance, delivery reliability, safety, and total cost. The data reflects real operational benchmarks from U.S. warehouses that have transitioned from manual analytics to computerized platforms like iFactory AI.
| Performance Dimension | Manual Analytics | Computerized (iFactory AI) |
|---|---|---|
| Failure Detection Speed | After failure occurs — or during next data review | Real-time — sensor-triggered anomaly alerts |
| Data Refresh Cadence | Weekly or monthly spreadsheet updates | Continuous — sub-minute latency |
| PM Compliance Rate | 40–55% | 90–97% |
| Mean Time to Repair | 12–20 hours average | 5–8 hours average |
| Audit Preparation Time | 100–300 hours | Under 2 hours |
| Maintenance Cost Variance | ±25–35% | ±5% |
| Inventory Accuracy | 82–90% | 97–99% |
| Parts Stockout Frequency | High — no auto-replenishment | Low — threshold-based reordering |
| Technician Productive Time | 28–35% wrench time | 55–65% wrench time |
| Asset History Availability | Incomplete or unavailable | Full digital history per asset |
What the Switch Actually Looks Like: A Warehouse Scenario
Abstract comparisons are less useful than a concrete example. Here is how the same maintenance event unfolds in a warehouse running manual analytics versus one running iFactory AI's computerized analytics platform.
Conveyor Drive Motor Overheating
Temperature anomaly noted by operator. Work order created on paper. Technician not immediately available — repair queued for next day. No spare motor in stock. Motor fails overnight. 14 hours of conveyor downtime. Delivery dispatch delayed by 3 hours. Emergency contractor called. Repair cost 3x the preventive alternative. No compliance record created.
Conveyor Drive Motor Overheating
Motor temperature rises 8°C above baseline. iFactory AI analytics flags anomaly in real time and auto-creates MEDIUM priority work order. On-call technician receives mobile alert with full asset history and last three temperature logs. Replacement motor confirmed in stock via Parts & Inventory module. Repair completed in 2 hours. Compliance record auto-filed. Delivery dispatch unaffected. Zero overtime cost.
See the Difference Real-Time Analytics Makes — Book a Walkthrough
iFactory AI connects every data source in your warehouse and delivery operation — sensor feeds, work orders, inventory, compliance records — into one analytics dashboard that surfaces what matters before it becomes a problem.
KPIs That Tell You If Your Analytics Transition Is Working
Once you switch from manual to computerized analytics, these are the metrics to track monthly. iFactory AI's Automated Analytics Reporting module generates all of them automatically — no manual data assembly required — so you measure progress instead of spending time creating reports.
The ROI Case for Computerized Analytics Adoption
The financial case for switching from manual to computerized analytics is not theoretical. These are real cost categories where warehouse and delivery operations recover budget after implementing iFactory AI's analytics platform. Every dollar saved compounds across the network — fewer emergency repairs, higher technician productivity, less overtime, no compliance penalties.
Save 60–70% on Unplanned Repairs
Computerized analytics-driven preventive maintenance dramatically cuts emergency call-outs, overtime, and expedited parts procurement. iFactory's predictive analytics identifies failure patterns before they become breakdown events.
Save 28–35% on Technician Labor
Technicians spend less time on paperwork, parts hunting, and status updates. iFactory's mobile-first platform gives them asset history, work instructions, and parts availability at their fingertips — more wrench time per shift with the same headcount.
Save $80K–$200K+ per Year
Fewer unplanned stoppages means consistent dispatch throughput, fewer delivery SLA penalties, and no emergency contractor fees. Real-time analytics combined with automated PM scheduling keeps equipment running at design capacity.
Save 200+ Hours per Year
Audit-ready documentation is generated automatically by iFactory's analytics reporting. No scrambling before OSHA reviews, fire safety inspections, or forklift certification renewals. Every record timestamped, signed, and asset-linked.
Expert Review: What Manual Analytics Gaps Actually Cost
The most common analytics gaps in U.S. warehouse and delivery operations are not dramatic — they are omissions. A temperature anomaly not reviewed until the weekly report. A pick-path efficiency drop that went unnoticed for three weeks. An inventory discrepancy found during the annual audit instead of the day it occurred. These omissions compound over time and are rarely traced back to the analytics gap — because there is no analytics history to review. Three patterns emerge repeatedly in warehouses with high unplanned downtime and escalating maintenance costs.
No Baseline, No Benchmark
Without a computerized analytics baseline recording asset temperatures, vibration levels, cycle times, and energy consumption from day one, there is no objective measure of whether equipment is degrading or simply running at its actual design capability. Plants discover this gap during the first major failure investigation — when the question "what was normal three months ago?" cannot be answered.
Data Lag Creates Decision Debt
When analytics data is updated weekly or monthly, every decision made in between is based on stale information. A stockout that started building 10 days ago is discovered when the picker arrives at an empty bin, not when the reorder point was crossed. iFactory's real-time analytics eliminates this lag entirely — the data the dashboard shows is the data the warehouse is producing right now.
Spreadsheets Don't Scale Across Facilities
A single warehouse running on spreadsheets is fragile. A multi-site operation running on spreadsheets is unmanageable. Each location maintains its own data, its own naming conventions, its own reporting cadence. Cross-site comparison requires manual consolidation that takes days and produces unreliable results. iFactory AI unifies analytics across every site in a single dashboard — same data model, same KPIs, same reporting — enabling multi-site decisions based on apples-to-apples data. Teams that book a demo with iFactory see how unified analytics transforms multi-site operations.
Frequently Asked Questions
What is the difference between computerized analytics and a standard WMS reporting module?
A standard WMS reporting module shows you what happened — historical data on orders picked, inventory moved, shipments completed. Computerized analytics goes beyond reporting to actively analyze data streams in real time, identify anomalies, surface optimization opportunities, and trigger automated actions. iFactory AI's analytics engine continuously monitors every connected data source and alerts teams to patterns that a WMS report would not surface until the next manual review cycle.
How long does it take to transition from manual analytics to computerized analytics?
Most mid-size warehouse operations complete the transition within 4–8 weeks with iFactory AI. The onboarding team imports your asset list, configures analytics dashboards tailored to your equipment and operations, connects sensor and system data sources, and trains your crew on the mobile app and dashboard. Most teams are generating live analytics from their first week of operation, with full baseline trending established within 30 days.
What data sources does iFactory AI's analytics platform connect to?
iFactory AI connects to PLC sensors, IoT temperature and vibration monitors, existing WMS and ERP systems, fuel card and telematics platforms, barcode scanners, and manual entry points via mobile app. The analytics engine normalizes data from every source into a unified dashboard — so conveyor sensor data, forklift telematics, inventory snapshots, and work order history appear in the same view. No data source is too small or too large.
What is the typical payback period for computerized analytics in warehouse operations?
Most mid-size warehouse operations recover the full cost of iFactory AI implementation within 8–14 months through reduced emergency repair costs, labor efficiency gains, lower inventory carrying costs, and avoided downtime penalties. Operations with high delivery SLA exposure tend to see faster payback due to dispatch reliability improvements. The average payback period across iFactory's warehouse client base is 11 months.
Can computerized analytics work in a multi-site warehouse operation?
Yes. iFactory AI is designed for multi-site operations. Each site maintains its own data and dashboards, but all sites roll up into a unified corporate view with consistent KPIs, naming conventions, and reporting standards. Cross-site comparisons — which site has the highest emergency repair rate, best PM compliance, lowest inventory variance — are available in the executive dashboard without any manual consolidation. Multi-site operators consistently report that unified analytics is the highest-value feature of the iFactory platform.
Ready to Replace Manual Analytics with Real-Time Intelligence?
iFactory AI's computerized analytics platform connects every data source in your warehouse and delivery operation — sensor feeds, work orders, inventory, compliance records — into one dashboard that surfaces what matters before it becomes a problem. No spreadsheets. No manual assembly. No missed signals.