US warehouse delivery operations managing high-volume fulfilment no longer have the margin tolerance for reactive maintenance scheduling. Equipment downtime, inaccurate inventory, missed SLAs, and untracked labour cost variances are compounding into a margin crisis across American logistics facilities and basic PM calendars cannot solve any of it. iFactory AI delivers the predictive analytics, asset intelligence, and operational visibility layer that operations directors across the USA are deploying to protect margins, hit fulfilment KPIs, and scale without proportional headcount growth. Book a demo with an iFactory expert to see the platform built for US warehouse and delivery operations.
US Warehouse & Delivery Operations · Analytics · AI
The Complete Guide to US Warehouse Delivery Operations Analytics
High-volume fulfilment operations need AI predictive analytics — not basic PM scheduling. See why operations directors across the USA are switching to iFactory AI to protect margins, cut unplanned downtime, and deliver on every SLA.
Why US Warehouse Operations Are Switching to AI Predictive Analytics in 2026
The US logistics sector entered 2026 under compounding pressure. The trucking industry remains short by over 80,000 drivers. Customer expectations for same-day and next-day fulfilment are at an all-time high. And equipment failures — conveyor breakdowns, dock leveller faults, forklift downtime are costing distribution centres an average of 5–8% of available operational hours. Operations directors who managed these pressures with spreadsheets, reactive maintenance calls, and shift-by-shift gut decisions are now falling behind competitors who have deployed AI analytics at the floor level.
iFactory AI sits at the convergence of predictive maintenance, asset management, production monitoring, and quality control giving US warehouse and delivery operations a single platform that turns floor data into decisions, not dashboards that require analysts to interpret them.
01
Unplanned Downtime Is the Margin Killer
A single unplanned conveyor stop during peak shift can cascade into missed despatch windows, labour overtime, and SLA penalties. Reactive maintenance — fixing it after it breaks — is no longer acceptable at gigafacility scale. AI predictive analytics detects degradation signatures before failure, scheduling intervention during planned windows.
02
Basic PM Schedules Don't Reflect Real Usage
Calendar-based preventive maintenance over-services low-utilisation assets and under-services high-cycle equipment. In US warehouse environments where conveyor throughput, dock activity, and forklift cycles vary dramatically by shift and season, usage-based AI maintenance scheduling is the only approach that protects both margin and uptime.
03
Inventory Accuracy Below 99% Costs Real Money
Industry benchmarks target 99.5%+ picking accuracy and inventory record accuracy. Each percentage point below that threshold generates downstream returns, customer dissatisfaction costs, and write-off exposure. iFactory's quality control and inspection modules give operations teams real-time inventory accuracy tracking with automated discrepancy alerts.
04
Labour Cost Without Visibility Is Unmanageable
Labour is the largest controllable cost in US warehouse operations — typically 50–65% of total operating expense. Without shift-level productivity analytics, cost-per-unit-handled tracking, and real-time output monitoring by zone, labour budgets are managed on lag, not lead. iFactory delivers the shift logbook and team management layer that makes labour data actionable in real time.
05
Equipment OEE Is the True Utilisation Metric
World-class warehouse OEE targets exceed 85%. Most US distribution centres are operating at 65–75% — meaning 10–20% of available equipment capacity is lost to downtime, speed losses, or quality defects. iFactory's OEE Analytics module makes this visible, quantified, and actionable at the asset level, not the site aggregate.
06
Delivery SLA Compliance Requires End-to-End Visibility
On-time shipping rate — the percentage of orders that depart on schedule — is the fulfilment KPI that feeds every customer SLA. Achieving consistent 95%+ on-time rates requires upstream visibility into pick rates, dock availability, vehicle readiness, and despatch throughput — all connected in a single operational picture that iFactory provides.
The 8 Critical Analytics Modules for US Warehouse & Delivery Operations
iFactory AI is not a point tool for one problem. It is an integrated operations intelligence platform covering every dimension of warehouse and delivery performance — from equipment health to energy consumption to vendor compliance. Below are the eight modules that US operations directors deploy first.
1
Predictive Maintenance
AI models ingest sensor data from conveyors, dock equipment, forklifts, HVAC, and sortation systems to detect degradation patterns before failure. Maintenance work orders are generated automatically, scheduled to planned windows, and routed to the right technician with full asset history. Unplanned downtime drops. Maintenance labour is allocated to actual need, not calendar date.
Primary KPI Impact
Equipment Downtime Reduction
2
OEE Analytics
Availability, Performance, and Quality metrics are calculated per asset, per shift, per zone — in real time. OEE dashboards surface where capacity is being lost, what is causing it, and which assets are approaching the threshold where intervention is required. Operations managers move from reactive loss reviews to proactive OEE improvement programmes.
Primary KPI Impact
Equipment Utilisation Rate
3
Production & Throughput Monitoring
Real-time throughput tracking by pick zone, despatch lane, and loading dock. Units-per-hour benchmarks set by shift, product category, or warehouse zone. Alerts fire when throughput drops below threshold before the shortfall becomes a despatch failure. Shift supervisors see the problem in time to act — not in the morning debrief.
Primary KPI Impact
On-Time Shipping Rate
4
Shift Logbook & Team Management
Digital shift handover records replace paper logs and fragmented WhatsApp threads. Every shift incident, throughput shortfall, equipment issue, and maintenance event is captured, timestamped, and searchable. Labour productivity by shift and zone is tracked automatically. Managers making staffing decisions have data — not impressions — from the last 90 days of shift performance.
Primary KPI Impact
Labour Cost per Unit Handled
5
Inventory & Parts Management
Spare parts inventory for warehouse equipment is tracked in real time — linked to asset maintenance history, consumption rates, and reorder triggers. Critical spare stockouts — the event that turns a predictable repair into an unplanned 48-hour downtime — are eliminated. Stock accuracy, carrying cost, and parts spend per asset are all visible from one module.
Primary KPI Impact
Maintenance Inventory Accuracy
6
Quality Control & Inspection Management
Digital inspection checklists replace clipboard audits. Picking accuracy, damage rate, put-away accuracy, and receiving inspection results are captured at the point of activity and fed into quality dashboards automatically. Systematic issues — damage in a specific zone, accuracy problems with a specific picker, receiving defects from a specific vendor — are visible before they become returns and refund exposure.
Primary KPI Impact
Picking & Inventory Accuracy
7
Energy Monitoring
Energy is one of the fastest-growing cost lines in US warehouse operations — driven by refrigeration, HVAC, conveyor systems, and charging infrastructure. iFactory's energy monitoring module tracks consumption per asset, per zone, and per shift — identifying waste, flagging abnormal consumption as an early maintenance signal, and building the data foundation for sustainability reporting.
Primary KPI Impact
Energy Cost per Unit Handled
8
Vendor & Supplier Management
For US 3PLs and distribution centres managing maintenance contractors, parts suppliers, and equipment service vendors, iFactory's vendor management module tracks performance against SLA, cost against purchase order, and compliance against qualification requirements. Vendor accountability is documented — not assumed.
Primary KPI Impact
Vendor SLA Compliance Rate
iFactory AI · US Warehouse Operations
8 Modules. One Platform. Zero Integration Gaps.
See how iFactory connects predictive maintenance, OEE, throughput monitoring, and quality control into a single operations intelligence layer — built for US warehouse and delivery scale.
The 12 KPIs That Define US Warehouse Delivery Performance — And How iFactory Tracks Every One
KPI
Industry Benchmark (USA)
iFactory Module
What Gets Fixed
On-Time Shipping Rate
≥ 95%
Production Monitoring
Throughput alerts before despatch window is missed
Picking Accuracy Rate
≥ 99.5%
Quality Control
Zone & picker-level defect tracking
Inventory Record Accuracy
≥ 99%
Inspection Management
Real-time discrepancy alerts — no end-of-day surprises
Equipment OEE
65–85%
OEE Analytics
Asset-level availability, performance & quality split
Unplanned Downtime %
< 5%
Predictive Maintenance
Pre-failure detection + auto work order generation
Mean Time Between Failures (MTBF)
Asset-specific
Enterprise Asset Management
Full asset history + failure pattern analysis
Order Cycle Time
Site-specific SLA
Production Monitoring
End-to-end cycle time visibility from receipt to despatch
Labour Productivity (Units/Hour)
Process & category-specific
Shift Logbook + Team Management
Shift, zone, and individual productivity benchmarking
Cost per Unit Handled
Margin-dependent
Analytics Reporting
Labour + maintenance + energy cost per output unit
Dock-to-Stock Time
< 24 hours target
Production Monitoring
Receiving throughput tracking — bottleneck identification
Damage Rate
< 0.1%
Quality Control
Zone-level damage tracking with photo evidence capture
Energy Cost per Unit Shipped
Site & process-specific
Energy Monitoring
Per-asset & per-zone energy consumption tracking
How iFactory AI Predictive Analytics Works in a US Distribution Centre
The architecture that makes iFactory effective for US warehouse and delivery operations is not complicated in concept — but it requires an integration layer that most standalone CMMS and WMS tools do not provide. iFactory connects sensor data from PLC-instrumented equipment, IoT devices, and manual inspection inputs into a unified analytics engine. Book a demo to see the iFactory integration architecture for your specific facility type.
iFactory Data Flow — US Warehouse Operations
①
Data Ingestion
PLC sensors, IoT devices, RFID, barcode scans, and manual inputs from conveyors, dock equipment, forklifts, HVAC, and sortation systems feed into iFactory in real time via the PLC Sensor Integration layer.
→
②
AI Analytics Engine
Machine learning models process the incoming data stream — detecting degradation signatures, throughput anomalies, quality deviations, and energy waste patterns — comparing against baseline and historical performance.
→
③
Automated Work Orders
When the AI detects a maintenance signal, a work order is generated automatically — pre-populated with asset history, recommended action, required parts, and priority level. No manual intervention required between detection and despatch.
→
④
Operational Dashboards
Operations directors, shift supervisors, and maintenance managers each see a role-specific dashboard — not a generic data dump. KPIs are tracked against target. Alerts are surfaced in context, with recommended action, not just raw data.
→
⑤
SAP & ERP Integration
Work orders, quality records, inventory transactions, and energy data route to SAP or other ERP systems automatically — eliminating double-entry, ensuring reporting accuracy, and creating the audit trail that US compliance requirements demand.
US Warehouse Operations: The Specific Challenges iFactory Addresses
US distribution centres and fulfilment operations face a specific combination of pressure that is different from general manufacturing. High SKU variability, seasonal throughput peaks, last-mile SLA pressure, and a tight labour market create an environment where margin is made or lost at the operational level — not the strategic one. iFactory was built for exactly this environment.
Peak Season Equipment Stress
Q4 peak periods in US e-commerce and retail fulfilment push conveyor systems, dock equipment, and sortation to maximum utilisation — exactly when failure is most costly. iFactory's predictive maintenance identifies stress-driven degradation before peak begins, scheduling intervention during the pre-peak window when downtime is affordable.
Module: Predictive Maintenance + OEE Analytics
Multi-Shift Labour Accountability
US distribution centres running 2–3 shifts face a persistent problem: accountability gaps between shifts, where incidents, equipment issues, and throughput shortfalls are not properly communicated or documented. iFactory's digital Shift Logbook closes the accountability gap — every event is timestamped, attributed, and searchable across all shifts.
Module: Shift Logbook + Team Management
Spare Parts Stockout Risk
When a critical conveyor motor fails and the replacement bearing is out of stock, a 2-hour repair becomes a 48-hour downtime event waiting for emergency procurement. iFactory links asset maintenance history to spare parts consumption data, setting intelligent reorder triggers based on actual failure frequency — not arbitrary stock levels.
Module: Parts & Inventory + CMMS
Compliance & Safety Reporting
US warehouse operations are subject to OSHA, EPA, and state-level compliance requirements that demand documented evidence of maintenance activity, safety inspections, and incident reporting. iFactory's EHS Management and Incident Reporting modules create the compliance record automatically — from work order completion to inspection sign-off to incident log.
Module: EHS Management + Incident Reporting
Refrigerated & Cold Chain Facilities
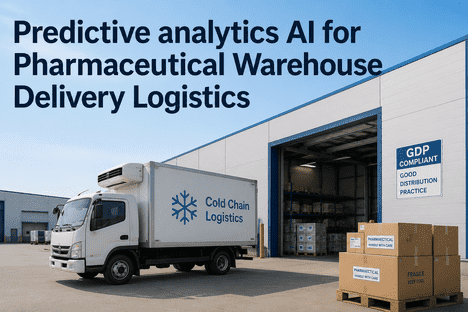
Grocery and pharmaceutical distribution centres in the US face an additional layer of equipment criticality — refrigeration system failure is both a quality and a compliance event. iFactory's energy monitoring and predictive maintenance modules are deployed specifically for refrigeration equipment, with temperature excursion alerting integrated directly into the work order system.
Module: Energy Monitoring + Predictive Maintenance
Multi-Site Analytics for 3PLs
Third-party logistics operators managing 5–50 US distribution centres need cross-site performance benchmarking — which sites are underperforming on OEE, which have the highest maintenance cost per unit handled, which are approaching equipment replacement thresholds. iFactory's cloud deployment delivers enterprise fleet analytics across all sites from a single operations command dashboard.
Module: Analytics Reporting + Enterprise Asset Management
Market Context: AI Analytics in US Warehouse & Delivery Operations by 2030
$19.3B
Projected AI-driven predictive maintenance market by 2032, growing at 39.5% CAGR
25%
Of US warehouse tasks projected to be automated — AI analytics is the intelligence layer
15–30%
Last-mile cost reduction achieved by operations deploying AI route optimisation and fulfilment analytics
99.5%+
Picking accuracy benchmark for world-class US fulfilment — achievable only with digital quality control tracking
FAQ: AI Analytics for US Warehouse & Delivery Operations
What is the difference between predictive maintenance and preventive maintenance in a US warehouse context?
Preventive maintenance is calendar-based — service the conveyor motor every 90 days regardless of actual condition. Predictive maintenance is condition-based — service the motor when sensor data indicates degradation is approaching the failure threshold. In a US warehouse where conveyor utilisation varies dramatically by shift and season, predictive maintenance prevents both over-servicing (wasted labour on assets that don't need attention) and under-servicing (missed intervention on assets running at peak stress). iFactory's predictive maintenance module replaces fixed PM schedules with AI-driven condition monitoring across all instrumented assets.
How does iFactory integrate with existing WMS and ERP systems in a US distribution centre?
iFactory connects to SAP, Oracle, and other major ERP platforms via standard API integration — routing work orders, quality records, inventory transactions, and maintenance data automatically between iFactory and the host system. For WMS integration, iFactory operates as the maintenance and asset intelligence layer alongside the WMS's fulfilment logic — the two systems share data rather than compete. SAP-specific integration is available out-of-the-box, covering PP, QM, PM, and MM modules.
Book a demo to see the integration architecture relevant to your current ERP environment.
What warehouse equipment does iFactory monitor for predictive maintenance in US facilities?
iFactory's predictive maintenance module supports monitoring of conveyors, dock levellers, dock doors, forklifts and material handling equipment, sortation systems, HVAC and refrigeration units, compressors, pumps, and any asset instrumented with PLC sensors or IoT devices. The PLC Sensor Integration layer connects to all major PLC brands used in US warehouse environments. Assets without existing sensor instrumentation can be connected via retrofit IoT devices — iFactory supports both approaches.
How does iFactory's Shift Logbook module improve accountability in multi-shift US warehouse operations?
iFactory's digital Shift Logbook replaces paper handover sheets and fragmented messaging with a structured, timestamped, searchable record of every shift event — equipment issues, throughput variances, quality incidents, near-misses, and maintenance actions. Outgoing shift supervisors complete a structured handover that incoming supervisors review and acknowledge digitally. Every entry is attributed to a named individual with a timestamp, creating the accountability record that paper logs cannot provide. Management can review shift performance trends across 30, 60, or 90 days without manual data aggregation.
Can iFactory be deployed on-premise for US warehouse operations with data sovereignty requirements?
Yes. iFactory supports both on-premise and cloud deployment models. On-premise deployment keeps all operational data, maintenance records, and quality data within the facility's own network infrastructure — meeting data sovereignty requirements for government-contracted 3PLs, pharmaceutical distribution, and defence supply chain operations. Cloud deployment is available for multi-site 3PL operators who require cross-facility analytics and centralised reporting without on-premise infrastructure investment at each site.
What ROI can a US distribution centre expect from deploying iFactory AI analytics?
The primary ROI drivers are unplanned downtime reduction, maintenance labour optimisation, and energy cost reduction. Facilities deploying iFactory's predictive maintenance typically reduce unplanned downtime by 25–40% within the first 12 months. Maintenance labour cost reductions of 15–20% are common as work is allocated to actual need rather than calendar schedule. Energy monitoring typically identifies 8–15% consumption reduction opportunities within the first quarter of deployment. For a mid-scale US distribution centre spending $2M annually on maintenance and $800K on energy, these reductions represent a six-figure annual saving at conservative estimate.
iFactory AI · US Warehouse & Delivery Operations
From Reactive Maintenance to Predictive Intelligence.
Protect Your Margins. Deliver Every SLA.
iFactory AI gives US warehouse and delivery operations the predictive analytics, asset intelligence, and operational visibility to eliminate unplanned downtime, hit fulfilment KPIs, and scale without proportional cost growth — on-premise or cloud.
Predictive Maintenance
OEE Analytics
Shift Logbook
Quality Control
Energy Monitoring
SAP Integration
On-Premise & Cloud