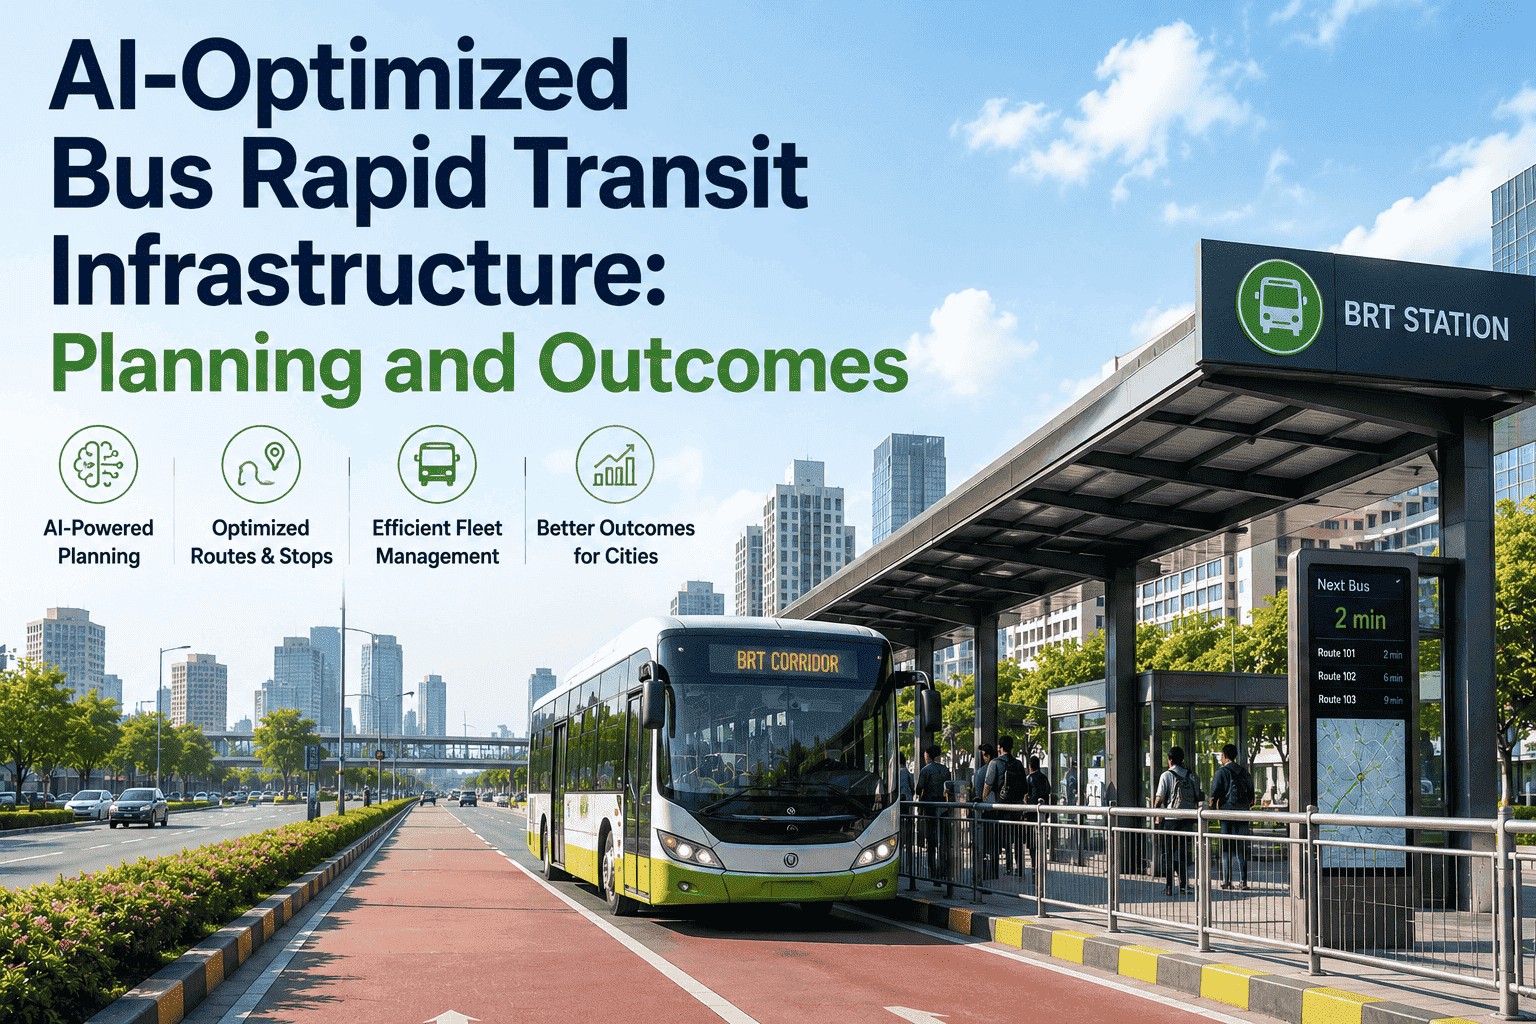
AI-Optimized Bus Rapid Transit Infrastructure: Planning and Outcomes
By Grace on May 27, 2026
When Curitiba opened its first Bus Rapid Transit corridor in 1974, it created a category of transit infrastructure that delivers rail-scale capacity for a fraction of rail's cost — and decades later, the BRT design problem still defaults to spreadsheets, traffic studies, and committee judgment. The result is the pattern that shows up in city after city: corridors that perform brilliantly in theory and disappoint operationally because route placement, stop spacing, headway, and fleet sizing were all optimized separately rather than together. Bogotá's TransMilenio carries 45,000 passengers per hour per direction — a throughput rare even for metro rail — but cities that copied the surface design without copying the systems planning rigor underneath got crowded platforms, bunching buses, and ridership well below projection. AI changes the design equation. Modern simulation platforms run thousands of route-and-stop scenarios, model passenger flows from real smart-card data, optimize headway against demand patterns, and reveal trade-offs in 48 hours that previously took 12 months of consultant studies. Published optimization research shows generalized passenger cost dropping by roughly 22.5% versus the actual operating case when AI joint-optimizes headway and stop count. Autonomous BRT eco-driving research reports 97-98% of theoretical energy-saving potential captured by AI-scheduled vehicles. iFactory's BRT planning and operations platform brings the simulation, optimization, and live operational intelligence into one stack — so the corridor is designed for the demand it will actually carry, not the demand a 2018 spreadsheet predicted.
Design the BRT for the City You Actually Have, Not the One the Spreadsheet Predicts.
iFactory turns BRT planning into a simulation problem — using AI to test thousands of route, stop, and fleet scenarios against real passenger demand before the first concrete pour.
Passengers per hour per direction on Bogotá's TransMilenio — rare even for metro rail
22.5%
Reduction in generalized passenger cost when AI joint-optimizes headway and stop count
20–26
km/h average BRT corridor speed (versus 10–14 km/h for regular bus traffic)
1–5
Years from concept to operation — at roughly 1/10th the per-km cost of metro rail
The Five BRT Design Decisions That Make or Break the Corridor
Every BRT system stands or falls on five linked decisions. Get one wrong and the others can't compensate. The defining feature of AI-optimized BRT planning is that all five are evaluated jointly rather than sequentially — because they trade against each other in ways that pen-and-paper planning consistently misses.
DECISION
01
Route Alignment & Right-of-Way
Median busway, curbside lane, or mixed traffic — the alignment choice determines the achievable speed, the capital cost, and the political conversation with adjacent businesses for the next thirty years.
Speed Driver
DECISION
02
Stop Placement & Spacing
Stops too close together (400 ft) wreck the speed advantage. Too far apart (4,000 ft) wreck the walkshed. Bogotá and Curitiba converge near 1,200–1,400 ft — but the optimum is demand-specific, not universal.
Access Driver
DECISION
03
Headway & Service Frequency
The 2-minute peak-hour interval that defines world-class BRT is the AI-optimization sweet spot. Too long and ridership drops; too short and operating cost compounds with little additional rider benefit.
Cost Driver
DECISION
04
Station Design & Boarding Strategy
Off-board fare collection, level boarding, multiple loading zones, passing capability — these turn 25-second dwell times into 15-second dwell times, which compounds into thousands of passenger-hours saved per day at full corridor demand.
Throughput Driver
DECISION
05
Fleet Sizing & Service Mix
All-stop, limited-stop, and express services on the same corridor — modeled together, sized together. The ratio between vehicle types is the single largest determinant of operating cost relative to passenger-trip throughput.
Capacity Driver
How AI Simulation Changes BRT Planning
Traditional BRT planning relies on linear analysis: produce a route map, hand-calc demand, estimate headway, size the fleet, submit for approval. AI-driven planning runs the same five decisions as one joint optimization problem, with thousands of scenarios tested in parallel against real demand data. The difference shows up at every stage of the process.
Traditional BRT Planning
Sequential decisions, isolated analysis
Route locked in before headway is studied; stop placement set before fleet sizing.
12-month consultant studies
Each "what if" question is a separate engagement and a separate invoice.
Demand based on aggregate counts
Origin-destination matrices built from surveys, not from observed travel data.
Static assumptions for 20-year horizon
Predictions get baked in early and rarely revisited as the city changes.
AI-Driven BRT Planning
Joint optimization across all five decisions
Route, stop, headway, station, and fleet evaluated as one model.
Thousands of scenarios in 48 hours
Genetic algorithms and particle swarm methods explore the design space.
Demand from smart-card and mobile data
Actual origin-destination flows at 15-minute resolution.
Live re-optimization as the city evolves
Headway and service mix adjusted on observed demand, not on the 2018 forecast.
Corridor Simulation · Demand Modeling · Service Mix Optimization
See Your Proposed BRT Corridor Modeled Against Real Demand Before Construction Begins
iFactory ingests your transit smart-card data, OD matrices, and roadway network and produces a fully simulated corridor with optimized stop, headway, and fleet recommendations.
Four cities provide the operating data that defines what world-class BRT looks like. Their differences also reveal where AI optimization adds the most value — usually in matching the design intensity to the actual demand profile.
Curitiba, Brazil — 1974
The Original BRT Blueprint
Avg Speed
21 km/h
Stop Spacing
~1,400 ft
Established the structural axis concept — strong land-use controls along BRT corridors that compound the system's value through transit-oriented development.
Bogotá, Colombia — 2000
TransMilenio — Highest Throughput
Peak PPHPD
45,000
Avg Speed
26 km/h
Center-island platforms, overtaking lanes, and mixed express/all-stop services push throughput beyond what most metro rail lines deliver — at a fraction of metro infrastructure cost.
Guangzhou, China — 2010
Highest-Capacity BRT in Asia
Daily Riders
843K
Peak PPHPD
~29,900
Demonstrated that BRT can serve Asian-scale demand profiles. Shared-use lanes and multiple-route corridors create planning complexity AI optimization handles particularly well.
Brisbane, Australia
South East Busway — High-Quality Standard
Peak Hour Riders
9,500
Capacity Est.
11,000/hr
Proves BRT works in developed-country settings — and provides the smart-card data foundation that Brisbane researchers have used to validate agent-based station simulation models.
“
The mistake every BRT failure shares is the same: the engineers designed for the demand the political process wanted to talk about, not the demand the corridor would actually serve. The 9 AM count of office workers and the 9 PM count of restaurant staff are two different transit systems, and the corridor has to serve both. AI simulation forced us to look at the whole 24-hour demand curve and stop optimizing for the photograph of the peak. The corridor that emerged from that simulation was nothing like the corridor on the original master plan — and it has carried 30% more daily riders.
— Chief Planning Officer, Metropolitan Transit Authority — 22 Years — APTA Honorary Member, ITDP Advisory Council
From Plan to Operations: Where AI Lives in the Running BRT
Designing the corridor is one half of the value. The other half is running it well day after day — and that's where AI delivers its operational dividend across three distinct functions that compound the planning investment over time.
Operational Function 01
Anti-Bunching Headway Control
Real-time vehicle telemetry combined with AI dispatching keeps spacing even between buses. Bunching — the single most visible BRT failure mode — gets corrected automatically before passengers see it.
Operational Function 02
Predictive Maintenance for Fleet
Sensor data from each bus feeds ML models that forecast component failures days before they would strand a vehicle on the corridor. Maintenance becomes planned interventions, not emergency dispatches.
Operational Function 03
Eco-Driving & Energy Optimization
AI-scheduled cooperative vehicle control aligns acceleration, deceleration, and stops with traffic signal phasing. Published research reports 97–98% of theoretical energy savings captured.
The BRT Comparison Table: Where AI Optimization Moves the Needle
The point of AI in BRT isn't a marketing claim about "smarter planning." It's specific, measurable improvements in the same metrics that BRT consultants have been benchmarking for forty years.
BRT Metric
Traditional Planning
AI-Optimized Planning
Design Cycle Time
12–18 months of sequential studies
Days to weeks; thousands of scenarios in parallel
Generalized Passenger Cost
Baseline operating case
~22.5% reduction in published joint-optimization studies
Demand Input Resolution
Survey-based OD matrices, peak hour only
Smart-card and mobile data at 15-minute resolution
Service Mix Optimization
All-stop default; limited-stop added later
Integrated all-stop, limited-stop, and short-turn timetable
Energy & Operating Cost
Conventional driving profiles
97–98% of theoretical energy savings via eco-driving control
Re-Optimization Frequency
Major review every 5–10 years
Continuous; service mix adjusts to observed demand monthly
Conclusion
Forty years of BRT operations have shown that the difference between a corridor that transforms a city and a corridor that disappoints the projections sits in the planning rigor more than in the concrete poured. The five linked decisions — alignment, stop spacing, headway, station design, fleet mix — interact in ways that pen-and-paper planning consistently flattens into compromises. AI simulation and optimization restore the joint analysis that the design problem actually requires. Cities that deploy it before construction get corridors that perform; cities that deploy it after construction get operating systems that keep optimizing themselves as demand evolves. Either way, BRT becomes the high-throughput, low-cost transit infrastructure it was always capable of being.
iFactory's platform brings AI simulation, joint optimization, operational dispatch, and predictive maintenance into one stack — designed for transit authorities planning their next corridor or optimizing the one already in service. Book a Demo to see your corridor modeled against real demand.
Frequently Asked Questions
Three categories: demand data (smart-card transactions, mobile phone-based OD inference, ridership counts), network data (roadway geometry, signal phasing, existing transit routes, land use), and operational data where the corridor exists (GPS-AVL vehicle traces, headway logs, maintenance records). For a greenfield corridor, the demand-side data is the critical input — and smart-card data from feeder bus routes plus mobile-derived OD inference is usually sufficient to seed the simulation.
Both, and existing corridors often see faster ROI. The physical infrastructure is fixed, but stop usage, headway, service mix, and fleet sizing can all be re-optimized against current demand. Many corridors built a decade or more ago run on assumptions about ridership that no longer match reality — adjusting service mix and headway based on current smart-card data routinely produces 10–20% efficiency gains without any capital spend.
It's the corridor-specific question AI optimization handles best, because the answer changes by demand pattern. Corridors with strong OD concentration (commuters from suburb to downtown) benefit most from limited-stop and express overlays. Corridors with distributed demand serve best with all-stop. The joint optimization solves for the mix that minimizes total generalized passenger cost — which usually lands at a ratio neither the planning consultant nor the agency would have guessed.
iFactory connects to common transit data systems via standard APIs: GTFS and GTFS-Realtime for schedule and live vehicle data, smart-card AFC systems (Cubic, Indra, Conduent, INIT, ACS), CAD/AVL platforms (Trapeze, Init, Clever Devices), and signal control systems through standard NTCIP interfaces. Planning outputs are exported in formats your modeling team already uses (VISUM, EMME, Aimsun). The platform layers on top of your existing stack rather than replacing it. Book a Demo for an integration map specific to your environment.
BRT delivers rail-scale ridership at a fraction of rail cost — when the planning matches the ambition.
iFactory brings AI simulation, joint optimization, and live operational intelligence into one platform — built for the transit authorities designing the next corridor and running the ones already on the street.