From Reactive to Predictive: Smart City Infrastructure Management Maturity Model
By Grace on May 27, 2026
On May 12, 2021, a routine inspection found a fracture in a critical load-bearing member of the I-40 bridge in Memphis. The bridge closed within hours. Tens of thousands of vehicles per day were rerouted. River traffic on the Mississippi stopped. Engineers had no continuous data on what the structure was doing during emergency repairs — so they had to rush-deploy 44 wireless strain sensors and two gateways just to see what was happening. That bridge is the photograph of reactive infrastructure management. A crack appeared, an inspector found it (luckily), and then the city scrambled to install the monitoring that should have been there for years. Every infrastructure organization can tell a version of this story — the burst water main on a Sunday morning, the substation that failed during the heatwave, the road that collapsed after the storm that no one anticipated. The cost shows up in emergency budgets, in overtime, in public trust, and sometimes in lives. The path from reactive scrambling to predictive operations isn't a software purchase. It's a transformation across data, process, and culture — and the cities making the journey are reporting traffic congestion down 30%, emergency response improved by 40%, and unplanned infrastructure failures reduced by as much as 79% compared to their pre-transformation baseline. iFactory's platform is designed for the actual transformation — not the destination brochure. It meets cities where they are today and delivers the data, alerts, and decisions that make the next phase achievable.
Stop Reacting to Failures. Start Forecasting Them.
iFactory shifts city infrastructure operations from emergency firefighting to data-driven prediction — with measurable improvements visible inside the first deployment quarter.
Seven Warning Signs Your Operation Is Still Stuck in Reactive Mode
Most organizations don't realize how reactive they are until they see the signs listed against their own week. If three or more of these feel familiar, the operating mode is reactive — regardless of what the strategy document on the shelf says.
01
"Again?" is a common reaction to alerts
The same trouble-making assets keep generating the same work orders. Recurring failures signal that nobody is treating the underlying cause — just the visible symptom.
02
Emergency repairs dominate the budget
Routine deviations from Not-to-Exceed limits, frequent emergency purchase orders, and ballooning overtime indicate the team is spending its days fighting fires instead of preventing them.
03
Work orders are still typed by hand
If creating a work order requires a person manually entering details a sensor already knows, the system has not crossed the threshold from documentation tool to operational platform.
04
First-time fix rate is unknown or low
When crews arrive on-site without the right diagnosis, the right parts, or the right capability and have to come back — the loss isn't one call-out, it's two.
05
Backlog grows faster than it clears
A persistent work-order backlog means crews are running behind because of emergencies, not staying ahead through planned work. The backlog is the symptom; reactive operations is the disease.
06
Capital planning is squeaky-wheel driven
If next year's CIP is shaped more by which department complained loudest than by which assets are forecasted to fail soonest, the budget is being set by politics, not by data.
07
Audit findings repeat year over year
If the same compliance gap appears in three consecutive audits, the operating model isn't fixing the root cause. It's responding to each audit the way it responds to failures — after the fact.
Self-Check
How many warning signs did your team check?
Three or more is the threshold where the operating mode is reactive — and where intervention has the biggest payoff.
The Before / After Picture: What Changes When Cities Make the Shift
The transformation is measurable. Published case studies and field deployments consistently show the same pattern across the operational metrics that finance, operations, and political leadership all care about.
Before — Reactive Operations
Maintenance cost runs 3–5× higher than planned baseline
Run-to-failure cycles always cost more than catching the issue early.
Failure events arrive unannounced
The first sign of trouble is the work order, the complaint, or the news report.
Decisions made on data months out of date
The last inspection was 24 months ago. The asset has had a full season since.
Public trust erodes incident by incident
Every visible failure is a story about why the city wasn't ready.
After — Predictive Operations
Up to 79% reduction in unplanned infrastructure failures
AI detects degradation patterns long before they cross failure thresholds.
40% improvement in emergency response time
Real-time integration with dispatch and traffic systems compresses every phase.
25–30% lower lifecycle maintenance cost
Right-time action, not over- or under-maintenance.
Capital decisions defended by data, not anecdote
Risk-cost models replace squeaky-wheel prioritization at budget time.
The Transformation Stack: What Actually Has to Change
A reactive-to-predictive shift is not a technology purchase. It's a three-layer transformation where each layer depends on the one below it. Skip a layer and the program stalls — usually after the platform is bought but before it produces results.
Layer Three
Decision Layer
Culture & Authority
People trust the data enough to act on it without a meeting. Budget committees defend decisions with risk-cost models. Field crews dispatch on forecasts, not just incidents. This is where the program either succeeds or quietly reverts to reactive habits.
Layer Two
Process Layer
Workflow & Integration
Sensor alerts flow automatically into work-order systems. Predictive insights trigger dispatch without human re-keying. The first-time fix rate becomes measurable because the system feeds the crew the diagnosis before they arrive on site.
Layer One
Data Layer
Asset Registry & Sensors
A complete, geolocated asset registry with unique IDs. IoT and condition sensors on critical assets. Historical performance data captured in a structured form. Nothing above this layer works without this foundation — every transformation that fails, fails here first.
Diagnostic Workshop · Tailored Roadmap · Pilot to Production
See How Your Operation Scores on the Reactive-to-Predictive Spectrum
iFactory runs a diagnostic workshop with your operations team — surfacing where time and budget are being lost, and mapping the highest-ROI starting points for transformation.
The I-40 Bridge Lesson: Why Reactive Monitoring Costs More Than Predictive
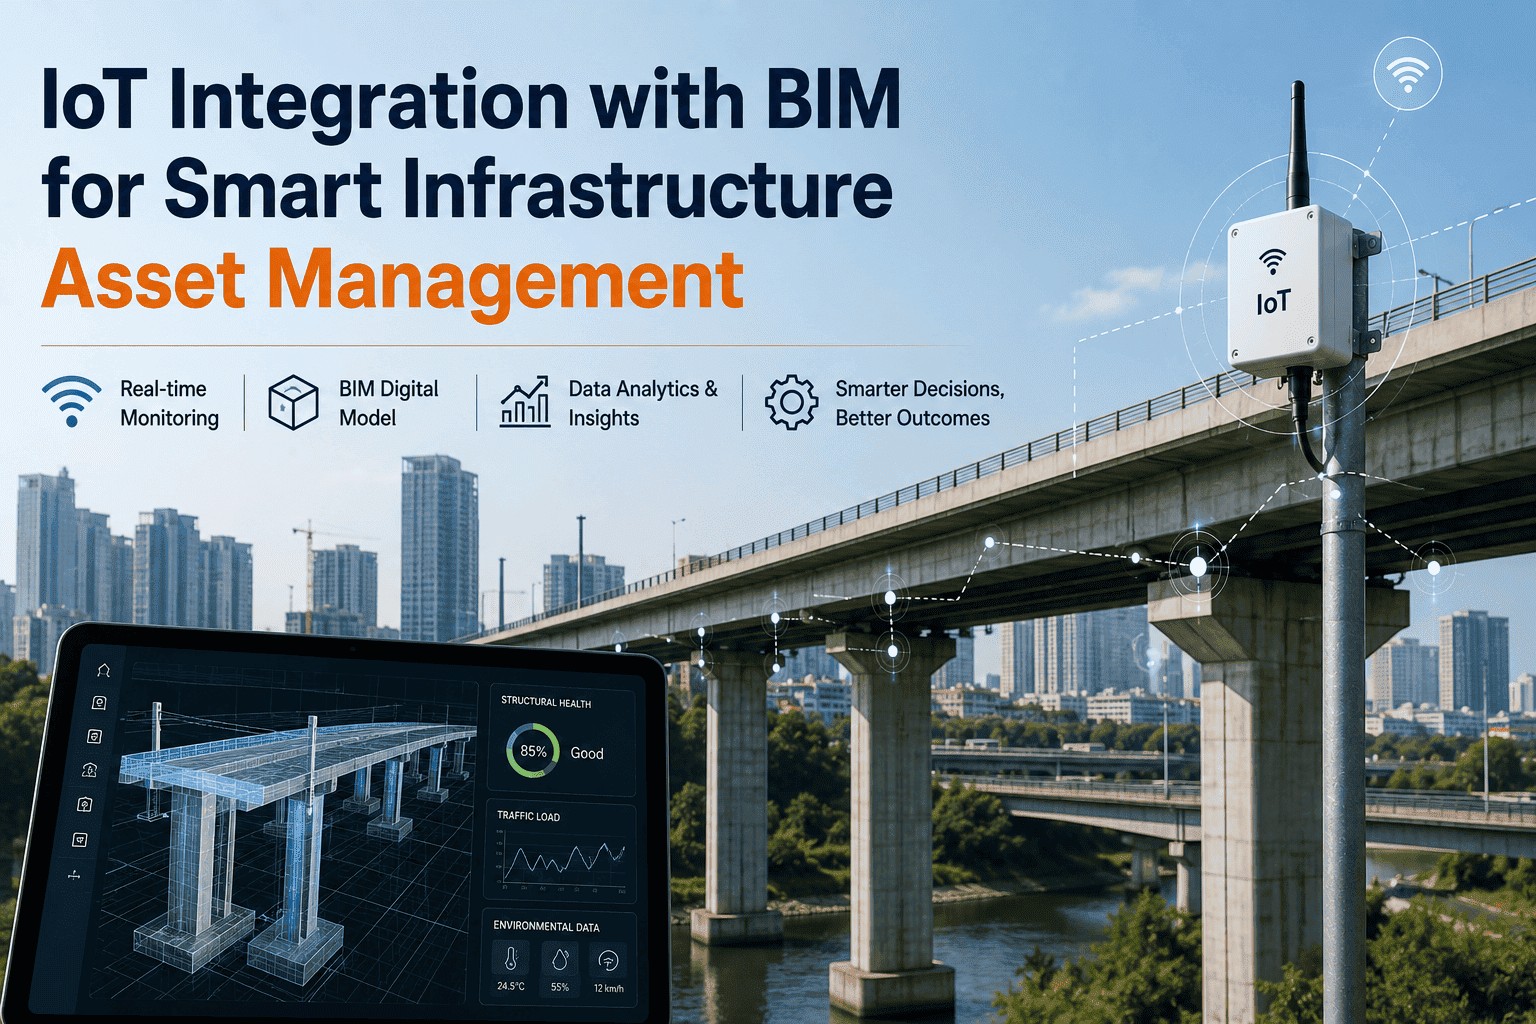
In May 2021, a critical crack was discovered on the I-40 bridge connecting Memphis and Arkansas. The bridge closed immediately. To assess the structure during emergency repairs, Resensys deployed 44 wireless strain gauges and two gateways within 24 hours — the kind of monitoring program that should have been in place for years. The bridge re-opened months later. The economic loss from the closure ran into the hundreds of millions.
The Math of Prevention
A single avoided closure pays for years of continuous monitoring
Reactive Approach
Inspect once every 24 months. Detect cracks only after they're large enough for visual identification. Deploy emergency monitoring when the worst has already happened.
Predictive Approach
Continuous strain monitoring on critical members. AI flags trending anomalies weeks before threshold breach. Planned interventions instead of emergency closures.
Cost Difference
One avoided emergency closure of a major asset typically exceeds the total cost of decades of continuous monitoring. The economics aren't close.
What Cities Report After the Transformation
Published case studies across smart-city programs consistently report the same outcome categories. The specific numbers vary by city size, sector focus, and starting maturity — but the pattern is reliable enough to make ROI projections that finance can defend.
30%
Reduction in traffic congestion through AI-managed signal optimization
40%
Improvement in emergency response time across integrated city pilots
25%
Energy savings from intelligent grid operations during peak demand
79%
Reduction in unplanned infrastructure failures reported by AI predictive maintenance programs
“
The way I tell my team to spot reactive operations: count how many times the operations meeting becomes a status report on what already broke this week. If it's most of the meeting, you're reactive — no matter what the technology vendor's slide deck called you. The shift is when the meeting starts being about what the data shows might break next month, and whether we want to act on it. That's the entire transformation in one sentence: changing what the meeting is about.
— Public Works Commissioner, Mid-Atlantic Region — 28 Years — APA AICP, NACWA, Smart Cities Council Advisory Board
Three Pilots That Make the Whole Program Possible
The biggest mistake in reactive-to-predictive transformation is trying to do everything at once. The successful pattern is the opposite: pick one high-visibility asset category, deliver a measurable result in 90 days, and use that result to fund the next pilot. Three pilot patterns consistently win the funding fight.
Pilot Type A
Critical Asset Monitoring
Pick the single most consequential asset — the bridge, the substation, the trunk main — and instrument it fully. One avoided failure pays for the entire program, and the political optics of monitoring a high-profile asset accelerate funding.
Pilot Type B
Single-Sector Sensor Network
Pick one sector — stormwater, traffic signals, HVAC across municipal buildings — and deploy a complete sensor network with closed-loop alerting. Demonstrates the full predictive stack on a manageable scope before expansion.
Pilot Type C
High-Cost-Per-Incident Class
Pick the asset class with the highest cost per incident — typically water mains in older districts or substations in dense commercial areas — where preventing two or three incidents per year exceeds the entire program cost.
Conclusion
Reactive operations always cost more than they appear to. The maintenance budget hides the real number; the loss is in the assets that fail early, the public trust that erodes with every visible incident, and the capital that flows to the loudest department instead of the most critical asset. The shift to predictive operations is not a software project — it's a change in what the data reveals, what the process automates, and what the team decides to act on. The cities making the shift report measurable outcomes across cost, reliability, response time, and trust. The cities still operating reactively report the I-40 story, in their own version, over and over.
iFactory's platform is built for the actual transformation — it operates productively at the reactive end of the spectrum and grows with the program as the team builds toward predictive operations. Book a Demo to walk through the warning-sign diagnostic and see the platform configured for the asset class that would be your strongest pilot.
Frequently Asked Questions
Initial ROI shows up in the first 90 days when the pilot is scoped tightly: a single critical asset, a single sector, or a single high-cost-per-incident class. The full balanced-scorecard improvement (cost reduction, planned-to-reactive ratio, response time, audit findings closed) typically materializes between months 6 and 18, depending on the size of the asset portfolio. Programs that try to transform everything at once consistently take longer to show ROI than programs that pilot, prove, and scale.
Buying the platform before fixing the data foundation. Predictive models built on incomplete asset registers, sparse condition data, or siloed sensor feeds produce recommendations the operations team doesn't trust — and recommendations the team doesn't trust become recommendations the team doesn't act on. The program reverts to reactive habits with new software in the background. The fix is data-first deployment: complete the registry, deploy sensors on critical assets, and only then activate the predictive layer.
No. The transformation works precisely because it layers onto existing systems rather than replacing them. iFactory integrates with established platforms — IBM Maximo, Cityworks, SAP PM, Bentley AssetWise, Infor EAM — and with SCADA historians via OPC-UA, MQTT, BACnet, and Modbus. Your team continues to work in the systems they know. The platform adds the predictive insight layer on top, feeding enriched work orders and recommendations into the existing workflow.
Trust is built by transparency, not by accuracy claims. The platform shows the underlying sensor data, the trend the AI is reading, and the historical pattern that informs the recommendation — so the engineer can verify the reasoning before acting. After three to six months of recommendations that the team can audit and validate, trust transitions from skepticism to operational reliance. Recommendations also stay subordinate to engineering judgment by design: the AI surfaces the call, the engineer makes the decision. Book a Demo to see the transparency model in operation.
Reactive infrastructure isn't a strategy. It's a story your city keeps having to explain.
iFactory turns that story into a different one — measured in failures avoided, response times improved, and budgets defended by data. Built for the actual transformation, not the brochure version.