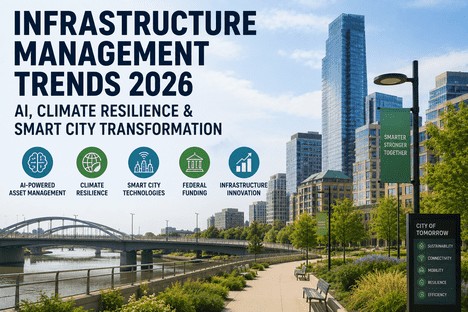
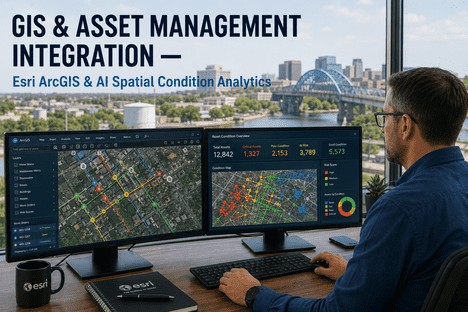
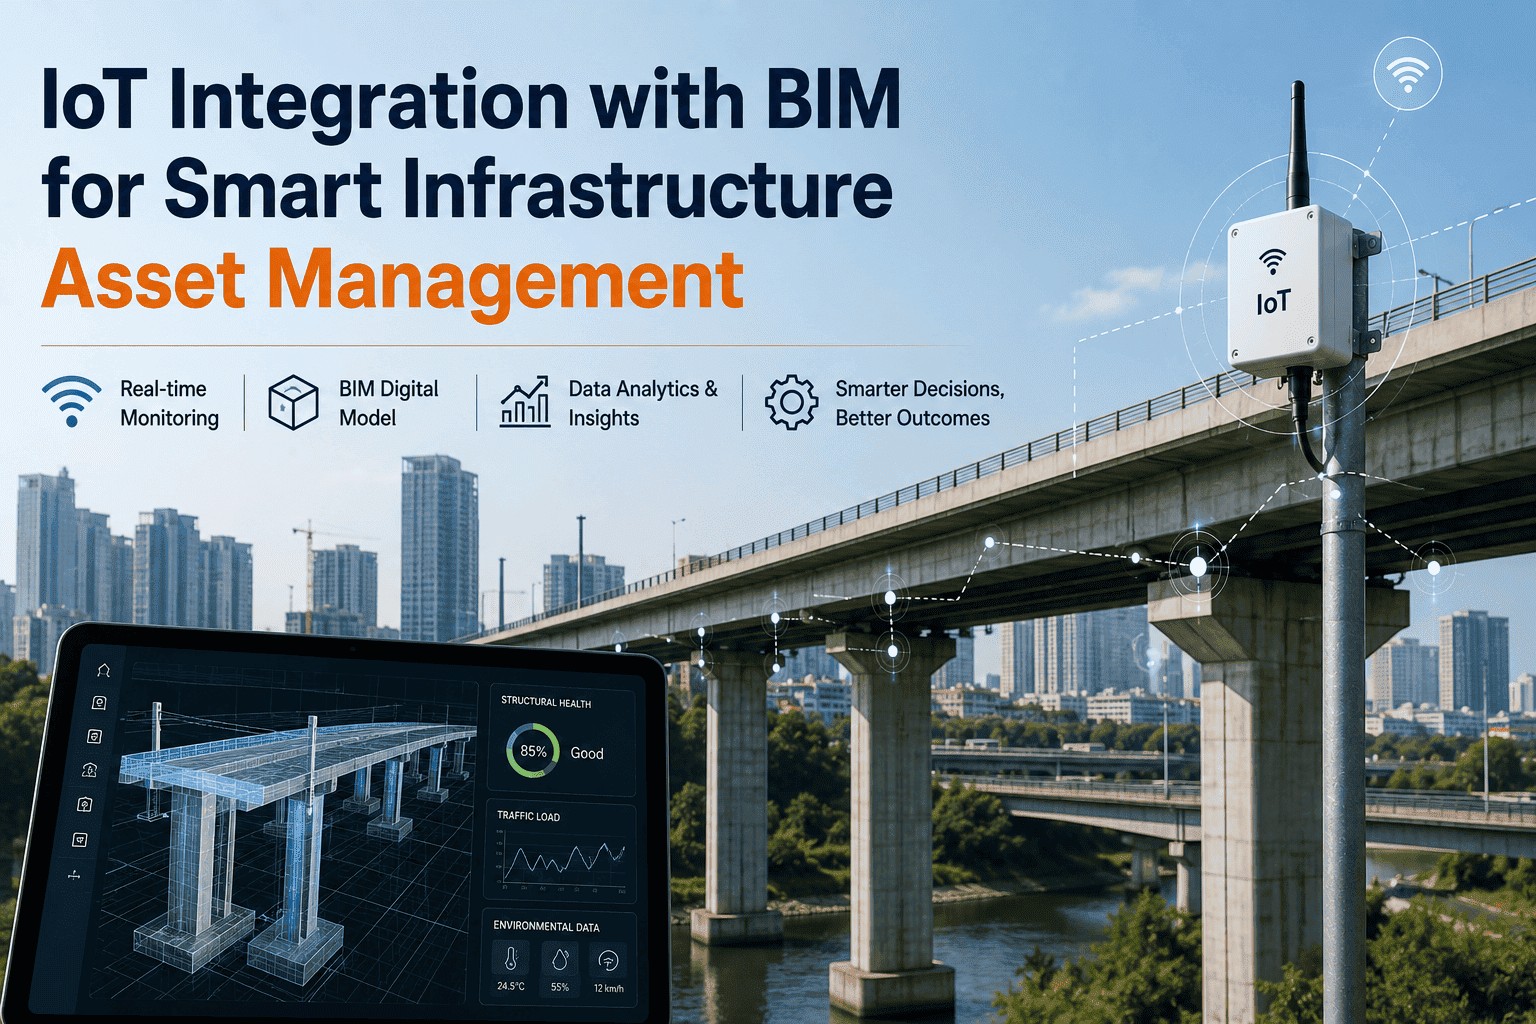
The global smart city market reached $952 billion in 2025 and is projected to surpass $6.3 trillion by 2034. More than 1,000 cities now operate active smart city programmes, and IoT-connected devices across urban environments exceed 2.5 billion units. Yet most city governments still manage infrastructure assets the same way they did twenty years ago: department by department, spreadsheet by spreadsheet, with inspection data trapped in PDFs, maintenance history scattered across legacy CMMS instances, and geospatial information locked inside GIS systems that do not talk to the work order platform. The gap between the sensors already deployed and the decisions those sensors should inform is not a technology gap — it is an integration gap. Building Information Modelling, Geographic Information Systems, IoT telemetry, robot inspection feeds, and asset management platforms each produce valuable data, but their value multiplies only when connected into a unified urban digital twin. This is the technical guide to how urban infrastructure asset management with BIM, GIS, and robot data integration is being implemented by leading cities today — connecting sensor networks, robotic inspection fleets, digital twins, and CMMS platforms into a single intelligence layer for city governments managing assets at scale.
Six Layers That Convert Raw Sensor Data into Coordinated Maintenance Action
City infrastructure generates data across multiple domains — roads, water, structures, public spaces, buildings, and utilities. Each layer in the intelligence stack processes and enriches that data, moving it from raw telemetry to actionable work orders that cross departmental boundaries.
Seven Urban Infrastructure Categories That Benefit From BIM-GIS-Robot Integration
Each domain generates inspection and monitoring data from different sources — robotic pipe crawlers in water mains, drones on bridge structures, LiDAR on road surfaces, IoT sensors in buildings. The integration challenge is connecting them all into a single digital twin that cross-references condition data across adjacent assets.
How Leading Cities Are Integrating BIM, GIS, and IoT Into Operational Digital Twins
The following programmes represent operational city-scale deployments of integrated BIM-GIS-IoT platforms — delivering measurable improvements in planning efficiency, maintenance coordination, and infrastructure investment outcomes.
How BIM, GIS, Robot Data, and CMMS Connect in a Unified Urban Asset Platform
The integration challenge is not about replacing existing systems — it is about connecting them through a standardised data layer that preserves each department's investment while adding cross-asset intelligence. The architecture below shows how iFactory connects the data domains that cities already operate.
What City Governments Ask About BIM-GIS-Robot Integration
How does BIM-GIS integration differ from keeping these systems separate?▼
BIM provides sub-centimetre-accurate 3D geometry and rich semantic attributes for individual assets — pipe diameters, material specifications, installation dates, manufacturer data, maintenance intervals. GIS provides geospatial context — parcel boundaries, utility network topology, environmental constraints, zoning regulations, and city-wide spatial relationships. When kept separate, BIM models exist as isolated files that engineers open in desktop software, while GIS layers remain in web maps that asset managers use for network planning. Integration connects these worlds: a BIM-modelled pump station becomes a clickable asset within the city's GIS, displaying real-time SCADA telemetry alongside its IFC semantic properties, nested inside the ArcGIS Utility Network that shows upstream and downstream connectivity. The M-30 Madrid ring road BIM-GIS integration demonstrated that this unified approach enables direct linkage between 3D geometric models and maintenance management systems — reducing the time to locate and diagnose infrastructure faults from hours to minutes.
What is the practical ROI for a city deploying a unified infrastructure asset management platform?▼
ROI materialises across four measurable categories. Operational efficiency: eliminating duplicate inspections across departments saves 15-25% of field staff time. A single water department inspector and a roads department inspector may visit the same corridor independently — a unified platform cross-references their findings and enables combined deployment. Emergency prevention: cross-system correlation identifies compound failure signals. A water pressure anomaly plus pavement deflection plus electrical ground fault at the same intersection predicts a pipe rupture weeks in advance. Preventing a single water main failure saves $200,000-$500,000. Extended asset life: predictive maintenance driven by continuous condition monitoring extends infrastructure service life by 20-35% compared to fix-on-fail approaches. Planning efficiency: Nottingham's digital twin delivered a 2:1 ROI ratio — every pound invested returned two pounds in efficiency savings. For a city of 100,000-500,000 population, annual savings typically range from $2 million to $6 million against a platform investment of $200,000-$400,000, yielding an 8-15x return.
How does iFactory integrate with existing city systems like ArcGIS, Maximo, and SCADA?▼
iFactory provides the middleware integration layer that connects existing city systems without requiring rip-and-replace. For GIS integration, iFactory ingests data from ArcGIS Enterprise, ArcGIS Online, and CityGML exports via REST APIs and web services — preserving all existing geospatial investments while adding real-time data overlay and cross-department correlation. For asset management, iFactory connects with IBM Maximo, SAP PM, IFS, and other CMMS platforms through standard APIs and web service connectors — auto-generating work orders from defect detection events with full context from BIM, GIS, and IoT sources. For SCADA and IoT, the platform accepts telemetry via MQTT, OPC-UA, Modbus, and BACnet protocols, processing data at the edge where needed for latency-sensitive alerts. For robotic systems, iFactory ingests inspection data from any robot vendor through MQTT streams or API connections — treating robots as both data sources and maintainable assets. The integration timeline for an existing city with deployed ArcGIS, Maximo, and SCADA systems is typically 30-60 days for initial connectivity, with full cross-asset correlation workflows operational within 90 days.
What data standards govern BIM-GIS integration for city infrastructure?▼
Three primary standards govern urban infrastructure asset data integration. Industry Foundation Classes (IFC 4.3) is the open BIM standard for infrastructure assets — extending the building-focused IFC schema to include roads, bridges, railways, ports, and utilities. IFC 4.3 enables consistent semantic modelling across asset types and is mandated by the upcoming EU BIM directive and Finland's new Building Act (2026). CityGML (3.0 and 2.0) is the OGC standard for 3D city models — defining Levels of Detail from LoD0 (regional) to LoD4 (interior). CityGML Application Domain Extensions (ADE) allow custom schemas for infrastructure elements such as bridges, tunnels, and utility networks. The ITU-T Y.4611 standard (published November 2025) defines requirements and a data model for data collected from city infrastructure — including sensing data, networking data, device control data, processing data, and linkage management data across energy, water, transportation, and environment domains. iFactory conforms to all three standards, ensuring that data flowing through the integration layer is interoperable with existing city systems and future-proof against evolving regulatory requirements.
What is the recommended deployment approach for a city starting this integration journey?▼
The most successful city deployments follow a phased approach that delivers measurable ROI from each phase before the next begins. Phase 1 (weeks 1-4): inventory existing data systems — which departments use which GIS platform, which assets have BIM models, which IoT networks are active, which CMMS instances are in operation. Identify 2-3 high-value integration points that span departments — for example, connecting water SCADA alerts with road inspection data in a corridor that has experienced repeat utility cuts. Phase 2 (weeks 4-12): deploy the iFactory middleware to connect the selected systems, establish cross-asset correlation rules, and build the first unified dashboard. Phase 3 (months 3-6): add robotic inspection data feeds — autonomous sweeper telemetry, drone inspection outputs, quadruped patrol logs — and connect them to the correlation engine. Phase 4 (months 6-12): expand to the full municipal asset portfolio, add digital twin visualisation, and deploy role-based dashboards for each department. This phased approach ensures that early wins document ROI for subsequent budget approvals. Helsinki started with 2D footprint comparison and now operates fully automated nightly 3D updates. Nottingham started with a single city centre renewal project and now covers 73 square kilometres.