A city managing 12,000 miles of water mains, 4,500 bridges, and 38,000 streetlight assets across a metropolitan region does not have a data problem. It has a location problem. The data exists — in spreadsheets, CMMS databases, CAD drawings, and inspection reports — but it is scattered across systems that do not talk to one another and cannot be visualised together. When an asset manager needs to know the condition of every culvert in a watershed, the maintenance history of every pump station, and the risk score of every bridge on a single corridor, the answer should be one map, not five reports from five departments compiled over three days. The global GIS market is projected to reach USD 25.5 billion by 2034, growing at a CAGR of 15.8%, and the convergence of GIS with asset management through platforms like Esri ArcGIS and AI-powered spatial analytics is the single most impactful infrastructure management trend of this decade. iFactory's spatial condition analytics module is built to deliver exactly this convergence.
Stop Searching Through Five Systems for Answers You Should See on One Map. iFactory Connects GIS, Asset Condition, and AI Analytics in a Single Spatial View.
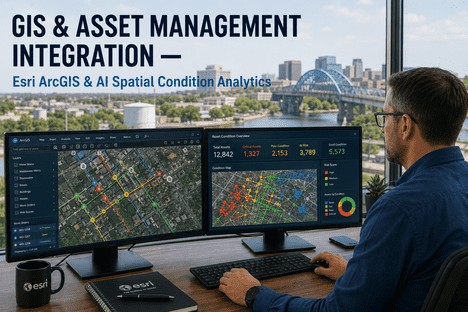
iFactory's GIS and asset management integration module brings together Esri ArcGIS spatial data, real-time asset condition scores, AI-powered risk analytics, and work order history into a single map-centric platform — giving infrastructure managers, asset managers, and engineering directors a unified view of what they own, how it is performing, and where to invest next.
Projected global GIS market by 2034 at 15.8% CAGR — organisations that integrate GIS with asset management capture disproportionate operational savings
30-50%
Reduction in time spent locating and verifying asset data when GIS and asset management are unified in a single spatial platform
67%
Of infrastructure organisations cite disconnected data systems as the primary barrier to proactive maintenance and capital planning
3.5x
Higher asset lifecycle value achieved by organisations that use GIS-integrated condition-based maintenance versus time-based maintenance alone
What GIS Asset Management Integration Actually Means — and Why Most Organisations Have Not Achieved It
GIS asset management integration sounds like a technical problem. It is not. It is a visibility problem. Most infrastructure organisations already own a GIS platform — typically Esri ArcGIS — and most already operate an asset management system, whether it is a CMMS, EAM, or custom database. The gap between them is not technological. It is structural. The GIS team maintains the spatial layer. The maintenance team keeps the work order history. The engineering team holds the condition assessments. And the capital planning team builds spreadsheets on top of data pulled from all three sources, manually, every quarter.
The Four Failure Modes of Disconnected GIS and Asset Management — and How They Show Up in Your Operations
The Two-Source Problem
Your GIS says the asset exists. Your CMMS says it was replaced five years ago. Neither knows the other is wrong.
When asset location data lives in ArcGIS and maintenance history lives in a separate system with no automated synchronisation, the two datasets drift over time. A bridge that was rehabilitated in 2023 still shows its original material type on the map. A water main replaced in 2022 still triggers a high-risk score based on age because the replacement date was never updated in the GIS layer. The cost of this drift is not just data cleanup — it is capital allocated to the wrong assets, emergency repairs that could have been planned, and board reports that present incorrect infrastructure condition profiles.
Data Drift + Misallocated Capital
The Manual Compilation Cycle
Every capital planning cycle starts with weeks of data extraction, email threads, and reconciliation meetings.
When capital planning season arrives, the asset management team must export condition data from one system, work order history from another, spatial data from ArcGIS, and cost data from the financial system — then compile everything into a single spreadsheet for analysis. The process takes three to six weeks, produces a snapshot that is obsolete the day it is completed, and depends on institutional knowledge that walks out the door when senior staff retire. The result: capital plans are built on data that was already stale before the first review meeting.
Planning Lag + Knowledge Loss
The Map-Only Trap
Your GIS shows where assets are but not how they are performing — so the map is a picture, not a decision tool.
Many organisations invest heavily in GIS mapping but stop at visualisation. The map shows every valve, every manhole, every bridge — but clicking on an asset reveals little more than its ID number and installation date. Without integrated condition scores, risk ratings, work order counts, and inspection history, the GIS layer remains a static inventory map rather than a dynamic asset performance dashboard. Asset managers still need to cross-reference the map against three other systems to answer even basic questions about maintenance priority.
Static Visualisation + Missed Context
The AI Readiness Gap
AI spatial analytics need integrated data. Disconnected systems mean AI models train on incomplete pictures of asset health.
Predictive analytics and AI-driven condition scoring require data from multiple domains: spatial location, maintenance history, inspection results, environmental factors, and operational context. When these datasets are siloed, any AI model built on top of them inherits the gaps. A machine learning model predicting water main breaks might have excellent pipe material and age data from GIS but no information about recent pressure events or repair history from the CMMS — producing risk scores that miss the most relevant predictors. Integrated spatial condition analytics solve this by feeding all relevant data into the same AI pipeline.
A Map That Tells the Full Story — Not Just Where Assets Are, but How They Are Performing, What They Need, and When
iFactory integrates directly with Esri ArcGIS to unify spatial data, asset condition scores, work order history, and AI-driven risk analytics in a single map-centric platform. No manual data compilation. No stale snapshots. No switching between five systems to answer one question.
What iFactory's GIS and Asset Management Integration Module Actually Delivers
iFactory does not bolt a map on top of an asset register or attach a condition score to a GIS layer. It builds a unified spatial asset data environment where Esri ArcGIS geometry, maintenance records, inspection results, risk scores, and capital planning data coexist in a single platform — with role-based access that matches how different teams actually work.
Capability 01
ArcGIS-Native Asset Visualisation — Every Asset with Its Condition, History, and Risk Score on One Map
Spatial Condition Intelligence
iFactory integrates directly with Esri ArcGIS to pull asset geometry, spatial layers, and basemaps into the same interface where condition scores, work order histories, inspection results, and risk ratings are displayed. When an asset manager opens the map, every feature carries its full performance profile — colour-coded by condition index, sized by criticality, and labelled with the last inspection date and next scheduled maintenance activity. Clicking any asset opens a detailed panel showing the complete maintenance timeline, cost history, linked documents, and AI-generated risk forecast. The map is no longer a static inventory layer. It is a live asset performance dashboard.
Colour-coded condition mapping
Click-through asset performance profiles
Live risk score overlay on GIS features
Capability 02
AI-Powered Spatial Condition Analytics — Predict Failure Risk by Location, Not Just by Asset Class
Predictive Spatial AI
iFactory's AI spatial condition analytics engine ingests data from four domains — spatial attributes from ArcGIS, maintenance history from the work order system, inspection condition ratings, and environmental context data — to produce asset-level risk scores that are spatially aware. The model learns which combinations of asset age, material type, maintenance frequency, and environmental exposure correlate with failure, and it projects those patterns across the entire asset population on the map. The result is a risk heat map that highlights not just which asset classes are degrading, but which specific geographic areas and corridors face the highest probability of failure within the next 12 to 24 months. Capital planning shifts from reactive to predictive, with investment decisions guided by location-specific risk profiles rather than system-wide averages.
Multi-domain AI risk engine
Spatial failure pattern recognition
12-24 month risk projection heat maps
Capability 03
Integrated Work Order Mapping — See Maintenance Activity in Geographic Context, Not Just in Spreadsheets
GIS-Centric Work Orders
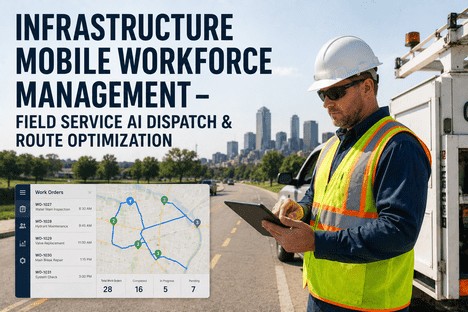
Every work order in iFactory is geospatially tagged and visible on the integrated ArcGIS map layer. Open work orders appear as active markers. Completed work orders leave a spatial history trail that accumulates over time. An asset manager reviewing a corridor can immediately see how many work orders have been raised on each asset, what type of maintenance was performed, how long repairs took, and what the total cost has been over any selected period. The spatial work order view reveals patterns that are invisible in a tabular report — a cluster of valve repairs in a neighbourhood that suggests a systemic pressure problem, or a stretch of roadway where pavement patching has been repeated five times without a structural resolution. These geographic patterns become the basis for root cause analysis and capital project scoping.
Geo-tagged open and closed work orders
Spatial maintenance history accumulation
Geographic pattern recognition for RCA
Capability 04
Capital Planning and Scenario Modelling — Prioritise Investments Based on Spatial Risk, Not Just Asset Age
Data-Driven Capital Planning
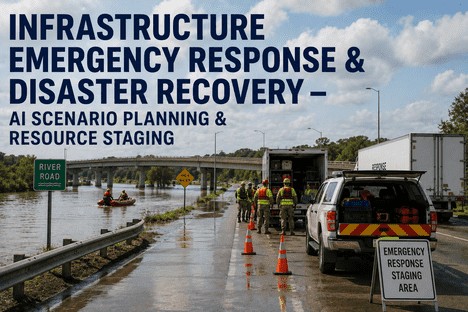
iFactory's capital planning module uses the integrated GIS-asset management dataset to run scenario models that show the financial and risk impact of different investment strategies. An asset manager can select a geographic area, filter by asset type and condition range, and model the cost of three intervention strategies — minimum maintenance, targeted rehabilitation, or full replacement — with the projected impact on network-wide risk scores displayed on the map. The output is not a spreadsheet of numbers but a spatial investment plan that shows exactly which assets would be addressed, at what cost, and with what risk reduction outcome — all visible on the ArcGIS map layer that the engineering team already uses. Capital budget presentations shift from static slides to live map-based investment narratives that decision-makers can explore themselves.
Spatial scenario modelling engine
Risk-cost trade-off visualisation
Live map-based capital plan presentation
Why Spatial Context Changes Everything — Comparing Traditional Asset Management with GIS-Integrated Asset Management
The difference between traditional asset management and GIS-integrated asset management is not the presence of a map. It is whether the map functions as a visual index or as a decision engine. The table below shows how the same operational question produces radically different answers depending on whether asset and spatial data are integrated or siloed.
Traditional vs GIS-Integrated Asset Management — How the Same Questions Produce Different Answers
Operational Question
Traditional Asset Management
iFactory GIS-Integrated Platform
Which bridges need inspection next quarter?
Sort bridge list by last inspection date. Consult separate traffic volume spreadsheet. Manually cross-reference with known defect list from engineering.
Spatial query of all bridges due for inspection, filtered by condition score, traffic volume (from GIS layer), and proximity to schools or hospitals — displayed as colour-coded markers on the ArcGIS map.
Where should we allocate the next capital budget?
Review average condition scores by asset class. Identify worst-performing categories. Allocate budget proportionally. Cannot visualise geographic concentration of poor-condition assets.
Risk heat map shows clusters of poor-condition assets by geographic area. Scenario modelling compares cost of rehabilitation vs replacement per corridor. Capital plan built spatially and visible on the GIS map layer.
Is a recent service request part of a broader pattern?
Open work order database. Search by asset type. Scan manually for similar complaints in the same area. Make qualitative judgment.
Spatial cluster detection highlights nearby work orders of the same type within the geographic area. Pattern identification is automatic. Root cause analysis triggers directly from the map view.
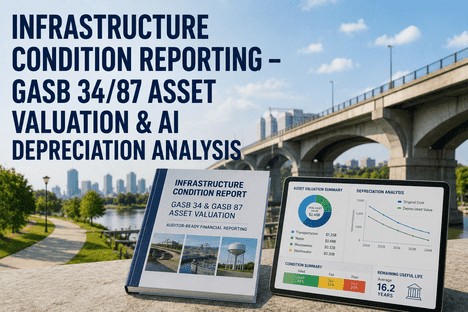
What is the total replacement value of assets in a flood zone?
Export asset register. Overlay flood zone data manually in GIS. Cross-reference asset types. Calculate replacement cost in separate spreadsheet. Process takes days.
Draw flood zone polygon on the map. Asset count, condition profile, and total replacement value populate automatically from the integrated GIS-asset dataset. Result in seconds.
Before iFactory, we had ArcGIS on one screen and our CMMS on another. Every capital planning cycle, my team spent three weeks exporting data from both systems, reconciling the differences, and building a consolidated view that was already incomplete. The first time I opened the integrated spatial dashboard, I could see every water main in the system colour-coded by condition score with work order history overlaid — and I immediately spotted a cluster of breaks in a neighbourhood where we had not planned any investment. That single view changed how we allocate our capital programme. It is not a faster way to do the same thing. It is a different way of seeing the infrastructure entirely.
— Director of Asset Management, Metropolitan Water Utility — 22 Years Infrastructure Management
Conclusion — The Infrastructure Visibility Gap Is Closing. The Question Is Whether Your Organisation Will Close It or Be Closed Out by It.
The global GIS market is approaching USD 25.5 billion. The digital twin market is expanding at 35.4% CAGR. AI spatial analytics are evolving from experimental to operational. The infrastructure organisations that will lead this decade are not the ones with the largest maintenance budgets or the newest equipment. They are the ones that have integrated their spatial data with their asset management data — creating a single source of truth where every asset's location, condition, history, and risk profile are visible in one view, updated in real time, and accessible to every decision-maker who needs it.
The cost of maintaining disconnected systems is not just the labour spent exporting and reconciling data every reporting cycle. It is the capital allocated to the wrong assets, the emergency repairs that could have been planned, the AOG events that a cross-system view would have prevented, and the board reports that present an incomplete picture of infrastructure health. These costs compound silently in every budget cycle, invisible to the organisations that have never experienced the alternative.
iFactory's GIS and asset management integration module connects Esri ArcGIS spatial data, AI-powered condition analytics, work order history, and capital planning into a single platform — giving infrastructure managers, asset managers, and engineering directors the unified spatial view they need to make better decisions, faster. Book a Demo to see the platform configured with your GIS layers and asset data, or talk to an expert about how iFactory maps to your organisation's specific infrastructure profile and system landscape.
Your GIS Shows Where Assets Are. iFactory Shows You How They Are Performing, What They Need, and When to Act.
Esri ArcGIS integration, AI spatial condition analytics, geo-tagged work orders, risk heat maps, and capital scenario modelling — all in a single map-centric platform built for infrastructure teams.
iFactory integrates with existing Esri ArcGIS deployments rather than replacing them. The platform connects directly to ArcGIS Online or ArcGIS Enterprise to read feature layers, basemaps, and spatial data, then overlays asset condition scores, work order history, risk analytics, and capital planning data on top of the existing GIS geometry. The GIS layer continues to be maintained in ArcGIS — iFactory adds the asset management context that makes the map operationally useful. For organisations that do not currently have a GIS deployment, iFactory can also ingest spatial data directly from CAD files, survey data, or aerial imagery to build the spatial asset layer from scratch. Talk to an expert to discuss your specific GIS integration requirements and current system architecture.
Yes. iFactory supports both spatial and non-spatial asset records within the same platform. Assets that have geographic coordinates are displayed on the integrated ArcGIS map layer. Assets that are location-dependent but not directly mappable — such as equipment inside a facility, components of a larger system, or mobile assets — can be linked to a parent spatial feature or assigned a logical location within a facility hierarchy. The platform also supports indoor spatial positioning for vertical assets within buildings, using floor plan overlays and indoor mapping layers where available. The asset management data model is flexible enough to accommodate any asset type regardless of whether it has a traditional geographic coordinate. Book a Demo to see how iFactory handles your specific asset hierarchy and spatial data structure.
iFactory provides four categories of AI spatial analytics out of the box: asset condition scoring (combining age, material, inspection results, and maintenance history into a composite condition index), failure risk prediction (identifying assets and geographic areas with the highest probability of failure within 12-24 months), maintenance pattern detection (identifying spatial clusters of repeated repairs that indicate systemic issues), and capital scenario modelling (comparing investment strategies based on projected risk reduction and cost). No data science team is required to use any of these analytics. The models are pre-configured with infrastructure-sector training data and automatically calibrate to the organisation's own asset data as it accumulates in the platform. Configuration is done through the analytics settings interface, not through code or model training pipelines. Talk to an expert to learn which analytics modules are most relevant to your asset portfolio and operational priorities.
For an organisation with an existing Esri ArcGIS deployment and an active asset management system, iFactory's standard implementation covers: weeks one to two for ArcGIS integration, data mapping, and platform configuration; weeks three to four for asset data migration, condition score calibration, and work order history import; weeks five to six for spatial analytics model configuration and KPI dashboard setup; and weeks seven to eight for team training, workflow testing, and go-live. The integrated GIS-asset management dashboard — showing assets colour-coded by condition on the ArcGIS map layer — is typically available for review within the first two to three weeks. The full platform, including AI spatial analytics and capital scenario modelling, is operational within eight weeks for most organisations. Book a Demo to discuss your organisation's specific implementation timeline based on current system landscape, asset data volume, and integration complexity.
Yes. iFactory includes a mobile application that allows field technicians to view asset data on the GIS map, update condition ratings, log work orders, attach photos, and capture inspection results from any location with mobile connectivity. Field updates synchronise to the central platform in real time — so when a technician completes an inspection and updates the condition score of a bridge or a valve, the change is immediately reflected in the network-level risk heat map and capital planning models. The mobile app works offline for locations with limited connectivity, queuing updates until synchronisation is available. This closed-loop field-to-office data flow ensures that the spatial asset dashboard always reflects the most current condition data available. Book a Demo to see the mobile platform in operation and discuss field data collection requirements for your inspection workflows.