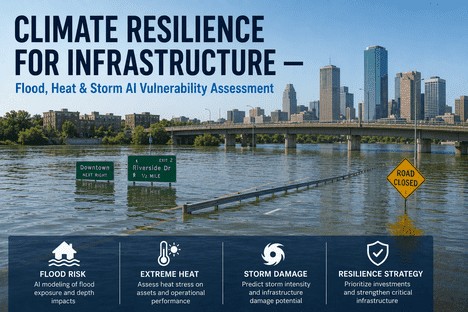
Climate Resilience for Infrastructure — Flood, Heat & Storm AI Vulnerability Assessment
By Grace on June 24, 2026
Climate-driven infrastructure damage is no longer a future risk scenario — it is a present operational reality. In 2024 alone, the United States experienced 27 separate weather and climate disasters exceeding USD 1 billion each, with total damages surpassing USD 182 billion. Globally, extreme weather events cost infrastructure and buildings an estimated USD 732 to 845 billion annually. Roads buckle under extreme heat, storm surges overwhelm coastal facilities, and floodwaters inundate substations, treatment plants, and transport hubs with increasing frequency. For EHS managers and infrastructure directors, the question is no longer whether climate change will affect their assets — it is whether they have the vulnerability assessment capability to understand which assets are at risk, under what climate scenarios, and with what financial consequences. Traditional vulnerability assessment methods — relying on historical hazard maps, periodic visual inspections, and static risk registers — are inadequate for the accelerating pace and compounding nature of climate threats. AI-driven climate vulnerability assessment changes that by modelling flood risk, extreme heat impact, and storm damage potential at asset-level resolution, enabling resilience strategies that are dynamic, probabilistic, and linked directly to capital planning cycles. This guide provides the framework, methodology, and KPI structure for building that capability.
USD 845B
Average annual global infrastructure and building losses from disasters — equal to 14% of global GDP growth in 2022
27 Events
Billion-dollar weather disasters in the US in 2024 — the second-highest annual count on record, with 17 severe storm events alone
USD 38T
Projected annual climate damage cost by 2050 — including infrastructure, agriculture, productivity, and health impacts across all regions
1.55C
Global temperature above pre-industrial levels in 2024 — the warmest year on record, intensifying every climate hazard category
The Three Climate Threats to Infrastructure — Profile, Mechanism, and Assets at Risk
Every infrastructure portfolio faces a different mix of climate hazards. Understanding the specific mechanisms through which flood, extreme heat, and storm events damage assets is the foundation of any vulnerability assessment. Each threat operates on different timescales, affects different asset types, and requires a different modelling approach to predict impact with confidence.
F
Flood Risk
Riverine, Coastal & Flash
Damage Mechanism
Water ingress, foundation scouring, material degradation, electrical system failure, and contaminant mobilisation from upstream sources.
Assets at Highest Risk
SubstationsTreatment PlantsTunnelsRoadbeds
AI Modelling Inputs
LIDAR topography, rainfall intensity projections, drainage network capacity, land cover, soil saturation indices, and sea-level rise scenarios for coastal assets.
H
Extreme Heat
Chronic & Acute Heat Stress
Damage Mechanism
Thermal expansion of joints and pavements, material fatigue acceleration, rail track buckling, electrical grid capacity derating, and cooling system failure under peak load.
Assets at Highest Risk
Rail LinesPavementsPower CablesBridges
AI Modelling Inputs
Climate model ensemble data, urban heat island effect mapping, material thermal tolerance databases, historical temperature anomaly trends, and cooling degree-day projections.
S
Storm & Wind
Hurricane, Cyclone & Severe Storm
Damage Mechanism
Structural overloading from wind pressure, debris impact, tree fall, roof uplift, communication tower collapse, and cascading failures from grid interruption.
Assets at Highest Risk
Power LinesCell TowersRoofsPoles
AI Modelling Inputs
Historical storm track and intensity data, wind-field modelling, vegetation density and species databases, structural vulnerability curves by asset type, and climate projection ensembles.
Most Infrastructure Resilience Plans Are Built on Historical Data. Climate Does Not Repeat Itself — It Escalates.
iFactory gives EHS managers and infrastructure directors the AI-driven vulnerability assessment capability to model flood, heat, and storm risk at asset-level resolution — with climate scenario projections, financial impact modelling, and prioritised adaptation roadmaps.
Why Traditional Vulnerability Assessment Falls Short — Three Gaps That Cost Billions
Most infrastructure organisations conduct climate vulnerability assessments using historical hazard frequency data, FEMA flood maps, and engineering judgement applied during design life. These methods were built for a stable climate — a condition that no longer exists. The gap between what traditional assessment methods reveal and what the real risk exposure is grows wider with each extreme weather event. Three structural gaps explain why.
GAP 01
Historical Data Cannot Predict Non-Stationary Risk
Traditional vulnerability assessment relies on the assumption that the past 30 to 50 years of weather data is representative of the next 30 to 50 years. That assumption is invalid in a warming climate. Flood return periods are compressing — what was a 500-year rainfall event in 1990 is now a 50-year or even 10-year event in many regions. Heat extremes that occurred once per decade are now occurring annually. Historical baselines systematically underestimate current and future exposure. AI-driven assessment replaces static return-period analysis with probabilistic climate modelling that incorporates CMIP6 projections, RCP scenario pathways, and ensemble-based hazard frequency distributions — producing vulnerability scores that reflect the actual risk trajectory rather than the historical average.
GAP 02
Static Risk Registers Do Not Capture Cascading Failure
A substation that sits outside the floodplain on its own may be low-risk. But if the road network that provides crew access floods under a 24-hour rainfall event, and the upstream transmission line is vulnerable to wind damage, and the backup generator relies on a fuel supply chain that passes through three storm-surge zones, the effective vulnerability of that substation is far higher than any single-asset assessment would suggest. Traditional risk registers assess assets in isolation. AI-driven vulnerability modelling maps dependency chains — identifying which single points of failure expose the widest network of downstream assets. This network-level vulnerability perspective is the difference between knowing which assets are at risk and knowing which failure sequences will actually cause operational outages.
GAP 03
Inspection Cycles Cannot Keep Pace With Climate Acceleration
Most infrastructure vulnerability assessments are updated on a 3-to-5-year cycle — aligned with capital planning or regulatory reporting schedules. In a climate where hazard frequencies are shifting year-on-year, a vulnerability assessment conducted every five years provides a snapshot that is outdated before the next planning cycle begins. AI-driven continuous vulnerability monitoring ingests real-time weather data, remote sensing inputs, and asset-level condition feeds to produce a dynamic risk score that updates as hazard conditions change. An EHS manager who can see that a specific bridge's flood vulnerability score has moved from moderate to high after three consecutive above-average rainfall seasons has actionable information months or years before a traditional re-inspection cycle would flag the same risk. Book a Demo to see how iFactory's AI vulnerability engine replaces static risk registers with dynamic, asset-level climate intelligence.
Traditional vs. AI-Driven Vulnerability Assessment — How the Approaches Compare
The difference between traditional and AI-driven vulnerability assessment is not a technology upgrade — it is a fundamental shift in how risk is quantified, updated, and connected to decision-making. The comparison below shows how each approach performs across the dimensions that matter most for infrastructure resilience planning.
Assessment Dimension
Traditional Approach
AI-Driven Approach
Hazard Data Source
Historical weather records and FEMA-designated risk zones updated every 5 years
CMIP6 climate model ensembles, RCP scenario pathways, real-time weather feeds, and satellite-derived hazard layers updated continuously
Risk Quantification
Qualitative high-medium-low ratings based on engineering judgement and historical loss data
Probabilistic annualised loss expectancy, asset-level vulnerability scores, and scenario-based financial impact modelling
Update Frequency
Every 3 to 5 years, tied to capital planning or regulatory compliance cycles
Continuous — risk scores update with new hazard data, asset condition changes, and climate model revisions
Asset Resolution
Zone-based or facility-level, aggregated into broad risk categories
Individual asset-level with component-specific vulnerability scoring and spatial overlay at 1-metre resolution
Cascading Failure
Not typically assessed — assets evaluated independently in risk register
Dependency chain mapping — identifies upstream-downstream failure propagation across the infrastructure network
Output Format
Static PDF report, colour-coded map, and spreadsheets reviewed annually
Interactive KPI dashboard with real-time risk scores, trend analytics, financial impact projections, and prioritised adaptation recommendations
The Climate Resilience Programme — Five Phases From Assessment to Adaptation
Building climate resilience is not a one-time study or a single capital project. It is an ongoing programme that moves through five distinct phases — each with defined inputs, analytical methods, and outputs that connect to operational and financial decision-making. The organisations that are furthest ahead in climate resilience are those that treat it as a continuous performance discipline rather than a periodic compliance exercise.
01
Hazard & Exposure Mapping
Overlay climate projection data with asset geographic inventory to identify which assets face which hazards under each RCP scenario
1-2 Months
02
Vulnerability Scoring & Financial Impact
Apply AI vulnerability models to each asset, compute probabilistic annualised loss, and rank by financial risk exposure
2-3 Months
03
Adaptation Option Analysis
Model intervention options — harden, relocate, redesign, insure — with cost-benefit analysis under multiple climate scenarios
2-3 Months
04
Capital Planning Integration
Translate vulnerability scores and adaptation costs into phased capital plans with prioritised spend aligned to risk reduction ROI
1-2 Months
05
Continuous Monitoring & Reassessment
Establish dynamic dashboard, real-time risk score updates, annual KPI review, and adaptation plan refinement cycle
Ongoing
"
Our previous vulnerability assessment was a 200-page PDF that was eighteen months out of date by the time we presented it to the board. The second time a 100-year flood event hit two of our treatment plants in three years, we realised the assessment framework itself was the risk — it was telling us what had happened, not what was coming. We switched to iFactory's AI-driven vulnerability engine in early 2024. Within the first quarter, we identified seven assets where the dynamic risk score had crossed our internal threshold that the static assessment had classified as low risk. We completed hardening upgrades on four of them before Hurricane Milton made landfall. One of those assets would have failed catastrophically under the surge levels we experienced.
— Director of Infrastructure Resilience, Municipal Water & Wastewater Authority — 22 Years Infrastructure Asset Management
Conclusion
Climate-driven infrastructure damage is accelerating faster than most asset management programmes can adapt. With USD 845 billion in annual global infrastructure losses, 27 billion-dollar disasters in the US in a single year, and projected annual costs reaching USD 38 trillion by 2050, the margin for relying on static vulnerability assessments and outdated hazard maps has disappeared. EHS managers and infrastructure directors who deploy AI-driven vulnerability assessment gain three capabilities that traditional methods cannot provide: asset-level risk scoring that updates with changing climate conditions, probabilistic financial impact modelling that connects vulnerability data to capital planning decisions, and dependency-chain visibility that reveals how failure cascades across networks rather than assessing assets in isolation.
iFactory's AI climate vulnerability assessment engine gives infrastructure organisations the dynamic risk intelligence they need to build resilience strategies that match the pace of climate change — with real-time hazard data integration, multi-scenario financial modelling, and a prioritised adaptation roadmap that connects directly to capital planning cycles. Book a Demo to see how iFactory maps flood, heat, and storm vulnerability across your infrastructure portfolio at asset-level resolution, or talk to an expert to discuss how AI-driven climate vulnerability assessment fits into your existing resilience planning framework.
Frequently Asked Questions
FEMA flood maps and standard hazard datasets are based on historical weather records and are updated on multi-year cycles. They provide a useful baseline but systematically underestimate current risk in a non-stationary climate. iFactory's AI vulnerability engine integrates those baseline datasets with CMIP6 climate model projections, real-time weather feeds, satellite-derived land cover and topography data, and asset-level condition records to produce dynamic risk scores that update as hazard conditions change. Where a FEMA map might indicate a 500-year floodplain boundary based on 30-year historical averages, iFactory's model reflects the actual return-period compression observed in recent climate data and projected under RCP 4.5 and 8.5 scenarios. The result is a vulnerability assessment that reflects the risk trajectory, not the historical average. Talk to an Expert to discuss how iFactory's approach compares to your current vulnerability assessment methodology.
iFactory's assessment engine covers built infrastructure assets across transportation (roads, bridges, tunnels, rail lines), utilities (substations, power lines, water treatment plants, pumping stations, pipelines), communications (cell towers, fibre routes, data centres), and buildings (critical facilities, warehouses, administration centres). The AI models use asset-specific vulnerability curves — a bridge fails under different flood depth and velocity thresholds than a substation, and the model accounts for these differences. The platform also supports custom asset classification, so organisations with specialised infrastructure types can define vulnerability parameters specific to their asset classes. Book a Demo to see how your specific asset portfolio maps onto iFactory's vulnerability modelling framework.
Yes. iFactory computes probabilistic annualised loss expectancy for each asset based on hazard probability, vulnerability score, and replacement value. These loss projections are modelled under multiple climate scenarios (RCP 4.5 and 8.5 across near-term, mid-century, and end-century time horizons) so organisations can see how financial risk exposure changes under different warming trajectories. The platform then models adaptation intervention costs against projected loss reduction — producing ROI metrics for each intervention option that can be ranked and phased across capital planning cycles. This allows infrastructure directors to present climate adaptation investments to finance teams and boards with the same cost-benefit rigour applied to any other capital allocation decision. Talk to an Expert to see sample financial impact modelling outputs for infrastructure asset portfolios similar to yours.
iFactory integrates CMIP6 climate model ensembles from the IPCC AR6 framework, covering RCP 4.5 (intermediate emissions) and RCP 8.5 (high emissions) scenarios across three time horizons: near-term (2025-2040), mid-century (2041-2065), and end-century (2066-2100). Hazard-specific inputs include rainfall intensity projections, temperature extremes, sea-level rise estimates, storm frequency and intensity projections, and drought indices. These are combined with localised data — LIDAR topography, land cover classification, soil type, drainage network capacity, and asset-specific design standards — to produce vulnerability scores that reflect both climate exposure and asset sensitivity. The platform supports integration with organisation-specific climate data sources and consultant-provided hazard models. Book a Demo to review the full climate data schema and discuss how iFactory maps to your organisation's existing climate risk data sources.
A full portfolio vulnerability assessment with AI-driven scoring, financial impact modelling, and adaptation roadmap typically completes within 8 to 12 weeks from data ingestion to delivered dashboard. The timeline depends on data availability — organisations with existing asset inventories in CMMS or GIS systems deploy faster than those requiring data collection and classification. Phase 1 (hazard and exposure mapping) completes in weeks 1-4, Phase 2 (vulnerability scoring and financial impact) in weeks 4-8, and Phase 3 (adaptation roadmap and dashboard delivery) in weeks 8-12. iFactory provides dedicated data onboarding support and works with your existing asset data sources to minimise the deployment timeline. Book a Demo to discuss deployment timelines specific to your infrastructure portfolio size and data readiness level.
USD 38 Trillion in Annual Climate Damage by 2050 Is the Forecast. The Organisations That Prepare Today Will Be the Ones Still Standing.
iFactory's AI climate vulnerability assessment engine gives EHS managers and infrastructure directors the real-time risk intelligence, financial impact modelling, and prioritised adaptation roadmap needed to protect critical infrastructure from accelerating climate threats.