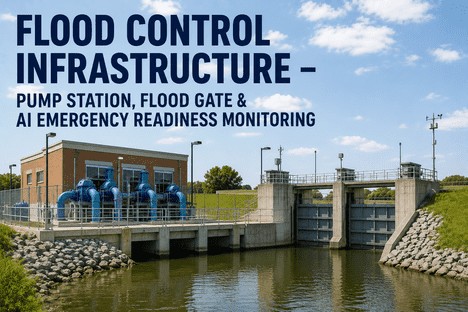
Flood Control Infrastructure — Pump Station, Flood Gate & AI Emergency Readiness Monitoring
By Grace on June 25, 2026
Flood control infrastructure is the silent shield every community depends on — until the moment it is not ready. Pump stations, flood gates, levees, and drainage networks sit idle through dry months, activated only when an atmospheric river or tropical system tests their preparedness. For operations directors responsible for these assets, the challenge is acute: how do you verify that every pump will start, every gate will open, every levee will hold — not after the forecast arrives, but months before, when there is still time to repair, retrofit, and rehearse? The gap between a flood control asset inventory and verified flood readiness is not a technology gap. It is a monitoring and decision-making gap — the difference between knowing what assets exist and knowing, in real time, which assets are ready to perform under design-storm conditions. Building a data-driven flood readiness programme is not a SCADA upgrade project. It is an operational transformation with defined readiness stages, continuous condition intelligence, and an alert framework that connects asset health data to emergency response timelines.
Flood Readiness · Pump Station AI · Gate Monitoring · Levee Intelligence · Emergency Preparedness
A Flood Wall That Has Not Been Tested Is a Promise, Not a Defence. iFactory Verifies Readiness Continuously.
iFactory's flood infrastructure readiness platform gives operations directors continuous visibility into pump station condition, flood gate operability, and levee monitoring data — with AI-driven anomaly detection, readiness scoring, and the alert infrastructure that turns asset health data into storm-ready confidence.
ASCE grade for America's levee infrastructure — 24,000+ miles of levees with an average age of 61 years, protecting 23 million people and $2 trillion in property value
40%
Of USACE levee portfolio risk is driven by overtopping — the most common failure mechanism, directly addressable through readiness monitoring and pre-storm condition verification
88%
Alert hit rate achieved by AI-driven pump monitoring systems — transforming alarm floods into actionable, trusted notifications that reduce emergency callouts and prevent failures
$21B
Estimated cost to address risk in the USACE levee portfolio alone — proactive readiness monitoring reduces emergency repair expenditure and extends asset life through condition-based intervention
Why Flood Control Readiness Programmes Underdeliver — and What the Data Reveals
The pattern is consistent across jurisdictions that operate flood control infrastructure: pump stations are inspected on calendar schedules that bear no relationship to actual condition trajectories, flood gates are tested manually at the start of wet season with no longitudinal performance record, and levee monitoring — where it exists at all — relies on visual inspection that cannot detect internal erosion or structural degradation until surface indicators appear. When a storm event arrives, the operations director discovers readiness gaps in sequence rather than having a comprehensive readiness dashboard updated continuously. Three root causes explain why flood control assets fail or underperform despite regular inspection programmes.
01
Asset Condition Is Sampled Annually. Readiness Changes Daily.
A pump station that passes its annual wet-season readiness inspection in November can develop a cracked impeller, a control panel fault, or a debris-clogged intake by March — and nobody will know until the station fails to start during a storm event. Flood gates can accumulate sediment preventing full closure, or their control mechanisms can degrade through corrosion and disuse, without detection until the gate is needed. Levee condition can change after a single heavy rain event that saturates the embankment, yet the next scheduled inspection may be months away. The gap between asset inventory data and operational readiness is the interval between inspection cycles — and during that interval, the community's protection is unknown. AI-driven continuous monitoring closes this gap by analysing pump performance telemetry, gate cycle data, and levee sensor readings in real time, detecting anomalies that signal degradation before they become failure points.
02
Alarm Systems Generate Noise, Not Intelligence.
Traditional SCADA-based alarm systems at pump stations use static high-high or low-low thresholds that cannot distinguish between a pump operating normally during heavy rainfall and a pump failing under load. The result is an alarm flood during every significant storm — overwhelming operators with notifications that blend genuine emergencies with expected operational responses. Research from utilities that have deployed AI-enhanced pump monitoring shows that static alarms create a cry-wolf effect: operators learn to ignore or pause alarm notifications because the majority are false positives triggered by weather conditions rather than equipment faults. When a genuine failure alert appears among hundreds of routine alarms, it is missed or delayed. AI-based dynamic alerting that learns each pump's normal operating envelope — accounting for rainfall intensity, wet well level, and historical performance patterns — filters the signal from the noise, achieving alert hit rates above 88% and enabling operators to trust and act on every notification.
03
Levee and Flood Gate Data Exist in Disconnected Systems.
A typical flood control network spans pump stations managed through SCADA, flood gates operated by a separate control system, levees monitored through visual inspection reports filed in an asset management platform, and weather data coming from a third-party forecasting service. These systems do not communicate with each other. The operations director preparing for a forecasted storm event must manually compile readiness status from multiple sources — checking pump run logs against the maintenance system, calling field crews for gate test results, and reviewing the most recent levee inspection report that may be six months old. This manual compilation takes hours during a period when minutes matter, and it produces a snapshot that is outdated before the briefing ends. A unified flood readiness platform that ingests data from all these sources — pump telemetry, gate cycle records, inspection findings, rainfall forecasts, and river gauge data — and presents a single readiness score for each asset class transforms emergency preparedness from a manual compilation exercise into an automated operational dashboard.
Pump Station AI · Flood Gate Readiness · Levee Monitoring · Unified Operations Dashboard · Storm Preparedness
A SCADA Alarm That Everybody Ignores Is Not a Warning System. iFactory Turns Raw Telemetry Into Trusted Readiness Intelligence.
iFactory unifies pump station telemetry, flood gate cycle data, levee inspection records, and weather forecasting into a single readiness operations centre — with AI anomaly detection, dynamic alert thresholds, and asset-level readiness scoring that give operations directors verified confidence before every storm.
The Flood Readiness Assurance Framework — Five Layers Every Operations Director Must Connect
Flood readiness is not a binary state — it is a layered assurance framework that spans individual asset condition, system-level integration, operational procedures, and external threat intelligence. Operations directors who connect all five layers know, before every storm event, exactly which assets are ready, which have degraded since the last inspection, and what the response plan is for each forecasted scenario. The framework below represents the five layers of readiness that separate organisations that respond to flood events with confidence from those that discover gaps during the storm.
Layer 1
Individual Asset Readiness
Every pump, gate, and levee segment has a verified readiness status based on the most recent inspection, sensor data, and operational test. Pumps are scored on start reliability, run-time variance from baseline, and maintenance recency. Flood gates are scored on full-cycle open-close test results, seal integrity, and control system communication status. Levee segments are scored on the basis of visual inspection findings, piezometer readings where installed, and time since last major storm loading. The readiness score updates dynamically as new data arrives — a pump that completed a successful start test yesterday has a higher readiness score than one whose last successful test was six months ago, even if both passed their annual inspection.
Layer 2
System-Level Integration
Individual assets do not operate in isolation. A pump station's readiness depends not only on the pumps themselves but on the wet well condition, control panel functionality, power supply reliability, and telemetry communication link. A flood gate's readiness depends on the gate structure, the control mechanism, the power supply, and the remote monitoring connection. A levee's readiness depends on the embankment condition, the drainage system, and the relief well functionality. The system-level readiness layer aggregates asset-level scores into station or segment scores, accounting for interdependencies — a pump station with four pumps where one is degraded may still be system-ready if the remaining three can handle the design flow, but only if the distribution of degradation is understood and documented before the storm.
Layer 3
Operational Procedure Readiness
Hardware readiness is meaningless without procedural readiness. Does the current operations team know the start sequence for each pump station? Are flood gate operating procedures documented, rehearsed, and accessible in the control room and in the field? Have levee patrol routes been walked and inspection checklists validated since the last storm season? This layer tracks staff training currency, drill completion rates, procedure update recency, and call-out roster accuracy. Operations directors who have experienced a flood event know that the gap between hardware readiness and operational readiness is where most failures occur — a pump that starts but is operated in the wrong sequence, a gate that opens but at the wrong time, a levee patrol that misses a seep because the inspection checklist was not followed under pressure.
Layer 4
Threat Intelligence Integration
Flood readiness is relative to the threat. A pump station that is ready for a 24-hour, 5-inch rainfall event may not be ready for a 12-hour, 10-inch event. A flood gate designed for a 100-year storm may perform differently if the forecast includes debris loading or prolonged high-water duration. The threat intelligence layer ingests rainfall forecasts, river gauge projections, tide and storm surge predictions, and upstream reservoir release schedules — and maps them against each asset's design parameters and current readiness score. When forecasted conditions exceed an asset's current verified readiness envelope, the platform escalates the asset to pre-storm review status, triggering a targeted inspection or operational adjustment before the storm arrives rather than during it.
Layer 5
Response and Recovery Coordination
The final layer connects asset readiness data to the broader emergency response framework. When a pump station crosses a readiness threshold during a storm, who is notified, what is the response timeline, and what backup plan activates if the asset cannot be restored before the next tide cycle? When a levee segment reaches a警戒 trigger based on piezometer trends or visual observation, what is the evacuation trigger for the protected area and who has authority to recommend it? This layer integrates asset readiness data with emergency operations centre workflows, public alert systems, and mutual aid request protocols. The operations director who has this layer configured before the storm does not make decisions under pressure — they execute plans prepared months in advance and updated with real-time data.
The Operations Director's Playbook — Six Actions That Build a Verified Flood Readiness Programme
Flood readiness is not achieved through a single annual inspection cycle or a pre-storm checklist completed in the 48 hours before a forecasted event. It is built through continuous condition monitoring, systematic testing, data-driven maintenance prioritisation, and the integration of asset health intelligence into emergency response workflows. These six actions distinguish operations directors who face storm season with verified confidence from those who hope their infrastructure will perform.
Action 01
Foundation
Deploy Continuous Condition Monitoring Across All Flood Control Assets
Annual inspections and wet-season readiness tests are essential but insufficient. Between them, asset condition degrades silently. Deploy continuous monitoring — pump performance telemetry (start/stop patterns, run time variance, power draw), flood gate cycle sensors (open/close time, seal pressure, control system communication), and levee instrumentation (piezometers, settlement markers, seepage monitors where risk drivers warrant) — that feeds real-time data into a unified readiness platform. The objective is not to replace annual inspections but to fill the gap between them with continuous intelligence. A pump that has started successfully under load 200 times since its last annual inspection has a verified readiness that no single annual test can provide. A pump that has not been called to start in the same period has unknown readiness — and that distinction is the foundation of a data-driven flood readiness programme.
Action 02
Intelligence
Replace Static Alarm Thresholds With AI-Driven Dynamic Alerting
Static high-high and low-low SCADA alarms generate noise that desensitises operators to genuine warnings. Implement AI-driven dynamic alerting that learns each asset's normal operating envelope — accounting for weather conditions, seasonal variations, and performance degradation trends. A pump running continuously during a 50mm rainfall event is normal; the same pump running continuously during dry weather is a potential fault. A flood gate that takes 30 seconds to open during a dry-season test may be normal; the same gate taking 45 seconds after a period of disuse is a signal that sediment accumulation or control system degradation requires investigation before the next storm. The AI models analyse historical performance data to establish baseline parameters for each asset, then compare real-time telemetry against those baselines, issuing descriptive alerts — "pump runtime exceeds normal range for current wet well level and rainfall intensity" rather than a generic "wet well high" alarm. Utilities that deploy this approach report alert trust rates above 88%, compared to sub-20% trust rates for static alarm systems during storm events.
Action 03
Integration
Build a Unified Readiness Operations Centre From Disconnected Data Sources
The single highest-impact action an operations director can take is to unify pump station SCADA, flood gate control systems, levee inspection records, maintenance management data, and weather forecasting into a single readiness operations centre. This does not require replacing existing systems — it requires an integration layer that ingests data from each source and presents a consolidated readiness view. The platform should display each asset's current readiness score, the time since its last successful operational test, any open maintenance actions or anomalies, and the forecasted threat level for the asset's location. When a storm is forecasted, the operations director opens one dashboard — not five separate systems. This unified view transforms emergency preparedness from a manual data-gathering exercise that consumes the first hours of a storm response into an automated operational intelligence layer that is current before the first rain falls.
Action 04
Drills
Run Readiness Drills Against the Dashboard, Not Against Memory
Most flood control operations teams run their pre-stseason readiness drills by walking through procedures from memory or from printed manuals. These drills test team knowledge but not system readiness. Transition to dashboard-driven drills where the operations team opens the unified readiness centre and verifies asset status from the live data — pump start test results from the most recent remote start, flood gate cycle completion records, levee inspection currency, and open maintenance actions. A drill that reveals a pump station showing a readiness score of 60% because its last successful remote start was eight months ago is a drill that has identified a real readiness gap that can be corrected before storm season. A drill that reveals the emergency call-out roster in the platform does not match the current staffing list is a drill that prevents a communications failure during an actual event. The readiness dashboard becomes the drill environment, and the drill process validates both the platform data and the team's ability to act on it.
Action 05
Forecast
Map Forecasted Threat Scenarios Against Current Asset Readiness Profiles
Weather forecasting technology has advanced to the point where 72-hour rainfall predictions are reliable enough to drive operational decisions. Integrate forecast data into the readiness platform and map it against each asset's design parameters and current readiness score. When a forecast calls for a 24-hour rainfall total that exceeds the remaining capacity of a drainage pump station's wet well at current pump readiness levels, the platform should flag that station for pre-storm review — triggering a targeted inspection, a fuel check on standby generators, and a confirmation that the remote monitoring connection is operational. When a river gauge forecast predicts a level that approaches the crest of a levee segment, the platform should confirm the levee patrol route documentation is current and the emergency contact list for the protected area is verified. The objective is to shift from reacting to weather to anticipating asset performance under forecasted conditions — and to address readiness gaps before the storm, not during it.
Action 06
Review
Conduct Post-Storm Readiness Reviews Using Event Data, Not Memory
Every storm event generates data about how flood control assets performed under actual loading conditions. Pumps that operated for extended periods generate run-time and power draw records that reveal performance characteristics not visible during dry-season tests. Flood gates that were cycled under loaded conditions — with water pressure differential across the gate — produce cycle-time and seal-performance data that is the most valuable readiness information the organisation will collect all year. Levee segments that were subjected to near-crest water levels generate piezometer and seepage readings that validate or challenge the embankment's condition assessment. Conduct a structured post-event readiness review within 30 days of each storm, using the event data to update each asset's performance baseline, adjust maintenance intervals where the event revealed degradation patterns, and update the readiness scoring algorithm to incorporate the new operational data. This continuous learning cycle is what transforms an asset inventory into a progressively more accurate readiness prediction system.
The Flood Readiness KPI Framework — What to Measure at Each Level
The following KPI taxonomy is structured around the five-layer readiness framework. Every metric connects to a named decision-maker and a defined operational action. iFactory's platform tracks all of these in real time, with configurable readiness thresholds and automated escalation workflows at each level.
Field Technician Level
Asset inspection assignments with readiness score history — see which pumps, gates, or levee segments have declining scores before arriving on site
Remote start test results for assigned pump stations — confirm remote start capability and capture run-time telemetry before field visit
Open anomalies requiring field verification — specific issues flagged by AI-driven monitoring that need visual confirmation
Shift Supervisor Level
Station and segment readiness scores by asset class — pump station, flood gate, and levee segment scores updated with each new telemetry or inspection data point
Alert queue with AI-classified priority — descriptive alerts ranked by severity and verified by dynamic threshold analysis, eliminating alarm flood during storm events
Pre-storm readiness checklist completion — percentage of pre-event verification actions completed across all assets in the supervisor's area of responsibility
Operations Director Level
Portfolio-wide readiness score trend — is overall flood control readiness improving, stable, or declining across the full asset inventory?
Anomaly-to-failure conversion rate — what percentage of AI-detected anomalies lead to confirmed faults, and how quickly are they resolved before the next storm event?
Readiness drill completion and performance score — have all scheduled drills been completed, and what percentage of assets demonstrated verified readiness during drill testing?
Emergency Manager / Board Level
Storm event readiness certification — a verified statement of readiness for each asset class, issued before every forecasted event, with known gaps documented and mitigation plans in place
Infrastructure resilience investment case — readiness trend data and anomaly-to-failure metrics supporting budget requests for asset renewal and upgrade programmes
Regulatory compliance status against levee safety programme and dam safety requirements — documented evidence of monitoring, inspection, and maintenance programme adequacy
"
I took over flood control operations after a near-miss event where a pump station failed to start during a tropical storm because the control panel had developed an intermittent fault that nobody had detected. The pump had passed its annual inspection five months earlier. The fault was present for at least three of those five months — it just never showed up during a dry-weather test because the vibration that triggered it only occurred under full-load pumping conditions. That event taught me that annual inspections create a false sense of security. We deployed continuous pump monitoring with AI anomaly detection across all thirty-seven pump stations in the district. In the first year, the system detected twelve developing faults before they would have caused a failure — worn impellers, control wiring degradation, check valve sticking, a generator auto-transfer switch that was intermittently failing to engage. None of those would have been caught by the annual inspection. We also integrated our flood gate and levee inspection data into the same platform, so I now have a single readiness dashboard that tells me, before every storm, exactly which assets are verified ready and which need attention. The annual inspection is no longer our readiness baseline. Continuous monitoring is. The difference between hoping your infrastructure will perform and knowing it will perform is the data you collect between storm events.
— Operations Director, Regional Flood Control District — 26 Years Infrastructure and Emergency Management
Conclusion
The difference between a flood control operation that enters storm season with verified confidence and one that discovers readiness gaps during the event is not the age of its infrastructure or the size of its maintenance budget. It is the continuous intelligence layer between annual inspection cycles — the pump performance telemetry, gate cycle data, levee instrumentation, and weather forecast integration that together transform asset inventory into verified readiness. With 24,000 miles of levees averaging 61 years of age, pump stations relying on static alarm systems that desensitise operators during storms, and climate-driven rainfall intensification testing infrastructure beyond original design parameters, the operations directors who build continuous readiness monitoring programmes will outperform on every metric that matters: pump start reliability under load, flood gate operability at the moment of need, levee surveillance coverage during events, and emergency response coordination speed. The monitoring infrastructure makes it possible. The readiness framework makes it real.
iFactory's flood infrastructure readiness platform gives operations directors the unified intelligence layer to build a verified readiness programme — with AI-driven pump and gate monitoring, levee condition tracking, dynamic alert thresholding, weather-integrated readiness scoring, and the decision infrastructure that transforms disconnected asset data into storm-ready confidence. Book a Demo to see how the platform maps to your flood control network, or talk to an expert to begin building your data-driven flood readiness programme with iFactory today.
Frequently Asked Questions
iFactory connects to existing SCADA, PLC, and telemetry systems through standard industrial communication protocols including Modbus, OPC-UA, MQTT, and API-based integrations. The platform reads pump start/stop status, run hours, power draw, wet well level, and flow data from existing sensors and control systems without requiring sensor replacement or control system modification. For flood gates, the platform ingests gate position sensors, cycle count, control system communication status, and seal pressure readings where instrumented. For levee monitoring, the platform accepts data from piezometers, settlement monitors, seepage meters, and visual inspection records uploaded from mobile devices. The integration layer is designed to complement existing systems rather than replace them — the objective is to unify data from disparate sources into a single readiness operations centre. Talk to an expert to discuss how iFactory can integrate with your existing flood control telemetry and control infrastructure.
The most effective starting point is the readiness baseline assessment — identify the highest-criticality pump stations, flood gates, and levee segments in your flood control network — those whose failure during a storm event would cause the greatest consequences for public safety, property protection, and infrastructure operability. Deploy continuous monitoring connectivity to these priority assets first, establishing readiness score baselines and AI-driven anomaly detection parameters. Configure the unified readiness dashboard to show these priority assets prominently, with the remaining assets added in subsequent deployment phases. Run the first readiness drill against the live dashboard within the first month of deployment, using the drill to validate data accuracy, test team response to the new interface, and identify any integration gaps. Early success with priority assets builds organisational confidence in the readiness monitoring approach and generates the data needed to make the case for expanding coverage across the full asset inventory. Book a Demo to discuss how the readiness baseline assessment and priority asset deployment can be structured for your flood control network.
Traditional SCADA alarm systems use static thresholds — a wet well high alarm triggers at a fixed water level regardless of whether it is raining. During a storm, every station in the network generates a wet well high alarm simultaneously, producing an alarm flood that overwhelms operators and buries genuine fault notifications. iFactory's AI-driven alerting learns each asset's normal operating envelope by analysing historical telemetry data — pump start/stop patterns, runtime distributions, power draw profiles, and wet well level variations — correlated with local rainfall and hydrological data. The AI model dynamically adjusts threshold expectations based on current weather conditions: a rising wet well level during heavy rain is expected and does not trigger an alert, while the same wet well level during dry weather triggers a descriptive alert identifying the specific anomaly — such as "inflow detected during dry period, possible stormwater infiltration or illegal connection." Each alert includes contextual information — what the system detected, why it is outside normal parameters, and what the likely issue is — enabling operators to prioritise response based on genuine risk rather than alarm volume. This approach typically reduces alert volume by 70-90% during storm events while increasing the proportion of alerts that correspond to action-requiring conditions. Book a Demo to see AI-driven dynamic alerting configured for your pump station and flood gate assets.
iFactory provides a structured levee asset management layer that tracks each levee segment's inspection history, monitoring instrumentation data, maintenance actions, and risk assessment status. The platform accepts data from piezometers, settlement monuments, seepage monitoring points, and visual inspection checklists completed via mobile devices — creating a longitudinal condition record for each segment. Inspection findings are recorded against standardised metrics — crest elevation, slope condition, vegetation cover, animal burrow activity, seepage observations, and structural integrity notes — with photographs and GPS location data attached to each observation. When inspection findings or monitoring data indicate a condition change — such as increased seepage flow at a monitoring point or settlement beyond the expected range — the platform generates a condition alert and adds the segment to a priority review list. The longitudinal record supports levee safety programme documentation requirements by providing an auditable trail of inspection frequency, condition monitoring, maintenance actions, and risk assessment updates — demonstrating to regulators and funding agencies that the levee portfolio is actively managed based on condition data rather than calendar-based assumptions. Talk to an expert to discuss levee monitoring configuration for your flood protection system.
24,000 Miles of Levees, 37,000 Pump Stations, and a Climate That Is Testing Every One of Them. Readiness Is No Longer Annual. It Is Continuous.
iFactory gives every level of your flood control operation the right readiness data, at the right time, in the right format — and gives operations directors the continuous intelligence infrastructure to build a programme where verified readiness is the baseline and emergency discovery is the exception.