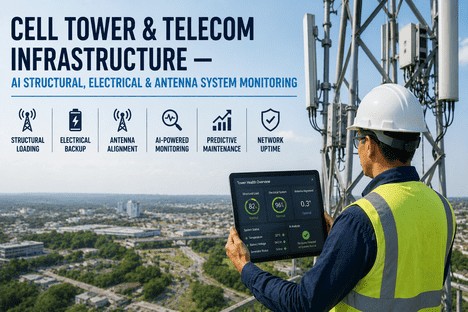
Cell Tower & Telecom Infrastructure — AI Structural, Electrical & Antenna System Monitoring
By Grace on June 23, 2026
The average enterprise telecom outage costs between $5,600 and $14,056 per minute. With a typical outage lasting three to four hours, a single failure can exceed one million dollars in lost revenue, SLA penalties, and emergency repair costs. The United States alone operates over 158,000 purpose-built cellular towers, nearly 255,000 macrocell sites, and more than one million small cell nodes — and every one of these assets requires continuous monitoring, structural inspection, electrical verification, and antenna system calibration. Yet most telecom infrastructure maintenance today remains reactive: a tower climbs only after an alarm triggers, a backup generator is tested only after a power failure exposes its fault, and an antenna is realigned only after subscribers report dropped calls. The gap between the scale of telecom infrastructure and the intelligence applied to its maintenance is not a technology gap — it is a visibility and process gap. Maintenance managers who have deployed AI monitoring platforms report that the data alone changes nothing. What changes outcomes is the operational discipline built around the data: whether technicians respond to threshold alerts before failures occur, whether structural trend analysis informs inspection scheduling, whether electrical backup systems are verified on condition rather than calendar cycles, and whether leadership holds the operation accountable to uptime metrics rather than reactive narratives. Building an AI-driven telecom infrastructure maintenance programme is not a single software deployment — it is a sustained operational transformation with defined stages, deliberate process change, and a KPI framework that connects real-time tower data to network-wide performance outcomes. This guide is written for maintenance managers and telecom infrastructure leaders at the point of making that transition.
TELECOM AI MONITORING · STRUCTURAL HEALTH · ELECTRICAL BACKUP · ANTENNA SYSTEMS · PREDICTIVE MAINTENANCE
The Tower Is the Asset. The Data Is the Intelligence. iFactory Monitors Both.
iFactory's Telecom Infrastructure Monitoring platform gives maintenance managers real-time visibility into structural loading, electrical backup health, antenna alignment, and asset condition — with AI-driven threshold alerts that turn tower data into proactive maintenance decisions.
Average cost per minute of unplanned telecom network downtime — a single 4-hour outage can exceed $1M in direct and indirect losses
1.2M+
Cellular infrastructure sites across the US — towers, macrocells, outdoor and indoor small cells — requiring structural and electrical monitoring
$65B
Annual US wireless infrastructure investment — construction, maintenance, and operations — with maintenance spend growing as build spending declines
43%
Network downtime reduction achieved by AI-driven predictive maintenance — with 92.7% failure prediction accuracy across telecom equipment types
Why Traditional Telecom Infrastructure Maintenance Is No Longer Sustainable
The telecom infrastructure landscape has changed faster than the maintenance models supporting it. With 5G densification adding thousands of small cells, rooftop sites, and indoor nodes each year, the asset base requiring monitoring has become too large, too distributed, and too critical to manage with calendar-based inspections and reactive repair models. Three structural failures in traditional telecom maintenance appear in nearly every organisation that has not yet adopted AI-driven monitoring.
01
Calendar-Based Inspections Miss the Real Failure Signals
Scheduling tower inspections on a fixed 12-month or 24-month cycle assumes that asset condition degrades at a uniform rate. In reality, structural loading changes with every tenant addition, antenna wind load shifts with every equipment swap, and electrical backup system health degrades in nonlinear steps — a generator that passed its annual load test can fail during the next grid event. Calendar-based maintenance creates the appearance of compliance without the reality of condition awareness.
02
Reactive Repairs Are the Most Expensive Form of Maintenance
When a tower site goes down unexpectedly, the cost is not limited to the repair itself. Emergency dispatch, after-hours labour, customer SLA credits, and the cascading impact on subscriber trust multiply the expense by three to five times compared to a scheduled intervention. Industry data shows that 40% of telecom outages are preventable through proactive monitoring — yet most operators continue to allocate budget to reactive repairs rather than predictive prevention.
03
Data Exists Across Silos but Never Reaches the Decision-Maker
Structural engineers maintain loading calculations. Electrical teams log generator test results. RF engineers track antenna alignment and signal metrics. These datasets exist in separate systems, managed by separate teams, reviewed on separate schedules. The maintenance manager who needs a unified view of tower health — structural integrity plus electrical readiness plus RF performance — has no single source of truth. The result is decisions made on incomplete information and failures that could have been prevented by correlating data that already existed.
REAL-TIME TOWER MONITORING · CONDITION-BASED ALERTS · ASSET HEALTH DASHBOARD
A Calendar Is Not a Maintenance Strategy. iFactory Gives You Real-Time Asset Intelligence.
iFactory aggregates structural, electrical, and RF data into a single asset health dashboard — with AI-driven threshold alerts that tell you what needs attention and when, not what the calendar says should be inspected.
The Telecom Infrastructure Monitoring Maturity Model — Four Stages Every Operator Passes Through
Knowing where your operation sits on the monitoring maturity curve is the starting point for any infrastructure reliability programme. Most telecom infrastructure operators are at Stage 1 or Stage 2. The organisations consistently outperforming on network uptime, mean time to repair, and maintenance cost per site are operating at Stage 3 or Stage 4. The difference is not the sensors they have deployed — it is the operational intelligence they have built around them.
TELECOM INFRASTRUCTURE MONITORING MATURITY MODEL
Stage
Maintenance Approach
Data & Monitoring
Leadership Priority
Stage 1
Reactive
Tower sites are repaired after failure. No monitoring infrastructure. Dispatch is triggered by customer complaints or network alarm systems.
No sensor data. Paper inspection logs. Alarms are siloed and not correlated across structural, electrical, or RF domains.
Deploy baseline monitoring. Any IoT sensor deployment or CMMS implementation is a step forward from this stage.
Stage 2
Scheduled
Calendar-based inspections at fixed intervals. Preventive maintenance follows manufacturer schedules regardless of actual asset condition.
Basic sensor data collected but reviewed periodically. Spreadsheets or legacy CMMS track inspection due dates and completion status.
Move from calendar-based to condition-based triggers. Establish real-time threshold alerts for critical parameters.
Stage 3
Condition-Based
Maintenance interventions are triggered by real-time sensor thresholds. Structural loading, battery voltage, and antenna alignment are continuously monitored.
Real-time IoT sensor data feeding a unified dashboard. Trend analytics identify degradation patterns before failure thresholds are reached.
Build cross-domain correlation. Combine structural, electrical, and RF data into single asset health scores per tower site.
Stage 4
Predictive
AI-driven failure prediction schedules interventions before failure indicators emerge. Resource allocation responds to predicted asset degradation curves.
Machine learning models trained on historical failure data. Anomaly detection across all monitoring domains. Automated work order generation.
Integrate predictive insights into strategic planning. Use asset lifecycle trends for CapEx planning and vendor performance benchmarking.
The Six-Domain Monitoring Framework — What Every Telecom Site Needs to Track
A comprehensive telecom infrastructure monitoring programme covers six critical domains. Each domain connects to a specific failure mode, a sensor or data source, and a decision threshold. iFactory's platform aggregates data from all six domains into a single asset health dashboard with domain-specific alerting and cross-domain correlation analytics.
S
Structural Loading
Monitor tower deflection, vibration, ice loading, and wind load changes after every tenant equipment addition. Trigger alerts when loading approaches 85% of design capacity.
E
Electrical Backup
Track battery string voltage, generator start reliability, fuel level trend, and transfer switch status. Identify failing cells 30-60 days before backup capacity is compromised.
A
Antenna Systems
Monitor azimuth, tilt, VSWR, and signal strength across all sectors. Detect misalignment from wind events, thermal cycling, or structural settlement before subscribers report degraded service.
P
Power & Environment
Track mains power quality, rectifier efficiency, cabinet temperature, humidity, and intrusion detection. Environmental anomalies often precede electrical and electronic failures by weeks.
F
Foundation & Grounding
Monitor ground resistance, foundation settlement, guy wire tension, and corrosion rates. Grounding degradation is one of the most commonly missed precursors to lightning damage and equipment failure.
C
Compliance & Safety
Track FCC lighting compliance, OSHA fall protection inspection status, RF exposure monitoring, and regulatory filing deadlines. Automate compliance documentation from sensor and inspection data.
The Maintenance Manager's Playbook — Six Actions to Deploy AI-Driven Telecom Infrastructure Monitoring
Operational transformation does not happen through platform deployment alone. It happens through deliberate process change, visible accountability mechanisms, and the gradual replacement of calendar-based decisions with condition-based ones. These six actions distinguish telecom operators that successfully deploy AI monitoring from those that install sensors and see no reliability improvement.
01
Foundation Step
Map Your Asset Hierarchy Before You Configure a Single Sensor
Before deploying IoT sensors or configuring a monitoring dashboard, map every telecom site in your portfolio with its full asset hierarchy: tower type and design capacity, installed equipment list with weights and wind load contributions, electrical backup configuration including battery bank specifications and generator model, antenna count and orientation per sector, and grounding system design. Without this baseline, sensor data has no context. A 2mm vibration reading means nothing if you do not know whether it is within the tower's original design tolerance. iFactory's asset hierarchy module lets you build this digital twin for every site before connecting a single data stream.
02
Threshold Configuration
Define Alert Thresholds for Every Critical Parameter by Asset Type
A threshold that is set too loosely generates no alerts until failure has already occurred. A threshold set too tightly generates alert fatigue and trains your team to ignore the dashboard. For each monitoring domain, define three-level thresholds: a warning level that triggers a dashboard flag and a scheduled review, an alert level that generates a notification to the responsible technician within the shift, and a critical level that triggers immediate dispatch. Battery voltage sag, structural vibration amplitude, antenna VSWR, generator start delay, and ground resistance are examples of parameters that benefit from graduated thresholds. iFactory's threshold engine supports configurable multi-level alerting per asset type and per site class.
03
Workflow Integration
Connect Monitoring Alerts to Work Order Generation and Dispatch
An alert that does not trigger a work order is just noise in the system. Configure your monitoring platform to generate work orders automatically when threshold breaches occur — with the asset history, sensor data context, and recommended action pre-populated. When a battery string voltage drops to the warning threshold, the system should generate a work order for the site, assign it to the nearest available technician with battery certification, and attach the last 30 days of voltage trend data. This closed-loop workflow — alert to work order to dispatch to closure to verification — is what separates monitoring that changes outcomes from monitoring that generates reports. iFactory's platform includes native work order generation tied to threshold configuration.
04
Cross-Domain Correlation
Correlate Structural, Electrical, and RF Data for Root Cause Intelligence
The most valuable insights in telecom infrastructure monitoring come from cross-domain correlation. A VSWR alert on an antenna may be caused by a connector issue, but when correlated with a vibration spike on the same tower section from the same timestamp, the root cause shifts to structural movement. A battery voltage sag that coincides with a temperature spike in the cabinet is a different problem than a voltage sag with normal cabinet temperature. Configure your monitoring platform to surface correlated events — not just isolated parameter alerts. When cross-domain correlation is in place, the maintenance team addresses root causes rather than symptoms. iFactory's analytics engine correlates events across all six monitoring domains automatically.
05
Performance Review
Establish a Weekly Site Health Review Ritual Using the Unified Dashboard
The most powerful signal a maintenance manager sends about the importance of monitoring is how they open weekly operations reviews. If the weekly site health meeting begins by opening the iFactory dashboard and reviewing the previous week's alerts, threshold breaches, and work order completion rates, the message to every technician and contractor is unambiguous: data is how we manage site reliability here. Establish a standing protocol where the first ten minutes of the weekly review covers sites in alert status, sites approaching threshold, work order closure rate for the previous week, and trend comparisons against the prior period. Managers who do this consistently see their teams begin reviewing dashboards before they arrive at the meeting, rather than discovering issues during the call.
06
Continuous Improvement
Review Alert Accuracy and Thresholds Quarterly — Refine, Don't Freeze
A monitoring programme that does not evolve its thresholds becomes less effective over time. As you accumulate sensor data and work order history, you will discover that some thresholds were set too conservatively (generating false alerts that trained the team to ignore them) while others were set too permissively (missing early indicators of failure). A quarterly threshold review asks: which alerts triggered false positives and need adjustment? Which failures occurred without a preceding alert and need a new threshold parameter? Are there new asset types or equipment configurations that require different threshold profiles? Organisations that treat their monitoring configuration as a living system — reviewed and refined quarterly — see sustained improvement in alert-to-failure lead time and reduction in false positive rates.
The Telecom Infrastructure KPI Framework — What to Measure at Every Level
The following KPI taxonomy follows the monitoring-to-decision principle: every metric connects to a specific operational decision, a named decision-maker, and a defined response trigger. iFactory's Telecom Infrastructure Dashboard surfaces all of these in real time, with role-based views, configurable threshold alerts, and trend analytics at every level of the operation.
Site Technician
Sites with active alerts requiring intervention — prioritised by severity and time since first alert
Work order completion rate — personal performance against assigned PM and corrective work orders
First-time fix rate — percentage of site visits that resolve all flagged issues without return trips
Maintenance Supervisor
Alert-to-dispatch time — average minutes from threshold breach to technician assignment by region
Work order age distribution — percentage of open orders within 24h, 48h, and 72h windows by site tier
False positive rate — percentage of alerts that did not result in a verifiable issue requiring intervention
Operations Manager
Site uptime by tier — percentage of time each site class met SLA uptime targets, trended monthly
Maintenance cost per site — 12-month rolling average with variance analysis by asset class and region
PM-to-reactive ratio — percentage of total work orders that were preventive vs. corrective, by period
Infrastructure Director
Network-wide availability trend — weighted uptime across all sites with root cause breakdown of downtime events
Mean time between failures by asset class — trend analysis identifying degrading asset populations before they drive outage spikes
CapEx replacement forecast accuracy — predicted vs. actual asset replacement timing driven by condition trend data
We deployed IoT sensors across two hundred tower sites over nine months. At the end of the deployment, we had real-time data on structural vibration, battery voltage, and cabinet temperature across our entire portfolio. What we did not have was a single site health issue resolved faster than before. The data was arriving but nobody had defined what to do with a voltage sag reading at 2am, or who was responsible for reviewing vibration trends, or what threshold should trigger a generator dispatch. What changed the trajectory was when I, as Infrastructure Maintenance Manager, stopped asking for weekly reports and started using the iFactory dashboard to open the morning stand-up. Within six weeks, my supervisors were reviewing their sites before the stand-up so they could explain every alert. Within three months, we detected a battery bank degradation pattern across fifteen sites that would have caused simultaneous outages within sixty days. The sensors did not change the operation. I changed the operation. The platform made it possible.
The AI-driven telecom infrastructure monitoring that separates high-performing operators from the rest is not built by deploying sensors and hoping for insights. It is built by managers who change how they define thresholds, how they connect alerts to work orders, how they correlate data across domains, and how they run weekly site health reviews. With telecom downtime costing up to $14,000 per minute and infrastructure assets expanding faster than most maintenance organisations can scale, the operators who close the gap between data collection and decision-making will outperform on every metric that matters: network uptime, maintenance cost per site, mean time to repair, and asset lifecycle ROI. The platform makes it possible. The leadership makes it real.
iFactory's Telecom Infrastructure Monitoring platform gives maintenance managers and infrastructure directors the unified asset intelligence to build a reliability culture — with six-domain monitoring, multi-level threshold alerting, cross-domain correlation analytics, and automated work order generation that turns real-time data into proactive maintenance outcomes. Book a Demo to see how the platform's monitoring framework maps to your infrastructure portfolio, or talk to an expert to begin building your AI-driven telecom infrastructure monitoring programme with iFactory today.
Frequently Asked Questions
iFactory's platform supports monitoring across all common telecom infrastructure asset classes: lattice towers, monopoles, guyed towers, stealth towers, rooftop sites, small cell poles, and indoor distributed antenna system nodes. The six-domain monitoring framework applies to any site type, with domain-specific sensors configured per asset class. The platform's sensor-agnostic architecture integrates with existing IoT devices, third-party monitoring systems, and legacy CMMS platforms, so you are not required to replace your current sensor infrastructure. Talk to an expert to review your asset portfolio and confirm platform compatibility with your existing monitoring infrastructure.
iFactory supports threshold configuration per asset type, per site class, and per individual asset. Structural loading thresholds account for tower design capacity, tenant configuration, and regulatory jurisdiction. Electrical thresholds are configurable by battery chemistry, generator model, and rectifier type. Antenna thresholds vary by frequency band, sector configuration, and make-model. Thresholds can be set at three levels — warning, alert, critical — with independent notification rules per level. The platform also supports adaptive threshold learning, where the system analyses the first 30-60 days of sensor data to suggest optimised threshold values based on observed operating ranges. Book a Demo to see how threshold configuration works across your specific asset types.
Deployment timeline depends on portfolio size, existing sensor infrastructure, and integration complexity. For a typical portfolio of 50-200 sites with existing IoT sensors, platform configuration and data integration is completed within two to four weeks. For portfolios without existing sensors, hardware procurement and installation timelines vary by site accessibility and sensor scope. The asset hierarchy mapping and threshold configuration can proceed in parallel with sensor installation. Most operators begin seeing meaningful monitoring data within the first week of platform connection. Organisations that begin with the decision architecture exercise and weekly dashboard review in the first two weeks of deployment typically see measurable improvements in alert-to-dispatch time within 30-45 days. Book a Demo to discuss a deployment timeline specific to your portfolio size and monitoring requirements.
Yes. iFactory's platform is built with an API-first architecture and supports integration with leading CMMS platforms, network management systems (NMS), ERP systems, and accounting software. Common integrations include work order synchronisation with CMMS platforms, alarm forwarding to NMS dashboards, cost tracking to ERP systems, and SLA compliance reporting to customer management platforms. The platform also supports custom API integrations for organisations with proprietary systems. iFactory does not require replacement of existing systems — the platform is designed to layer monitoring intelligence on top of your current operational infrastructure and serve as the unified data layer across previously siloed systems. Talk to an expert to review your current systems and integration requirements.
Telecom Downtime Costs Up to $14,000 Per Minute. The Operators Who Monitor in Real Time Will Own the Network Reliability Advantage.
iFactory gives every level of your telecom infrastructure operation real-time asset intelligence — structural, electrical, antenna, power, foundation, and compliance monitoring in a single dashboard — with the threshold alerts and automated workflows that turn sensor data into proactive maintenance decisions.