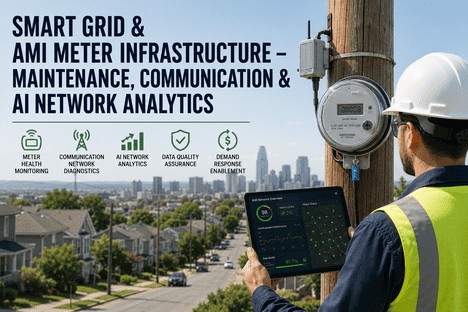
Smart Grid & AMI Meter Infrastructure — Maintenance, Communication & AI Network Analytics
By Grace on June 22, 2026
A utility with one million smart meters generates approximately 240 million interval reads every day. That data represents the most granular view of grid operations ever available to a distribution utility. Yet most operations directors report that less than ten percent of that data actively influences maintenance decisions, grid planning, or demand response execution. The meters are deployed. The head-end system is ingesting data. The MDM is storing it. But between the meter and the decision, the data passes through three vulnerable layers where quality degrades, latency accumulates, and visibility collapses. The problem is not that utilities lack data. It is that the infrastructure connecting data to decision has not been managed with the same discipline as the physical grid itself. For the Operations Director accountable for SAIDI, SAIFI, and the capital efficiency of the distribution network, the next frontier is not deploying more meters. It is managing the data infrastructure between the meter and the decision with the same rigour applied to the conductors and transformers that deliver power to customers.
240 Million Reads per Day. Less Than 10% Drive Decisions. iFactory Closes the Gap Between the Meter and the Decision.
iFactory's Smart Grid Analytics platform gives Operations Directors the tools to manage AMI data infrastructure with the same discipline as the physical grid — real-time meter health monitoring, automated data quality scoring, AI-driven fault prediction, and decision-ready dashboards that connect meter data directly to maintenance action.
The Data Pipeline — Where AMI Value Is Made and Where It Is Lost
Every AMI analytics programme depends on a four-stage data pipeline. When each stage performs correctly, the operation gains real-time visibility, accurate billing, and predictive insight. When any stage degrades, the entire analytics output becomes unreliable. The Operations Director who understands this pipeline controls the quality of every decision the organisation makes from its AMI investment.
Stage 1
Meter Reading
The meter captures interval data and transmits via RF mesh, cellular, or PLC to the head-end system.
Failure risk: 20-30% comm dropout
iFactory: Real-time read success per meter
Stage 2
Head-End Processing
The HES validates, decrypts, and formats meter data before sending to the MDM platform.
Failure risk: Clock drift & timestamp errors
iFactory: Interval completeness scoring
Stage 3
MDM Storage & Validation
The MDM stores validated interval data, manages billing, and feeds analytics platforms.
Failure risk: Pipeline latency >24 hours
iFactory: Data quality assurance layer
Stage 4
Analytics & Decision
AI models and dashboards transform validated data into maintenance insights and decision triggers.
Failure risk: Garbage in, garbage out
iFactory: Predictive alerts & KPI dashboards
$178B
Projected smart grid analytics market by 2034 at 12.8% CAGR — data-driven utilities will outperform peers on cost, reliability, and regulatory compliance
12.8%
Annual growth rate of the global smart grid analytics market — AMI analytics is the fastest-growing segment within this category
85M
Individually controlled smart street lights expected globally by 2029 — the AMI network is expanding faster than the analytics capacity to manage it
10%
Of AMI-generated data actively used for operational decisions — the rest is stored, estimated, or ignored by existing decision workflows
The Three Data Gaps That Undermine AMI Analytics — and How to Close Each One
The gap between meter installation and data-driven maintenance decisions is not a single problem. It is three distinct gaps — each with its own root cause, its own operational impact, and its own solution. The Operations Director who addresses all three builds an analytics capability that delivers consistent, trustworthy decision support.
The Three AMI Data Gaps and How iFactory Closes Them
Data Gap
What Causes It
Operational Impact
iFactory Solution
Completeness Gap
RF mesh collisions, cellular dead zones, concentrator failures, and battery-depleted endpoints cause meters to miss scheduled reads.
Estimated billing, unbilled revenue, invisible outages, and demand response events that underperform because participating meters are silent.
Real-time meter read success rate dashboard per meter, per collector, per zone. Automated work orders for meters below 95% read rate threshold.
Accuracy Gap
Clock drift, timestamp misalignment, duplicate intervals, and value corruption during HES-to-MDM transfer degrade data integrity.
Incorrect billing, unreliable loss analysis, fault models trained on corrupted data, and regulatory reporting that cannot be audited with confidence.
Automated data quality scoring — timestamp, interval count, value range, and gap detection per meter. Alerts fire when quality drops below 99.5%.
Latency Gap
Batch processing cycles, overnight MDM imports, and manual data export workflows delay data availability by hours or days.
Operations teams make decisions on data that is 24-48 hours stale. Real-time visibility is impossible. Storm response and DER management are compromised.
Data pipeline latency monitoring with alerts when end-to-end latency exceeds configurable thresholds. Streaming data architecture for sub-15-minute dashboard visibility.
From AMI 1.0 to AMI 2.0 — What Changes for the Operations Director
The industry is transitioning from AMI 1.0, where the meter's primary function was automated billing read replacement, to AMI 2.0, where the meter becomes a grid-edge sensor that feeds real-time operational intelligence into every layer of the distribution network. For the Operations Director, this transition changes what is expected of the AMI system and what the organisation can demand from its data.
AMI 1.0 — Billing Automation
Monthly or daily interval reads for billing accuracy
Remote disconnect and reconnect for service management
Basic tamper and outage detection alerts
Data reviewed in weekly or monthly reporting cycles
Limited integration with grid operations or DER management
Primary value: Billing efficiency and meter read cost reduction
AMI 2.0 — Grid Intelligence
Sub-15-minute interval data streaming for real-time grid visibility
Per-meter voltage sensing and power quality event recording
AI-driven anomaly detection for transformer loading, phase imbalance, and fault patterns
Predictive maintenance triggers that generate work orders from data patterns
Integrated DER management, EV charging visibility, and demand response optimization
Primary value: Grid reliability, predictive maintenance, and asset optimization
AMI 1.0 Replaced the Meter Reader. AMI 2.0 Replaces the Guess. iFactory Powers the Transition.
From billing automation to grid intelligence — iFactory gives Operations Directors the analytics infrastructure to make AMI 2.0 operational, with real-time data quality, AI-driven fault detection, and predictive maintenance workflows that turn meter data into grid reliability.
The Operations Director's Decision Framework — Which AMI Analytics Capabilities to Deploy and in What Order
Not all AMI analytics capabilities deliver equal value at all stages of organisational maturity. The Operations Director who sequences deployment correctly builds momentum, confidence, and measurable results at each phase. The director who attempts to deploy everything at once typically sees none of it adopted. The following framework shows the recommended sequence, the KPI that validates each phase, and the operational decision each phase enables.
Phase 1 · Weeks 1-3
Communication Health First
Deploy real-time meter read success monitoring. Every meter that has missed 48 hours of reads is flagged automatically. Field teams investigate communication failures by zone and technology type. The goal is 95%+ read success rate within the first 30 days.
Validation KPI: Meter read success rate >95%
Phase 2 · Weeks 4-6
Data Quality Assurance
Implement automated data quality scoring per meter. Validate interval completeness, timestamp accuracy, and value range integrity. Publish data quality score by zone and by collector. Replace estimated data with flagged gaps that operations can investigate.
Validation KPI: Interval completeness >99.5%
Phase 3 · Weeks 7-9
Predictive Anomaly Detection
Deploy machine learning models on validated interval data. Identify transformer overloading, voltage exceptions, phase imbalance, and unauthorized consumption patterns. Generate weekly anomaly summaries for engineering review.
Validation KPI: Detected anomalies validated >80%
Phase 4 · Weeks 10-12
Automated Decision Triggers
Configure risk-based thresholds that generate work orders automatically when asset failure probability exceeds defined levels. Establish director-level weekly review of predictive alert disposition rate and maintenance action completion.
Validation KPI: Alert-to-action conversion >70%
The Revenue Recovery That Was Hiding in the Communication Data
A south-eastern US utility with 420,000 AMI meters deployed the communication health dashboard and discovered that 8,400 meters — two percent of the installed base — had been non-communicating for an average of 47 days. Those meters were being billed on estimated consumption, under-reporting actual usage by an average of 22 percent. The unbilled revenue from those 8,400 meters totalled $1.4 million annually. Restoring communication to those meters was not a capital project. It was a configuration issue: a firmware version mismatch on five concentrator nodes that had gone unnoticed for eight months. The Operations Director noted that the communication health dashboard, deployed in the first 10 days of the analytics programme, had generated more revenue recovery in its first month than the projected annual savings from the entire analytics investment.
Conclusion
The smart grid analytics market is heading toward $178 billion by 2034, and the utilities that capture the full value of their AMI investment will be those whose Operations Directors treat the data pipeline with the same discipline as the physical grid. The gap between the 240 million daily meter reads and the decisions those reads should inform is not a technology gap. It is a management gap — and it closes when directors deploy the right sequence of capabilities: communication health first, data quality second, anomaly detection third, and automated decision triggers fourth. Each phase builds on the one before. Each phase delivers measurable results that fund the next.
iFactory's Smart Grid Analytics platform gives Operations Directors the complete toolkit for this sequence — real-time meter communication health monitoring, automated data quality scoring, AI-driven anomaly detection, and predictive maintenance triggers that connect AMI data directly to operational action. Book a Demo to see how the platform maps to your AMI network architecture and deployment timeline, or Talk to an Expert to discuss your distribution operation's analytics maturity pathway.
Frequently Asked Questions
iFactory integrates through standard API connectors that support the most common HES and MDM platforms including Itron, Landis+Gyr, Sensus, Aclara, and Siemens, as well as DLMS/COSEM and IEC 62056 protocol-compliant systems. The platform reads interval consumption data, meter events, voltage readings, and communication status logs without requiring changes to the existing meter infrastructure or head-end configuration. For utilities running hybrid AMI environments with multiple meter technologies or communication protocols, iFactory provides a unified data ingestion layer that normalizes inputs from all sources into consistent metrics. Talk to an Expert to discuss your specific HES and MDM integration requirements and timelines.
The platform applies a multi-layer validation pipeline before any data enters the analytics engine. Checks include interval completeness (expected versus received intervals per meter per day), timestamp accuracy against head-end reference time with automated clock drift detection, value range validation (consumption and voltage readings within expected operational parameters), duplicate interval detection, and consecutive missing interval gap identification. Each meter receives a daily data quality score from zero to 100 percent. Meters scoring below 95 percent are flagged in the communication health dashboard for investigation. This ensures that every KPI calculation and predictive model operates on validated data rather than estimated or corrupted records. Talk to an Expert to configure the data quality scoring parameters for your specific AMI meter population.
Yes. iFactory is communication-technology-agnostic at the analytics layer. Whether your AMI deployment uses RF mesh, cellular (4G, 5G, NB-IoT, LTE-M), power line carrier, or a hybrid combination, the platform ingests data from the head-end system that abstracts the communication layer. The communication health dashboard tracks performance separately by technology type — enabling the operations team to identify whether communication failures are technology-specific, such as a cellular carrier issue in a geographic zone, or infrastructure-wide, such as a concentrator failure affecting all meters on that node. This technology-aware visibility is critical for directing field resources to the correct root cause rather than treating every communication failure as an individual meter problem. Book a Demo to see how the platform handles multi-technology AMI environments with a live demonstration using your network's data profile.
For a utility-scale deployment covering 100,000 to one million meters, the standard four-phase sequence completes within twelve weeks. Phase one — communication health dashboard — is operational within the first two weeks after head-end API connection, with the first meter read success data visible within days of pipeline validation. Phase two data quality scoring activates in weeks three to four. Phase three anomaly detection models begin generating insights in weeks five to eight after sufficient validated interval data has accumulated. Phase four automated decision triggers are configured and operational by weeks nine to twelve. The first director-level KPI dashboard is typically available for operational review within the first thirty days. The deployment timeline for utilities with complex multi-vendor, multi-technology AMI environments may extend by two to four weeks for additional integration validation. Book a Demo to build a deployment timeline specific to your utility's meter count, technology mix, and integration landscape.
240 Million Reads per Day. Less Than 10% Drive Decisions. iFactory Exists to Change That Ratio.
The only AMI analytics platform built for Operations Directors — real-time meter health, data quality assurance, AI-driven anomaly detection, and predictive maintenance triggers. The infrastructure between your meters and the decisions that protect your grid.