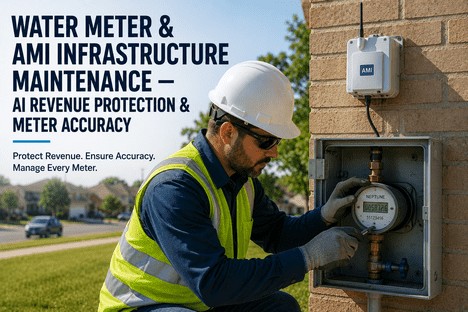
Water Meter & AMI Infrastructure Maintenance — AI Revenue Protection & Meter Accuracy
By Grace on June 19, 2026
Every water utility knows the shape of the revenue gap: production metering at the treatment plant shows 100 million gallons leaving the system, but customer billing totals account for only 70 million. Non-revenue water claims the rest — and a significant fraction of that 30% gap does not come from main breaks, hydrant flushing, or tank overflow. It comes from meters that have stopped measuring accurately. A meter fleet with an average age of 20 years, untested for calibration, silently under-registers consumption at a rate of 1 to 3% per year of service life. The utility manager sees the production-to-billing gap on the monthly report. What remains invisible is which meters are producing the gap, by how much, and whether the loss is accelerating. This is the structural deficit in AMI deployments today — the smart network collects granular consumption data from every endpoint, but the analytics layer that should convert that data into revenue-protecting action is either missing or operates in a separate system that nobody has staffed to monitor. iFactory closes this gap by connecting what the AMI already knows to the operational actions that protect revenue — automatically.
Meter Accuracy Monitoring · Tamper Detection · AMI Network Health · Predictive Replacement Scheduling
The Average Water Utility Loses $1.2 Million Per Year to Meters That Under-Read. Most Never Identify Which Ones.
iFactory's AI-powered AMI analytics platform converts existing meter data into revenue-protecting operational actions — accuracy deterioration trending, tamper detection, network health monitoring, and predictive replacement scheduling — all from the data your AMI head-end already collects.
Annual global revenue lost to non-revenue water — 30% of total water system input volume, with meter inaccuracy as a primary, undetected contributor
1-3%
Annual meter accuracy decline for residential positive displacement meters — a compounding loss rate that doubles every 20-24 months if unaddressed
23%
Of meters in a typical mid-size utility fleet under-read by more than 3% — a threshold that triggers AWWA compliance concern and significant unbilled revenue
71%
Average communication success rate in AMI systems without active network health monitoring — meaning 29% of endpoints may be producing estimated reads or no reads at all
The Utility Manager's Core Problem: Revenue Leaks That Compound Silently
The AMI business case promised improved billing accuracy, reduced non-revenue water, and operational efficiency gains. What the business case did not account for is that AMI infrastructure has its own failure modes — accuracy drift in the meter, battery depletion in the endpoint, communication degradation in the network, and tampering at the customer site. Each failure mode produces a characteristic revenue loss pattern, and each one is invisible without an analytics layer that monitors meter performance continuously rather than testing meters on a statistical sampling cycle that catches drift months after it begins. The utility manager who discovers a block of under-registering meters during a quarterly audit has already lost the revenue for that quarter. The question is not whether the meter fleet is losing revenue. It is how much, from which meters, and how fast the gap is widening.
Three Dimensions of AMI Revenue Leakage — and How AI-Powered Analytics Resolves Each One
01
Meter Accuracy Deterioration
Mechanical meter components drift from calibrated accuracy under normal operating conditions. AWWA Class II standards permit a 1.5% accuracy tolerance — but drift beyond this level creates systematic billing under-registration that compounds until testing catches it. The typical utility tests meters on a statistical sampling cycle of 5 to 10 years. In that window, a meter drifting at 1.5% per year creates a cumulative revenue loss of 7.5 to 15% on that meter before replacement.
iFactory fix: Continuous accuracy trending from consumption pattern analysis flags meters exceeding drift threshold — no sampling cycle delay.
02
AMI Network Communication Failure
An AMI endpoint that cannot communicate produces estimated reads — and estimated reads systematically undercount consumption because they apply historical averages to periods when consumption may have changed. A meter that drops from 99% read success to 94% is showing early signs of battery depletion, antenna degradation, or mesh coverage loss. Without active read-rate monitoring per endpoint, this decline continues until the billing cycle produces a block of estimates — and the revenue gap is already recorded.
iFactory fix: Read success trending per endpoint and per network sector — field replacement queue ranked by communication failure risk.
03
Tampering and Unauthorised Consumption
Meter tampering — physical bypass, mechanical manipulation, or magnetic interference — produces a characteristic consumption signature that is invisible to the billing system but detectable through pattern analysis. A meter showing a sudden and sustained drop in consumption relative to historical baseline, combined with tamper event flags from the AMI head-end, indicates likely revenue theft. Without automated correlation of tamper events, consumption patterns, and billing history, utilities investigate tampering reactively — after revenue has already been lost over multiple billing cycles.
iFactory fix: Cross-correlation of tamper flags, consumption anomalies, and billing exceptions — ranked priority queue for field investigation.
The iFactory AMI Analytics Platform: Three Capability Layers for Revenue Protection
iFactory activates four operational analytics capabilities from the data your AMI head-end system already stores — without requiring AMI system replacement, network upgrade, or additional field hardware. Each capability converts existing AMI data into a specific revenue-protecting operational output. All four run simultaneously and update continuously.
Capability 01
Meter Accuracy Trending & Replacement Scheduling
iFactory analyses consumption patterns per meter against zonal averages, historical baselines, and similar-property cohorts to identify meters whose registered consumption has declined relative to expected usage — the characteristic signature of calibration drift. Meters exceeding configurable accuracy-risk thresholds are flagged for testing or replacement, ranked by estimated revenue impact. This replaces the statistical sampling approach — which catches drift in some meters months after it begins — with continuous risk scoring across the entire meter fleet.
Continuous drift detection
Revenue-ranked replacement queue
AWWA compliance tracking
Capability 02
AMI Network Health Monitoring
iFactory tracks read success rate per meter and per network sector continuously, identifying meters and zones where communication reliability is degrading before it reaches billing-impact thresholds. The system generates a field replacement priority queue ranked by communication failure risk, with battery life projections (where endpoint battery telemetry is available) that enable proactive battery replacement 12 to 18 months before depletion. For AMI networks targeting 98 to 99% read rates, the iFactory dashboard surfaces every meter that has dropped below threshold — and the trend direction that tells the utility manager whether the gap is widening.
Per-endpoint read rate trend
Battery life prediction
Network sector health dashboard
Capability 03
Tamper Detection & Revenue Theft Prevention
iFactory correlates three data streams — tamper event flags from the AMI head-end, consumption pattern anomalies, and billing history — to identify meters with a high probability of revenue theft. A meter showing repeated tamper event flags, a sustained consumption decline relative to historical baseline, and a billing history with zero or very low charges in consecutive cycles is unlikely to be a calibration issue. The system generates an investigation queue ranked by revenue recovery potential and provides the documentation trail needed for enforcement action — without requiring manual cross-referencing of three separate systems.
Cross-stream event correlation
Prioritised investigation queue
Enforcement documentation trail
Capability 04
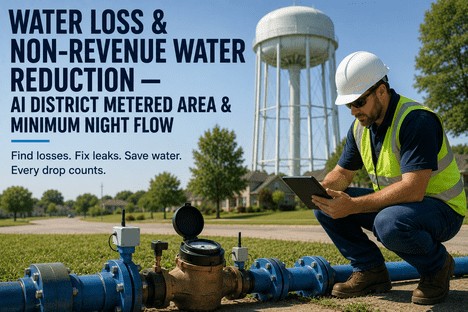
DMA Leak Detection & NRW Reduction
iFactory performs night minimum flow analysis per District Metered Area (DMA) using AMI consumption data to identify zones with elevated leakage levels. By establishing a night flow baseline per DMA and monitoring deviations, the system detects new leaks within 7 to 14 days of occurrence — compared to the weeks or months required for traditional zone-based mass balance approaches. Combined with meter accuracy trending and network health data, the DMA leak detection layer gives utility managers a complete NRW picture: the portion lost to physical leakage, the portion lost to meter inaccuracy, and the portion lost to communication failure or tampering.
Night minimum flow analysis
7-14 day leak detection
Complete NRW decomposition
Every AMI System Generates Revenue-Protecting Data. Most Utilities Never Extract It. iFactory Activates It From Day One.
iFactory connects to your AMI head-end via API and activates all four analytics capabilities within 7 to 14 days — without AMI system modification, network upgrade, or additional field hardware. Average documented outcome: 23% NRW reduction, $1.2M annual revenue recovery, 99.1% read rate.
The Utility Manager Dashboard: Revenue Protection in One View
The utility manager view of iFactory is organised around the operational questions that determine revenue integrity: Which meters are under-performing and by how much? Where is the AMI network degrading? Is non-revenue water trending up or down across the service zone? And when the next performance report is due, is the data ready?
Dashboard View 01
Meter Fleet Health by Age Cohort and Accuracy Tier
Every meter in the fleet visualised by installation year, model type, accuracy risk score, and AMI communication status. Meters approaching end-of-service life or exceeding accuracy drift thresholds are flagged automatically, ranked by estimated annual revenue impact. Utility managers see at a glance which replacement projects will recover the most unbilled revenue first.
Utility action: Approve revenue-ranked replacement schedule from dashboard — no spreadsheet compilation required.
Dashboard View 02
NRW Decomposition: Leakage vs. Accuracy vs. Communication vs. Tampering
The NRW dashboard breaks the non-revenue water gap into its four component categories — physical leakage, meter accuracy loss, communication failure, and tampering — so utility managers know where to direct field resources. A utility with NRW dominated by meter accuracy loss invests in a different replacement strategy than one dominated by physical leaks in aging distribution infrastructure.
Utility action: Allocate field crew and replacement budget by NRW category — data-driven, not guess-driven.
Dashboard View 03
AMI Network Performance by Sector and Endpoint
Live read-rate performance per network sector and per individual endpoint, with trend lines that show whether communication reliability is improving or declining. Sectors with read rates trending downward are flagged for field investigation before they cross the billing threshold. Battery life projections per endpoint generate proactive replacement schedules 12 to 18 months before depletion.
Utility action: Dispatch field crew to degrading sectors before read failures impact billing cycle.
Dashboard View 04
Revenue Impact Analysis and Recovery Tracking
Quantified revenue impact of meter accuracy drift, non-read meters, and billing exceptions — with recovery tracking after meter replacement, network repair, or tamper intervention. Utility managers report revenue recovery data to finance and board-level stakeholders with automated reports that show the financial return on meter replacement and AMI maintenance investments.
Utility action: Report revenue recovery to board with automated impact data — no manual calculation required.
Dashboard View 05
Tamper Investigation Queue with Priority Ranking
Cross-correlated investigation queue ranked by revenue recovery potential — combining tamper event frequency, consumption anomaly severity, billing history, and payment behaviour into a single priority score. Field teams receive a ranked list of meters to investigate, with the evidence package for each case pre-assembled from AMI data, consumption history, and billing records.
All analytics outputs — meter accuracy risk scores, network health trends, tamper investigation records, NRW decomposition, revenue recovery data — are exportable in structured formats for board reporting, regulatory compliance, and audit documentation. Utility managers generate performance reports for any date range, service zone, or meter cohort without manual data compilation.
Utility action: Export full performance package on demand — board-ready reporting in one click.
We discovered during a revenue audit that 23% of our 84,000 residential meters were under-reading by more than 3% — silently losing $1.4 million in unbilled water every year. The oldest meters, installed between 1998 and 2005, had never been tested for accuracy since installation. We had no digital record of when most meters were installed, what model they were, or whether they had ever been calibrated. Replacement decisions were made by street address when a customer complained — not by meter age, accuracy data, or lifecycle cost. The iFactory analytics platform gave us the first complete picture of our meter fleet health. Within six months of deployment, we replaced the highest-revenue-impact meters and recovered over $800,000 in annual unbilled revenue — and we now have a continuous accuracy monitoring programme that catches drift before it compounds.
— Utility Operations Director, Mid-Size Municipal Water Utility — AMI Deployment, 84,000 Endpoints
Conclusion
Revenue protection in water metering is not a meter replacement problem — it is an analytics architecture problem. When the AMI system collects granular consumption data from every endpoint but no analytics layer converts that data into accuracy drift detection, network health monitoring, tamper identification, or leak discovery, the revenue gap widens silently until a quarterly audit or a customer complaint reveals it — and by then, the loss has compounded across multiple billing cycles. The utility manager who discovers an accuracy problem at audit time has already lost that revenue with no recovery mechanism.
The industry evidence is consistent across AMI deployments of every scale: utilities that monitor meter accuracy continuously rather than on statistical sampling cycles detect calibration drift 12 to 18 months earlier — recovering revenue that would otherwise remain unbilled throughout the testing gap. Utilities that monitor AMI network health at the per-endpoint level maintain read rates above 99% and eliminate estimated-read revenue leakage. Utilities that correlate tamper events, consumption anomalies, and billing history into a prioritised investigation queue recover revenue from theft that would otherwise remain undetected for years.
iFactory's AMI analytics platform activates all four revenue-protecting capabilities — meter accuracy trending, network health monitoring, tamper detection, and DMA leak analysis — from the data your AMI head-end already stores, without system modification or additional field hardware. Book a Demo to see iFactory configured for your AMI platform and meter fleet profile, or talk to an expert about a free NRW and revenue impact assessment for your water utility.
Frequently Asked Questions
iFactory integrates with all major AMI head-end platforms — including Itron, Sensus, Badger Meter, Mueller, and Aclara — via REST API or data export. No AMI system replacement is required, and no changes to your existing AMI configuration are needed. iFactory connects as a read-only analytics layer on top of your existing head-end, activating meter accuracy trending, network health monitoring, tamper detection, and DMA leak analysis from the data your system already collects. The integration connects within 7 to 14 days, and all analytics capabilities begin generating outputs immediately upon connection. Book a Demo to confirm integration for your specific AMI head-end platform and version.
DMA night flow analysis for zone-level leak detection activates within 7 to 14 days of connection, requiring sufficient historical night flow data to establish consumption baselines. Meter accuracy trending requires 3 to 6 months of historical AMI data to build reliable accuracy risk scores from consumption pattern analysis. Network health monitoring and tamper event analysis activate immediately from existing event data in the head-end system. All timelines depend on the volume and quality of historical data available in your AMI system. Talk to an expert to review activation timelines for your specific AMI data history volume.
iFactory uses consumption pattern analysis to identify meters whose registered consumption has declined relative to expected usage baselines. The platform compares each meter's consumption trend against three reference datasets: the meter's own historical consumption pattern, the average consumption of similar-property meters in the same zone, and the zonal production-to-consumption mass balance. A meter whose consumption trend is declining while comparable meters in the same zone show stable or increasing usage is exhibiting the characteristic signature of calibration drift. Meters exceeding a configurable accuracy-risk threshold are flagged for physical testing or replacement, ranked by estimated revenue impact. This approach does not replace AWWA-recommended accuracy testing — it prioritises which meters to test first so that field testing resources are directed to the meters most likely to be under-registering. Book a Demo to see accuracy risk scoring methodology applied to your meter fleet data.
Yes. iFactory meters are registered in the platform with their communication type, model, installation date, and service location. The analytics layer processes data from AMI endpoints (real-time or near-real-time reads) and AMR endpoints (drive-by or walk-by reads) separately, applying appropriate analytics to each population. For AMI meters, iFactory performs continuous accuracy trending, network health monitoring, tamper detection, and DMA leak analysis. For AMR meters, the platform tracks read success rates per route, identifies meters consistently missed on scheduled reads, and prioritises them for conversion to AMI endpoints. The utility manager sees both populations in a single dashboard with clear segmentation by communication type. Talk to an expert about configuring iFactory for your mixed-meter population.
Documented outcomes from iFactory deployments show an average NRW reduction of 23% and annual revenue recovery of $1.2 million across utility deployments ranging from 30,000 to 150,000 endpoints. Individual results vary based on meter fleet age distribution, current AMI read rates, existing NRW levels, and the utility's capacity to execute replacement and repair recommendations. Utilities with older meter fleets and no existing accuracy monitoring programme typically see the highest revenue recovery in the first 12 months, as the analytics platform identifies the highest-impact meters for replacement. Utilities with newer AMI deployments and existing network health monitoring see more gradual recovery but benefit from reduced estimated-read billing exceptions and earlier tamper detection. Book a Demo to review documented outcomes from utilities with similar fleet profiles to yours.
Revenue Leakage Has a Signature. iFactory Finds It Before the Next Billing Cycle. Get a Free NRW and Revenue Impact Assessment.
iFactory's AMI analytics platform for water utilities — continuous meter accuracy monitoring, network health tracking, tamper detection, and DMA leak analysis — activated from your existing AMI head-end data without system replacement or additional field hardware. Average documented outcome: 23% NRW reduction, $1.2M annual revenue recovery, 99.1% read rate.