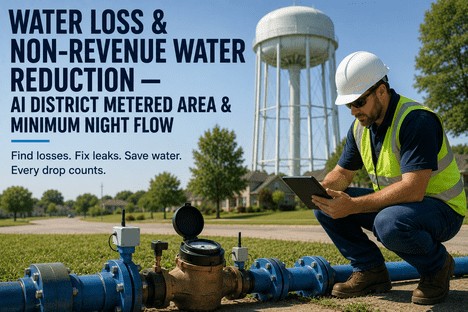
Water Loss & Non-Revenue Water Reduction — AI District Metered Area & Minimum Night Flow
By Grace on June 19, 2026
Thirty percent of the water a utility treats and pumps into its distribution network never reaches a paying customer. It leaks from aging pipes, escapes through storage overflows, passes through meters that have lost their accuracy, or is consumed without authorisation. This is non-revenue water — and it costs the global water sector an estimated $39 billion every year. For the utility manager responsible for system performance, the question is not whether water is being lost. Every distribution system loses water. The question is whether the utility knows where it is being lost, how much each category of loss contributes to the total, and which repair or replacement action will produce the greatest reduction in loss per dollar spent. Most utilities manage NRW through periodic water balance calculations that take months to compile and arrive too late to guide operational decisions. AI-driven district metered area analysis and minimum night flow trending collapse the detection-to-action cycle from months to hours. This is the utility manager's operational guide to deploying it.
Utility Managers Who Quantify Water Loss by DMA and Hour Can Cut NRW by Half in 18 Months. AI District Metering Makes Every Drop Count.
iFactory's AI water loss analytics platform ingests DMA inflow data, customer consumption records, pressure zone data, and meter accuracy test results — to quantify real and apparent losses at the district level, detect emerging leaks within 8 to 12 hours of onset, and prioritise repair actions by cost-to-benefit ratio.
Average global non-revenue water rate — treated water produced but lost before reaching customers, representing $39 billion in annual economic losses across water utilities worldwide
98%
Leak detection accuracy achieved by AI ensemble models analysing DMA inflow and consumption data — detecting emerging leaks within 8 to 12 hours of onset at the district level
50%
Leakage volume reduction achievable with AI-driven leak detection and pressure management programmes — documented across utilities deploying integrated DMA and smart meter analytics
8x
Revenue recovery improvement when AI-driven smart meter analytics replace traditional meter replacement targeting — identifying failing meters by consumption pattern anomalies
The Utility Manager's Core Problem: Water Balance Calculations Arrive Months Late — and by Then the Loss Pattern Has Changed
The standard approach to NRW management in most water utilities follows a quarterly or annual water balance cycle. The utility calculates total system input volume for the period, subtracts billed authorised consumption, and arrives at the NRW volume. This number is then split into apparent losses and real losses using assumptions about meter accuracy and leakage rates. By the time the water balance report is compiled, reviewed, and presented to the management team, the data is weeks or months old. A leak that started on day three of the quarter and was repaired on day twenty is invisible in the quarterly balance — it appears only as an undifferentiated line item in the loss volume. The utility manager has no way to distinguish between a system with one large unrepaired leak and a system with twenty small leaks that were detected and repaired during the period. This data resolution problem is the root cause of most NRW programme underperformance: you cannot manage what you cannot measure at the right temporal and spatial scale. The International Water Association has established that global NRW averages 30% of system input, and the World Bank estimates the annual economic cost at $14 billion (direct water value) to $39 billion (including energy, treatment, and social costs). For a utility serving 500,000 connections, each percentage point of NRW above the economic leakage level typically represents $200,000 to $500,000 in annual lost revenue — recurring year after year until the loss is found and fixed.
The Three Pillars of NRW Reduction — and How AI District Metering Strengthens Each One
01
Real Losses — Leakage Detection and Pressure Management
Real losses — physical water escaping through pipe leaks, breaks, and storage overflows — account for approximately 75% of total NRW in most distribution systems. The conventional detection approach relies on acoustic listening surveys conducted on a rotating schedule: each kilometre of pipe is surveyed once every one to three years depending on budget and crew availability. A leak that develops the day after the survey crew passes through a district will leak for 12 to 36 months before it is detected. AI-driven DMA inflow analysis changes this by detecting the leak within hours of onset. Every DMA has a characteristic inflow pattern that reflects the normal relationship between customer consumption and supply flow. When a new leak develops, the inflow increases relative to consumption — the deviation is detectable in the minimum night flow trend within 8 to 12 hours. The system alert directs the leak detection crew to the specific DMA where the inflow deviation was detected, reducing the search area from the entire network to a single district of 500 to 3,000 service connections. A UK study using 800 DMAs representing nearly 12 million metres of pipe demonstrated that ML models can achieve leak detection within hours by analysing DMA-level demand-supply dynamics.
AI solution: DMA inflow model detects deviations from expected supply-demand relationship. Alert within 8 to 12 hours. Search area reduced from network-wide to single DMA.
02
Apparent Losses — Meter Inaccuracy and Data Handling Errors
Apparent losses — water that is consumed but not billed due to meter under-registration, billing system errors, data handling mistakes, and unauthorised consumption — represent a smaller volume than real losses in most utilities but a higher revenue impact per unit volume because the utility has already incurred the full treatment and pumping cost. Customer meters lose accuracy progressively over their service life. A typical residential positive-displacement meter may under-register by 5 to 10% after 10 years and by 15 to 25% after 15 years, depending on water quality and flow patterns. Large commercial and industrial meters can lose accuracy faster due to higher flow rates and prolonged duty cycles. Traditional meter replacement programmes select meters for testing based on age — an approach that replaces meters that are still accurate while missing meters that are failing early due to local water quality conditions or unusual demand patterns. AI-driven meter data analytics identifies under-registering meters by analysing consumption pattern anomalies — a meter that shows a sudden or gradual decline in consumption relative to the seasonal baseline for that customer class and property type is flagged for testing regardless of its installation date. Siemens documented that AI-driven smart meter analytics delivers up to 8 times more revenue recovery compared to traditional age-based meter replacement programmes.
AI solution: Meter consumption pattern analysis identifies under-registration by property type, customer class, and seasonal baseline. Flags failing meters by anomaly detection, not by age.
03
Pressure Management — The Leakage-Pressure Relationship That Drives the MNF Baseline
Leakage rate is not independent of pressure — it varies with pressure according to the FAVAD (Fixed and Variable Area Discharge) equation, which describes how leak openings expand and contract as pressure changes. A 10% reduction in average zone pressure typically produces a 10 to 20% reduction in leakage volume, depending on the pipe material and the ratio of fixed-area to variable-area leaks in the zone. The minimum night flow is the primary operational metric for pressure-based leakage estimation: during the minimum consumption period (typically 2:00 AM to 4:00 AM), when legitimate customer consumption is at its lowest, the remaining flow entering the DMA represents the combined background leakage, detectable leaks, and any legitimate night-time consumption. The MNF baseline is specific to each DMA and varies with season, temperature, and pressure zone configuration. AI analysis of MNF trends can distinguish between a stable baseline with constant background leakage and a rising baseline that indicates a new developing leak — without requiring the utility manager to manually analyse nightly flow charts for dozens or hundreds of DMAs.
AI solution: MNF baseline model calibrated per DMA. Trend analysis separates background leakage from emerging leaks automatically. Pressure reduction scenarios modelled for NRW impact.
Real Loss Quantification · Apparent Loss Detection · Pressure Optimisation · Revenue Recovery Tracking
When the Water Balance Takes Three Months to Produce, the Utility Manager Is Managing History. AI DMA Analysis Delivers the Loss Picture Today — Not Last Quarter.
iFactory builds the real-time NRW picture directly from the DMA inflow data and customer consumption records the utility already collects — so utility managers see the current loss position by district, not a quarterly estimate that was accurate three months ago.
The AI NRW Analytics Architecture for Utility Managers
The iFactory AI water loss analytics platform operates as a three-layer quantification and action system — real-time NRW accounting at the DMA level, leak detection and meter analytics at the component level, and intervention prioritisation at the programme level. Each layer answers a distinct question the utility manager needs continuously: what is the current NRW by DMA and loss category, where are new leaks developing and which meters are under-registering, and which repair or replacement action generates the greatest NRW reduction per dollar invested.
Layer 01
DMA-Level NRW Accounting
Daily water balance by district with real and apparent loss components
The accounting layer ingests daily inflow data from each DMA bulk meter, customer consumption data from the billing system (standardised to match the inflow period), pressure data from zone monitoring points, and meter accuracy test results where available. The platform calculates a daily water balance for each DMA: total inflow minus total billed consumption equals NRW volume. NRW is then split into real losses (estimated through MNF analysis adjusted for pressure) and apparent losses (the residual after accounting for estimated metering inaccuracy based on meter age, type, and test history). The daily balance eliminates the quarter-end delay of traditional water balance calculations. The utility manager sees the NRW position for every DMA with a maximum one-day lag, updated automatically each morning. The cumulative NRW trend at the district, zone, and system level is calculated continuously and displayed as a rolling 7-day, 30-day, and 365-day average — providing the trend visibility that quarterly water balance reports cannot deliver.
Daily water balance per DMA
Real vs apparent loss allocation
Rolling NRW trend by zone
Layer 02
Leak Detection and Meter Analytics
AI models detect emerging leaks and under-registering meters
The detection layer operates two parallel AI models. The leak detection model uses a regression ensemble — Random Forest, XGBoost, and Multi-Layer Perceptron — trained on historical DMA inflow and consumption data to learn the normal supply-demand relationship for each district. When the observed inflow deviates from the predicted inflow beyond a configurable threshold, the system generates a leak alert with the DMA identification, the deviation magnitude (estimated leakage rate in litres per second), and the time of first detection. A UK-based study validated this approach across 800 DMAs representing nearly 12 million metres of pipe, achieving 98% accuracy on real leak cases with detection within 8 to 12 hours of onset. The meter analytics model analyses daily consumption data at the individual meter level, comparing each meter's current consumption to its historical baseline adjusted for seasonal factors, property characteristics, and customer class. Meters that show a gradual or step-change decline in consumption relative to the expected baseline are flagged for accuracy testing — targeting the 10% of meters that typically contribute 80% of apparent loss revenue impact.
Regression ensemble leak detection
Meter accuracy anomaly scoring
Targeted meter replacement planning
Layer 03
Intervention Prioritisation
Cost-benefit ranked repair and replacement actions
The prioritisation layer takes the leak detection alerts and meter replacement recommendations from Layer 02 and ranks them by estimated NRW reduction per dollar invested. Each leak alert is assigned an estimated annual water loss volume based on the deviation magnitude and the estimated time to repair. Each meter replacement recommendation is assigned an estimated annual revenue recovery based on the meter size, customer class, and estimated under-registration percentage. The prioritisation list is sorted by cost-benefit ratio — the estimated annual NRW reduction divided by the estimated intervention cost. The utility manager can filter by DMA, zone, loss category, or minimum benefit threshold. The platform tracks the actual reduction achieved after each intervention by comparing the pre-intervention and post-intervention DMA inflow trend, closing the feedback loop between planned benefit and realised benefit. This converts the NRW programme from a budget-driven activity list into a performance-managed investment portfolio where every dollar spent on loss reduction has a measured return.
Cost-benefit ranked intervention list
Pre-post intervention validation
NRW programme ROI tracking
What the AI NRW Dashboard Shows the Utility Manager
The utility manager's view of the AI water loss analytics platform is not a data table — it is a NRW programme management tool designed around the questions that determine whether the water loss programme is winning or losing: what was the NRW percentage across the entire system yesterday, which DMAs have the highest loss rates, where are new leaks developing right now, which meters are most likely under-registering, and is the investment in loss reduction delivering the expected return.
NRW View 01
System NRW Dashboard — Daily Loss Rate by DMA and Zone
A single-screen view of the current NRW position across the entire distribution system. Each DMA is displayed as a tile showing the current daily NRW percentage, the 30-day rolling average, and the trend direction — improving, stable, or deteriorating. DMAs are colour-coded by performance relative to the utility's NRW target: green for DMAs at or below target, amber for DMAs within 25% above target, red for DMAs exceeding target by more than 25%. The system summary at the top shows the total system NRW percentage, the total daily loss volume in cubic metres or gallons, and the estimated annual revenue loss at current rates. The utility manager sees the current loss position for every district without waiting for the quarterly water balance report.
Minimum Night Flow Trend — DMA-Level Leakage Detection
The MNF trend view displays the minimum night flow for each DMA plotted as a daily time series with the AI-estimated baseline and the detection threshold overlaid. When the MNF rises above the expected baseline and crosses the detection threshold, the point of deviation is marked on the chart with the estimated leakage rate and the confidence level. The utility manager can review all active leak alerts in a single sorted list — prioritised by estimated leakage rate, DMA criticality, and time since detection. The MNF view makes the connection between the DMA inflow data and the leak detection model output visible and actionable without requiring the utility manager to interpret raw flow data.
Utility manager action: Review active leak alerts daily. Assign highest-rate DMAs to leak detection crew.
NRW View 03
Apparent Loss — Meter Accuracy Anomaly List
The apparent loss view presents a ranked list of meters flagged by the AI model for potential under-registration. Each flagged meter shows the customer ID, meter type and age, the estimated under-registration percentage (calculated from the deviation between expected and observed consumption), the estimated annual revenue loss, and the recommended replacement priority. The utility manager can filter by customer class — residential, commercial, industrial, institutional — and by meter size, age range, or estimated revenue impact. The view also shows the meter replacement programme performance: how many meters have been replaced this quarter, the average revenue recovery per replaced meter, and the programme ROI. This turns the meter replacement budget from a fixed annual expense into a performance-managed investment with measurable revenue recovery.
Utility manager action: Review meter anomaly list monthly. Top 10% of flagged meters generate 80% of recoverable revenue.
NRW View 04
NRW Component Breakdown — Real Loss vs Apparent Loss Trend
The component breakdown view shows the NRW volume split between real losses and apparent losses over time, at the system level and by DMA. The stacked trend chart shows the combined NRW percentage with the real loss and apparent loss components called out separately. The utility manager can see whether the NRW trend is being driven by increasing real losses (leakage developing faster than repairs are being completed) or by increasing apparent losses (meter accuracy declining or billing data errors accumulating). Each component is linked to the relevant intervention list — real losses link to the leak detection view, apparent losses link to the meter analytics view — so the utility manager can move directly from the trend observation to the actionable intervention list without navigating through separate screens.
Utility manager action: Review component split monthly. Rising trend in either component triggers targeted investigation programme.
NRW View 05
Intervention Prioritisation — Ranked by NRW Reduction per Dollar
The intervention prioritisation view presents a single ranked list of all recommended actions — leak repairs and meter replacements — sorted by estimated annual NRW reduction divided by intervention cost. Each line shows the DMA or meter ID, the intervention type, the estimated annual water savings in volume and revenue, the estimated intervention cost, the cost-benefit ratio, and the current status. The utility manager can adjust budget scenarios: what happens to total NRW reduction if the repair budget is allocated to the top 10 interventions versus spread across all active alerts. The scenario analysis capability provides the data needed to defend budget requests at council meetings and rate hearings — showing precisely how much NRW reduction a proposed budget will deliver and which DMAs will benefit.
Utility manager action: Use prioritisation list to allocate repair budget for maximum NRW reduction. Scenario analysis supports budget requests.
NRW View 06
Audit Export — Water Balance and NRW Programme Records in One Click
Every piece of documentation required for regulatory reporting, water balance validation, and NRW programme review is generated automatically — daily DMA-level water balance data, MNF trend records with leak detection timestamps, meter accuracy anomaly detection records with estimated revenue impact, intervention records with pre-post NRW comparison, and NRW trend reports by zone and loss category. The export covers any date range, DMA, or loss category the reviewer specifies. The water balance methodology record — which documents the data sources, calculation methods, and loss allocation assumptions — is the documentation that demonstrates the NRW programme is data-driven, defensible, and compliant with IWA/AWWA water balance standards. Audit preparation drops from weeks of manual data compilation from billing systems, SCADA archives, and spreadsheets to a single export covering the entire review period.
Utility manager action: Export full NRW audit package on demand. Compliant with IWA/AWWA water balance methodology.
"
We were operating with a quarterly water balance that told us where our NRW had been three months ago — useful for regulatory reporting but useless for operational decisions. A leak could run for weeks before the quarterly report showed a change in the loss volume, and by then we had no way to determine which week the leak started or which DMA was affected. The AI DMA analysis platform changed our loss detection capability from months to hours within the first deployment phase. The minimum night flow model detected a developing leak in a residential DMA that was losing 3.2 litres per second — the alert fired at 3:00 AM, our leak detection crew pinpointed the leak by 10:00 AM, and the repair was completed by 3:00 PM the same day. Under our quarterly balance system, that leak would have run for an estimated 47 days before the next report identified the loss. At 3.2 litres per second, that was 13,000 cubic metres of treated water — worth approximately $26,000 in production cost — that would have been lost. In the first 12 months, we reduced system NRW from 28% to 16%, recovered $1.8 million in annual revenue through targeted meter replacements, and cut the leak detection-to-repair cycle from weeks to 24 hours. The AI platform did not require a single additional crew member. It just told us where to send the crew we already had.
— Utility Manager, Regional Water Utility — 18 DMAs, 120,000 Service Connections, 3,200 km Distribution Network
Conclusion
Non-revenue water reduction is not a water balance calculation problem — it is a detection and response latency problem. When the utility manager waits for a quarterly water balance to find out where water is being lost, the losses compound for weeks or months before any intervention begins. The difference between a utility that achieves NRW rates of 12 to 15% and one that struggles at 25 to 35% is almost never the total length of the distribution network, the age of the infrastructure, or the repair budget. It is the speed at which the utility detects new leaks, identifies failing meters, and translates that detection into a prioritised repair action.
The evidence from utilities deploying AI-driven DMA analysis and minimum night flow trending is consistent and replicable. Leak detection within 8 to 12 hours of onset is achievable with regression ensemble models trained on DMA inflow and consumption data — validated at 98% accuracy across real leak cases. Leakage volume reductions of 50% have been documented by utilities combining AI detection with active pressure management. Revenue recovery from AI-targeted meter replacement programmes has been measured at up to 8 times the return of traditional age-based programmes. The utilities achieving the upper end of these documented outcomes are the ones that integrated daily DMA-level water balance accounting with automated leak detection and meter analytics, creating a continuous NRW management cycle — detect, prioritise, repair, validate — that runs in days rather than quarters.
iFactory's AI water loss analytics platform is designed for utility managers who need to reduce non-revenue water, not just measure it. Book a Demo to see the platform configured for your DMA network configuration and customer metering profile, or talk to an expert about a free NRW assessment and AI leak detection pilot programme for your water distribution system.
Frequently Asked Questions
The platform is designed to work with whatever metering and data infrastructure the utility currently has in place, and it scales in capability as the infrastructure improves. The minimum data requirement is daily DMA inflow data from the district bulk meters — even if those meters are read manually on a daily or weekly basis. The platform can ingest data from manual meter reads, AMR (automatic meter reading) systems, SCADA historians, and AMI platforms through standard API connectors or structured data file imports. For utilities without formal DMA boundaries in place, the platform can assist in the DMA design process by analysing the existing network topology, pressure zone configuration, and valve locations to recommend optimal DMA boundaries. As the utility progressively installs AMI and smart meters, the platform automatically incorporates the higher-resolution data to improve detection accuracy and reduce detection latency. The AI model accuracy improves with data resolution: daily DMA inflow data provides leak detection within 8 to 12 hours, while hourly or sub-hourly data from AMI systems reduces detection to within 1 to 2 hours. The platform includes a data readiness assessment module that evaluates the current data environment and identifies the highest-value infrastructure investments to improve NRW detection capability. Talk to an expert about scheduling a data readiness assessment for your utility's current metering and data infrastructure.
The distinction between background leakage and a new developing leak is made by the AI model's analysis of the DMA supply-demand relationship. Each DMA has a characteristic relationship between customer consumption and supply inflow — when consumption increases, supply inflow increases proportionally, and vice versa. Background leakage is embedded in this relationship as a constant offset. The regression ensemble model learns this relationship during a training period of 4 to 8 weeks of historical data. After training, the model predicts the expected inflow for any given consumption level. When a new leak develops, the observed inflow exceeds the predicted inflow because the leak adds a new loss component that is not reflected in the consumption data. The deviation between observed and expected inflow is the estimated new leakage rate. The model incorporates multiple validation filters to distinguish a genuine new leak from other causes of inflow deviation — pressure changes, seasonal consumption shifts, bulk meter drift, and data transmission errors. The system reported a 98% accuracy rate for real leak cases in the UK DMA validation study, confirming that the model reliably separates new leaks from background leakage. The confidence level of each detection is displayed alongside the alert, allowing the utility manager to prioritise responses by detection reliability. Book a Demo to see a live simulation of the model distinguishing background leakage from a new developing leak event in a representative DMA dataset.
Yes — the apparent loss quantification model works with the data resolution available. For utilities with monthly manual meter reads (standard billing cycle data), the model analyses consumption trends at the monthly level by comparing each meter's current consumption to its historical consumption pattern adjusted for seasonal factors and property type. For utilities with AMI or AMR data at daily or hourly resolution, the model delivers finer-grained detection and faster identification of under-registration patterns. The model accounts for the fact that apparent losses are estimated within a confidence range rather than measured precisely — the output is expressed as an estimated under-registration percentage with a confidence interval. The platform also incorporates a meter accuracy degradation model that estimates the expected under-registration for each meter based on its type (positive displacement, turbine, electromagnetic, ultrasonic), age, manufacturer, and typical accuracy decay curves from published meter accuracy research. This model provides a baseline estimate even for utilities that have limited meter testing history. As the utility performs meter accuracy tests, the test results are fed back into the model to calibrate the accuracy decay curves to the local water quality conditions, improving the accuracy of future estimates. The platform tracks the actual revenue recovery achieved when flagged meters are replaced, closing the measurement loop between the estimated under-registration and the verified revenue recovery. Talk to an expert about configuring the apparent loss model for your utility's current metering infrastructure and data resolution.
The deployment timeline follows three phases. Phase one — data integration and baseline establishment — typically takes 4 to 8 weeks. During this phase, DMA inflow data and customer consumption data are ingested, the DMA boundaries and metering configuration are validated, and the AI leak detection and meter analytics models are trained on the historical data to establish the normal operating baseline for each DMA. Phase two — parallel operation and model validation — runs for 4 to 6 weeks. During this phase, the platform operates in detection mode alongside the utility's existing NRW programme without replacing any current processes. The platform generates leak alerts and meter recommendations, and the utility team validates the alerts against their operational knowledge and field investigation results. The documented accuracy rate from this phase — typically 90 to 98% for leak detection — provides the evidence needed to transition the platform to a primary operational role. Phase three — active deployment and NRW reduction — begins after validation. The utility team acts on platform-generated leak alerts and meter replacement recommendations as part of their standard operational workflow. Measurable NRW reduction — typically 20 to 40% reduction in real losses and 15 to 30% increase in revenue recovery from meter replacement — is documented within 6 to 12 months of active deployment. The reduction is validated through the platform's pre-post intervention tracking: for each leak repair, the DMA inflow trend before and after the repair is compared to calculate the actual leakage reduction achieved. For each meter replacement, the billed consumption before and after replacement is compared to calculate the revenue recovery. The cumulative NRW trend at the system level is tracked continuously and reported in the platform dashboard with the documented reduction verified against the daily water balance. Book a Demo to review documented NRW reduction case studies from comparable utility deployments.
Thirty Percent of Your Treated Water Is Leaving the System Without Revenue. AI DMA Analysis Detects the Loss in Hours — Not Quarters. Get a Free NRW Assessment.
iFactory's AI water loss analytics platform for utility managers — daily DMA-level NRV accounting with real and apparent loss quantification, AI leak detection within 8 to 12 hours of onset, meter accuracy anomaly detection with revenue recovery tracking, and audit-ready water balance records generated automatically from the metering data your utility already collects.