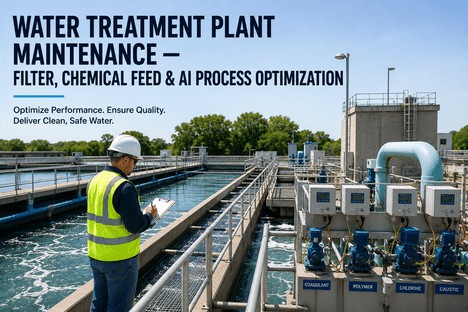
The process engineer responsible for a water treatment plant operates at the intersection of chemistry, mechanics, and compliance. Every shift brings a different raw water condition — a turbidity spike from seasonal runoff, a pH shift from an upstream discharge event, a temperature drop that changes every reaction rate in the plant. The response to each variation is a cascade of adjustments: coagulant dose, polymer feed rate, filter effluent target, disinfection residual setpoint. Each adjustment carries consequences. Underdose the coagulant and floc carries over to the filters, shortening run times and risking breakthrough. Overdose and chemical costs rise, sludge volume increases, and the downstream clearwell pH drifts toward the compliance boundary. The process engineer who manages this balancing act with manual jar tests and SCADA trend screens is fighting a shifting battle with lagging indicators. AI-driven process optimisation changes the paradigm — converting the treatment train from a reactive sequence of adjustments into a predictive system that anticipates raw water changes and adjusts chemical feed, filter loading, and disinfection dosing before the effluent quality moves.
AI Process Control · Chemical Feed Optimisation · Filter Performance Monitoring · Compliance Automation
Every Raw Water Change That Reaches the Finished Water Line First Passes Through a Decision the Process Engineer Could Have Made Earlier. AI Closes That Gap.
iFactory gives process engineers a single platform for treatment plant optimisation — AI-powered chemical dosing that adapts to raw water variability, filter performance analytics that maximise run times, and compliance documentation that is generated automatically from the process data your SCADA system already produces.
30%
Reduction in unplanned treatment plant downtime achievable with AI-driven predictive maintenance — documented across municipal water treatment facilities
98.5%
Coagulant dose prediction accuracy achieved by ensemble machine learning models analysing raw water turbidity, pH, temperature, conductivity, and dissolved oxygen in real time
25%
Reduction in total chemical consumption when AI-optimised dosing replaces manual setpoint adjustment — reducing both chemical spend and sludge handling cost
25–30%
Of wastewater treatment plants projected to adopt AI-driven operational optimisation by 2025, rising to 40–60% of large and medium plants by 2035
The Treatment Train — AI Optimisation at Every Stage
A conventional surface water treatment plant follows a sequence of process stages that transforms raw water into finished drinking water. Each stage has a specific function, a set of control variables, and a failure mode that the process engineer must anticipate. The iFactory platform maps each stage with real-time performance data, AI-driven setpoint optimisation, and predictive alerts that flag deviations before they reach the next stage. What follows is the treatment train as the process engineer sees it through the iFactory lens.
Raw Water Intake and Screening
The process engineer's first variable is raw water quality — turbidity, pH, alkalinity, temperature, and organic carbon. AI models ingest historical and real-time raw water data to forecast quality trends 2 to 6 hours ahead. A predicted turbidity spike from upstream rainfall triggers a pre-emptive coagulant dose adjustment before the spike arrives at the rapid mix chamber — eliminating the lag between raw water change and chemical response that characterises manual operation.
Coagulation and Flocculation
The most chemically sensitive stage of the treatment train. Coagulant dose must neutralise particle surface charge, while polymer dosage and mixing energy determine floc size and settleability. AI optimisation models — using ensemble machine learning with 98.5% documented prediction accuracy — calculate the optimal coagulant dose from raw water turbidity, pH, temperature, conductivity, and dissolved oxygen. The model updates continuously as raw water quality changes and learns from the settled water turbidity response, closing the feedback loop that jar tests can only approximate.
Sedimentation and Clarification
Settled water turbidity is the primary performance indicator for the sedimentation stage. AI models track sludge blanket depth, surface loading rate, and effluent turbidity trend to detect rising blanket conditions before turbidity breakthrough occurs. Predictive alerts give the process engineer 30 to 90 minutes of advance notice before settled water quality degrades — enough time to adjust polymer feed, increase sludge withdrawal, or reduce plant flow rate to protect the filters downstream.
Filtration
Filter performance determines the final particle removal barrier before disinfection. AI filter analytics track head loss development rate, effluent turbidity profile, and filter run time for each individual filter cell. The platform predicts remaining run time before the terminal head loss setpoint is reached — enabling the process engineer to sequence backwashes for minimum finished water demand impact rather than reacting to high head loss alarms one filter at a time. Filters that show accelerated head loss development receive automated alerts for media condition assessment, long before turbidity breakthrough occurs.
Disinfection and Clearwell
The final stage before distribution. Chlorine or chloramine residual must be maintained within a narrow compliance band — sufficient for pathogen inactivation but below the maximum residual disinfectant level. AI feed-forward models calculate the target dose from combined filter effluent quality, clearwell level, and flow rate, while feedback trim adjustments maintain the residual setpoint as demand varies. Contact time validation is calculated continuously from clearwell level and flow rate, generating compliance records for CT credit without manual calculation or grab sample extrapolation.
Finished Water and Distribution
The combined output of all upstream stages measured against compliance standards. AI models provide a continuous compliance forecast — projecting finished water quality against regulatory limits and warning the process engineer when the current operating trajectory is approaching an exceedance boundary. The compliance forecast updates with every new process measurement, giving the process engineer the lead time to intervene before a regulatory exceedance occurs rather than explaining the cause after the event.
Chemical Feed Optimisation — AI vs Traditional Dosing Across the Three Primary Treatment Chemicals
Chemical dosing is the largest variable operating cost in a water treatment plant and the most direct influence on finished water quality. The three primary chemical categories — coagulants, polymers, and disinfectants — each have different optimisation objectives, response times, and failure modes. AI optimisation addresses each category with a distinct modelling approach that reflects the underlying chemistry and process dynamics.
Chemical Category
Traditional Approach
AI-Optimised Approach
Coagulants
Jar test correlation performed once per shift or after raw water change. Dosing setpoint adjusted manually based on lab turbidity results with 30–90 minute lag from sample collection to dose response.
Ensemble ML model predicts optimal dose from real-time raw water quality parameters with 98.5% accuracy. Setpoint updates automatically every SCADA scan cycle. Settled water turbidity feedback provides continuous model refinement.
Polymers
Fixed dosage setpoint adjusted only when floc formation appears visibly poor in the flocculation basin. No direct measurement of floc size, strength, or settleability.
AI model correlates polymer dose with settled water turbidity and filter run time — identifying the minimum effective polymer dose for current raw water conditions. Automated dose adjustment prevents both underdose (filter loading) and overdose (sludge handling cost).
Disinfectants
Chlorine residual controlled by feedback loop from combined filter effluent analyser. Dose changes lag behind flow and demand changes by the hydraulic residence time of the clearwell.
Feed-forward model calculates target dose from flow rate, filter effluent quality, and clearwell level — combined with feedback trim. Response to flow or demand changes is instantaneous rather than lagged. CT credit calculated continuously and automatically documented.
AI Coagulant Model · Polymer Optimisation · Disinfection Feed-Forward · CT Compliance Records
The Chemical Dose That Worked Three Hours Ago Is Already Wrong. AI Chemical Feed Optimisation Adjusts Every Cycle to the Current Raw Water Signal.
iFactory embeds AI chemical dosing models directly into the treatment plant control architecture — giving the process engineer real-time dose optimisation across coagulants, polymers, and disinfectants with 98.5% documented prediction accuracy and continuous compliance documentation.
Filter Performance Analytics — Three Metrics the Process Engineer Cannot Afford to Miss
Filtration is the final particle barrier before disinfection. Filter performance directly determines finished water turbidity compliance, disinfection effectiveness, and plant production capacity. The iFactory filter analytics module tracks three primary performance indicators for each filter cell continuously — and alerts the process engineer when any indicator deviates from the expected range.
Metric 01
Head Loss Development Rate
Head loss across the filter media increases as captured particles accumulate. The rate of increase is the primary indicator of filter loading and remaining run time. AI models analyse the head loss curve for each filter cell and compare the current rate against historical norms for the same season, raw water quality, and coagulant regime. A filter that is developing head loss 30% faster than its historical baseline signals a change in floc character or a media condition issue — prompting the process engineer to investigate before the filter reaches terminal head loss prematurely.
Flag: Accelerated head loss triggers media assessment alert
Metric 02
Effluent Turbidity Profile
Individual filter effluent turbidity is tracked continuously and compared against the combined filter effluent average. A filter whose effluent turbidity is rising relative to the plant average is experiencing a performance loss that may indicate media fouling, mudball formation, or an underdose distribution problem. AI change-detection algorithms identify the deviation — even at turbidity levels well below the regulatory limit — and flag the filter for scheduled inspection or remedial backwash sequence adjustment before the degradation progresses to a compliance event.
Flag: Relative turbidity rise triggers filter inspection recommendation
Metric 03
Backwash Optimisation
The timing and sequence of filter backwashes affects both filter performance and plant hydraulic capacity. AI backwash scheduling analyses head loss development rate across all active filters and recommends the optimal backwash sequence that minimises the number of filters out of service simultaneously while ensuring no filter exceeds its terminal head loss. The process engineer sees a projected schedule showing which filter will reach terminal head loss next, how long it will be out of service, and the impact on plant production capacity during the backwash period.
Flag: AI-optimised backwash sequence minimises production impact
The iFactory Process Engineer Dashboard — Optimisation View Across the Treatment Train
The process engineer's dashboard is organised around the treatment train sequence — not as a SCADA replica but as a process optimisation interface. Each stage displays a current performance summary, the AI-optimised setpoint for the primary control variable, and a trend indicator showing whether performance is improving, stable, or deteriorating relative to the target.
Stage View
Chemical Feed Performance
Current coagulant and polymer dose rates displayed alongside the AI-calculated optimal dose. Variance from optimal is shown as a percentage, with the estimated chemical cost impact of the variance. The process engineer can accept the AI setpoint, apply a manual override, or investigate the model input parameters driving the recommendation.
Action: Accept AI dose or investigate model inputs driving the recommendation
Stage View
Filter Fleet Summary
Every filter cell displayed with current head loss, effluent turbidity, run time since last backwash, and AI-predicted remaining run time. Colour-coded status indicates filters operating within normal range, approaching terminal head loss, or showing anomalous performance trends that require investigation.
Action: Review individual filter curves or accept AI-optimised backwash schedule
Stage View
Disinfection Compliance Monitor
Continuous display of chlorine residual, contact time (CT) value, and compliance status against the regulatory requirement. The CT credit is calculated from real-time clearwell level and flow data — eliminating manual calculation and providing a continuous compliance record that is audit-ready for the state drinking water programme.
Action: Export CT compliance record for any date range in one click
Stage View
Compliance Forecast
Projected finished water quality for the next 4 hours based on current process conditions and raw water trend. Any parameter projected to approach a regulatory boundary generates an early warning with the estimated time to exceedance and the recommended corrective action — usually a chemical dose adjustment or a filter scheduling change.
Action: Review forecast and apply recommended adjustment before exceedance
"
I had been running the same treatment plant for eleven years and I could read the raw water turbidity trend well enough to adjust the alum dose before the lab results came back. What I could not do was see the interactions between the coagulant dose, the polymer dose, and the filter run times simultaneously — not in a way that let me optimise all three at once. The AI model did not replace my experience. It extended it. Within the first month, the platform identified that we were overfeeding polymer by approximately 18% based on the settled water turbidity response. We reduced polymer consumption by that amount with no change in finished water quality. The annual saving was about $24,000 on polymer alone. But the real value was in the filter run times — they increased by an average of 22% because the floc character was improved. That meant fewer backwashes, less water lost to waste, and more production capacity during the peak demand season.
— Process Engineer, Surface Water Treatment Plant — Conventional Treatment, 24 MGD Capacity
Conclusion
Water treatment plant optimisation is fundamentally a prediction problem. The process engineer must anticipate how raw water changes will propagate through the treatment train and adjust chemical feed, filter loading, and disinfection dosing accordingly — before the finished water quality moves. Traditional operation relies on lagging indicators: jar tests, grab samples, and SCADA trends that confirm what already happened. AI-driven process optimisation converts every SCADA measurement into a forward-looking adjustment that keeps the plant operating at its performance target rather than responding to deviations after they occur.
The documented evidence is consistent across treatment plant deployments. AI coagulant dose models achieve up to 98.5% prediction accuracy — matching or exceeding the best jar test correlation while updating every SCADA scan cycle instead of once per shift. Chemical consumption reductions of 25% are achievable when AI models minimise the safety margin that manual dosing requires. Filter run times increase as floc character improves with optimised polymer dosing. And continuous compliance forecasting gives the process engineer the one thing that manual operation cannot provide: lead time.
iFactory's treatment plant optimisation platform is designed for process engineers who need to move beyond reactive process control. Book a Demo to see the AI chemical feed optimiser configured for your plant's raw water profile and treatment train configuration, or talk to an expert about a free process optimisation assessment using your plant's historical data.
Frequently Asked Questions
Raw Water Changes Faster Than Any Manual Jar Test Can Track. AI Chemical Feed Optimisation Keeps the Treatment Train Ahead of Every Shift. Get a Free Process Optimisation Assessment.
iFactory's treatment plant optimisation platform — AI chemical feed optimisation across coagulants, polymers, and disinfectants with 98.5% documented prediction accuracy, filter performance analytics that extend run times, and continuous compliance forecasting that converts every process measurement into a forward-looking compliance signal.