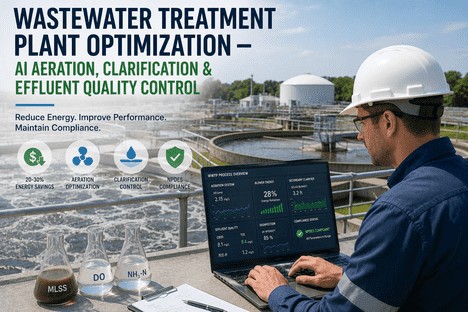
Wastewater Treatment Plant Optimization — AI Aeration, Clarification & Effluent Quality Control
By Grace on June 20, 2026
Every wastewater treatment plant operates under a fundamental efficiency contradiction: the aeration blowers that consume 50 to 60 percent of the plant's total electricity run at fixed dissolved oxygen setpoints that were calibrated for average loading conditions on an average day — but there is no average day. Influent flow varies by the hour, organic load spikes with industrial discharges and wet weather events, temperature shifts microbial kinetics across seasons, and regulatory discharge limits continue to tighten. The process engineer responsible for effluent compliance and energy expenditure operates between two unacceptable outcomes: over-aerate to guarantee compliance and waste 20 to 30 percent of the plant's energy budget, or under-aerate to save energy and risk an NPDES permit violation that carries fines, enforcement action, and public notification requirements. This trade-off has defined wastewater treatment operations for decades — and AI-powered process optimization eliminates it entirely. By predicting influent loading before it enters the biological treatment zone and adjusting aeration intensity, chemical dosing, and clarification parameters in real time, AI platforms achieve documented energy reductions of 20 to 30 percent on aeration blowers while simultaneously improving effluent quality and reducing permit violation risk. This is the process engineer's guide to deploying AI at the intersection of treatment optimization and compliance assurance.
50–60%
of WWTP energy is aeration
Aeration blowers and diffusers consume the majority of plant power — representing the single largest operational expenditure after labour and the primary target for AI-driven optimization
20–30%
aeration energy reduction
Documented energy savings from AI-based aeration control across full-scale plants in Germany, France, the US, China, and Denmark — with no capital infrastructure upgrades required
90%
fewer DO overshoot events
AI-based dissolved oxygen control reduced overshoot events by over 90% in a full-scale deployment — maintaining DO within 0.5 mg/L of setpoint for 53 consecutive days without operator intervention
$180K
annual OPEX reduction
Annual operational expenditure savings documented from a single WWTP deployment of LSTM-Fuzzy hybrid aeration control — achieved through energy reduction, chemical savings, and reduced manual intervention
AI Aeration Control · Effluent Quality Prediction · NPDES Compliance · Chemical Dosing Optimisation
The Trade-Off Between Energy Cost and Permit Compliance Is the Defining Constraint of Every WWTP. AI Eliminates It by Predicting Loading Before It Reaches the Aeration Basin.
iFactory's AI process optimization platform connects to your existing SCADA and PLC infrastructure, builds predictive models of influent loading and effluent quality, and adjusts aeration, chemical dosing, and clarification setpoints in real time — reducing energy consumption while maintaining or improving NPDES compliance.
The Four Inefficiencies That Keep WWTP Operations Reactive — and How AI Resolves Each One
The gap between a treatment plant that achieves 20 percent aeration energy savings and one that over-aerates by 30 percent is not the equipment. It is the control logic. Fixed setpoint operation, single-parameter feedback loops, and operator-dependent adjustments create four structural inefficiencies that AI replaces with predictive, multi-parameter optimisation.
Most WWTP aeration tanks operate at a fixed DO setpoint of 2.0 mg/L regardless of actual influent loading. This approach was developed when continuous DO sensors were unreliable and operators needed a conservative default. Today, it means the plant delivers the same aeration intensity at 2:00 AM when loading is minimal as it does at 10:00 AM during the morning peak — wasting energy during low-load periods and potentially under-aerating during high-load events. ML models that predict influent BOD and ammonia loading 2 to 4 hours ahead enable dynamic DO setpoint adjustment that matches aeration intensity to actual oxygen demand, eliminating the waste. Full-scale deployments document 23 to 30 percent energy reductions from dynamic DO control alone, with no degradation in effluent quality.
AI solution: Dynamic DO setpoints based on predicted influent loading — aeration matched to real-time oxygen demand.
Conventional aeration control uses PID loops that adjust blower output based on current DO measurement — a feedback-only architecture that responds only after the DO has already deviated from setpoint. Because aeration basins are large and process response times are measured in tens of minutes, the PID loop is always behind the actual loading condition: it corrects for yesterday's load while today's peak flows through the plant. Feedforward control using AI-predicted influent loading eliminates this lag. By forecasting BOD, ammonia, and flow rate from historical SCADA data and online sensors, the AI system adjusts aeration setpoints before the load reaches the biological zone — reducing DO excursions by over 90 percent in documented deployments and maintaining stable effluent quality through diurnal peaks and wet weather events.
AI solution: Feedforward prediction of influent load enables preemptive aeration adjustment — eliminates PID lag.
03
Chemical Dosing and Aeration Operate in Isolation
Aeration intensity, chemical coagulant dosing for phosphorus removal, and carbon source addition for denitrification are typically controlled by separate loops that do not share information. An increase in aeration that strips CO2 and raises pH can affect chemical precipitation efficiency. A change in chemical dose that reduces incoming BOD to the biological zone can alter oxygen demand. Without cross-process coordination, each loop compensates for the others' adjustments in a cycle of reactive corrections. AI models that predict the interdependent effects of aeration, chemical dosing, and carbon addition across the treatment train enable coordinated setpoint optimisation that achieves effluent targets with minimum combined energy and chemical cost.
AI solution: Multi-parameter optimisation coordinates aeration, chemical, and carbon dosing across the treatment train.
04
Operator Reliance on Manual Adjustment Limits Responsiveness
Even with SCADA-enabled control, many WWTPs rely on operator judgement to adjust aeration setpoints, chemical feed rates, and sludge wasting rates in response to changing conditions. The quality of this adjustment depends on the operator's experience, the shift schedule, and the availability of real-time data presented in a form that supports rapid decision-making. During night shifts, weekends, and holiday periods, setpoint adjustments are delayed or omitted. AI-based control systems that operate continuously — performing setpoint optimisation every 1 to 5 minutes without requiring operator attention — eliminate this variability. In a documented 6-month deployment of an LSTM-Fuzzy hybrid controller, the system maintained DO within 0.5 mg/L of setpoint for 53 consecutive days with almost no operator intervention, reducing annual OPEX by $180,000 compared to the baseline period.
AI solution: Continuous autonomous setpoint optimisation eliminates shift-dependent variability in treatment performance.
Dynamic DO Control · Feedforward Prediction · Multi-Parameter Coordination · Autonomous Setpoint Optimisation
Four Inefficiencies That Waste 20–30% of Every WWTP Energy Budget. AI Replaces Fixed Setpoints With Predictive, Coordinated, and Autonomous Process Control.
iFactory's AI platform connects to existing plant SCADA and PLCs — read-only data access, no control system modifications — and deploys influent prediction models, multi-parameter optimisation, and autonomous setpoint adjustment within existing plant architecture.
The AI Treatment Optimisation Architecture: From Influent Prediction to Effluent Assurance
iFactory's process optimisation platform operates across three integrated layers — predictive influent forecasting, real-time multi-parameter optimisation, and closed-loop compliance assurance — each performing a distinct function that together transforms a reactive plant into a predictive one.
Layer 01
Influent Forecasting Engine
The forecasting engine ingests historical SCADA data — influent flow rate, BOD, COD, TSS, ammonia, phosphorus, temperature, pH, and conductivity — along with external data streams including weather forecasts and seasonal patterns. ML models trained on 12 to 36 months of plant operating history predict influent loading for the next 2 to 8 hours with typical R2 values above 0.90 for flow and ammonia, and above 0.85 for BOD and COD. These predictions are the feedforward input to the optimisation layer — enabling aeration and chemical adjustments before the load reaches the biological zone rather than after the DO has already deviated.
Prediction horizon: 2–8 hours ahead. Update frequency: every 5–15 minutes.
Layer 02
Multi-Parameter Optimisation Core
The optimisation core receives the influent forecast and computes optimal setpoints for aeration blower output (DO targets per zone), chemical coagulant dose (phosphorus removal), carbon source addition (denitrification), and return activated sludge rate. The optimisation objective is to minimise total operational cost — aeration energy, chemical consumption, and sludge production — while maintaining all effluent parameters within permit limits with a configurable safety margin. The model accounts for cross-process interactions: aeration rate affects pH and alkalinity, which affects chemical precipitation efficiency; chemical dose affects BOD loading to the biological zone, which affects oxygen demand. The optimisation runs every 5 to 15 minutes and updates setpoints automatically via write commands to the existing PLC or DCS.
The compliance layer continuously monitors effluent quality parameters — BOD, COD, TSS, ammonia, total nitrogen, total phosphorus, pH, and dissolved oxygen — against permit limits and generates real-time compliance status for each parameter. If the optimisation model's setpoint recommendations would cause any effluent parameter to approach its permit limit within the safety margin, the compliance layer overrides the optimisation and applies a conservative setpoint until the risk passes. The compliance layer also maintains a complete audit trail of every setpoint change, every effluent measurement, and every compliance assessment — exportable in NPDES reporting format for direct submission to regulatory authorities. This closed-loop architecture ensures that energy optimisation never compromises permit compliance.
Compliance check: every optimisation cycle. Audit trail: every setpoint change logged automatically.
What the AI Process Optimisation Dashboard Shows the Process Engineer
The process engineer's dashboard is designed around the operational questions that determine whether the plant is operating efficiently and in compliance: What is the current energy intensity per unit of load removed? Is the effluent trending toward any permit limit? Where is the next loading peak expected and is the aeration system ready for it? Every view is generated from the same predictive models that drive the autonomous setpoint optimisation.
Process View 01
Live Energy Intensity per Unit of Load Removed
Energy consumption per kilogram of BOD and ammonia removed is tracked in real time and displayed as a trend against the historical baseline. This metric — the true measure of aeration efficiency — reveals immediately whether the plant is over-aerating relative to the actual load entering the biological zone. The dashboard also displays the current energy cost per million gallons treated, with projected daily and monthly totals based on current operating conditions. Process engineers see the efficiency impact of every setpoint change and every loading event in near real time rather than discovering it in the monthly energy bill.
Process View 02
Effluent Quality Trend With Permit Limit Margins
Every effluent parameter subject to NPDES permit limits is displayed as a real-time trend with the permit limit line and the AI-computed safe operating margin overlaid. Parameters approaching the permit limit are flagged in amber when within 80 percent of the limit and in red when within 95 percent. The dashboard also shows the forecasted effluent trajectory for the next 2 to 4 hours based on current influent loading and treatment setpoints — enabling the process engineer to see a developing compliance risk before it materialises and to confirm that corrective setpoint adjustments are bringing the parameter back toward the safe zone.
Process View 03
Influent Loading Forecast and Aeration Readiness
The forecast view displays predicted influent flow rate, BOD, and ammonia loading for the next 8 hours alongside the current aeration capacity and DO setpoint. When the forecasted load exceeds the current aeration capacity — during a forecasted wet weather event, an industrial discharge surge, or a seasonal temperature shift that increases biological activity — the dashboard alerts the process engineer before the load arrives. The system also recommends preemptive aeration setpoint adjustments to ensure the biological zone has sufficient dissolved oxygen capacity to handle the predicted peak without resorting to emergency blower activation.
Process View 04
Aeration Zone DO Distribution and Blower Efficiency
A detailed view of dissolved oxygen concentration across each aeration zone — showing the actual DO profile versus the AI-optimised target profile — with blower-specific performance metrics including specific power consumption (kW per standard cubic foot per minute), turndown status, and deviation from best efficiency point. Process engineers can identify zones where DO is consistently above target (indicating over-aeration and wasted energy) or below target (indicating under-aeration and compliance risk) and confirm that the optimisation model has correctly distributed airflow across the basin. The blower efficiency view also identifies units operating below their nominal speed range where energy efficiency degrades significantly.
Process View 05
Chemical Consumption and Optimisation Savings Tracker
Chemical coagulant and carbon source consumption are tracked against the baseline period before AI optimisation, with savings calculated in both volume and cost. The view also displays the chemical cost per million gallons treated and per kilogram of phosphorus removed — enabling process engineers to verify that chemical dose optimisation is achieving the predicted savings without compromising effluent phosphorus limits. AI models that coordinate aeration and chemical dosing typically achieve 10 to 18 percent chemical savings in addition to aeration energy reductions, as demonstrated in documented deployments of hybrid ML control systems.
Process View 06
NPDES Compliance Report and Audit Export
A complete compliance record showing every effluent measurement, every setpoint change, every compliance assessment, and every optimisation action taken during the reporting period — generated automatically and exportable in the format required for NPDES discharge monitoring reports. The compliance view also displays the number of consecutive days of full permit compliance, the closest approach to each permit limit during the period, and the AI system's documented contribution to maintaining compliance through loading events that would have caused exceedances under fixed-setpoint operation. For utilities subject to EPA enforcement actions or consent decrees, this record provides objective evidence that the plant is operating under a proactive compliance management programme.
"
Our aeration system was running at a fixed DO setpoint of 2.0 mg/L across all three biological treatment trains regardless of actual loading — the industry standard approach. When we deployed the AI optimisation platform, the first thing it showed us was that two of the three trains were significantly over-aerated during low-load periods while the third was occasionally under-aerated during morning peak loading. The model started predicting influent ammonia loading four hours ahead and adjusting DO setpoints per train based on actual expected load. Within 30 days, we reduced aeration energy consumption by 24 percent. The ammonia effluent concentration actually improved because we were aerating the right zones at the right intensity rather than applying uniform aeration across all trains. The system ran for 47 consecutive days without any operator adjustment to the aeration setpoints — our operators shifted from manual DO adjustment to exception-based oversight of an autonomous system.
— Senior Process Engineer, Municipal WWTP — Modified Ludzack-Ettinger Process, 40 MGD Design Capacity
Conclusion
Wastewater treatment plant optimisation is not constrained by a lack of operational data. It is constrained by control architectures that treat every day as an average day and every loading condition as equivalent. The aeration blowers that consume 50 to 60 percent of the plant's energy budget run at fixed DO setpoints that were established when continuous monitoring was unreliable — and those setpoints remain unchanged through diurnal loading cycles, wet weather events, industrial discharge surges, and seasonal temperature shifts that fundamentally alter the oxygen demand profile of the biological treatment process. The result is a plant that over-aerates during low-load periods (wasting 20 to 30 percent of aeration energy) and under-aerates during peak events (risking permit compliance).
AI-powered process optimisation resolves this structural inefficiency by replacing fixed setpoints with predictive, multi-parameter, and autonomous control. Influent forecasting models predict loading 2 to 8 hours ahead and adjust aeration before the load reaches the biological zone. Multi-parameter optimisation coordinates aeration, chemical dosing, and carbon addition across the treatment train — eliminating the reactive corrections that occur when each control loop operates independently. Closed-loop compliance assurance ensures that energy optimisation never compromises permit limits. The documented results across full-scale deployments in Germany, France, the United States, China, Denmark, and the United Kingdom are consistent: 20 to 30 percent aeration energy reduction, 90 percent or greater reduction in DO overshoot events, 10 to 18 percent chemical savings, and annual OPEX reductions measured in hundreds of thousands of dollars per plant.
iFactory's AI process optimisation platform is designed for process engineers who need to reduce energy expenditure and chemical consumption without increasing permit violation risk. Book a Demo to see the platform configured for your plant's treatment process configuration and NPDES permit limits, or talk to an expert about a free energy intensity and compliance margin assessment for your WWTP.
Frequently Asked Questions
No. The iFactory platform connects to existing plant control systems through read-only OPC-UA or Modbus data acquisition — ingesting SCADA historian data and online sensor readings without any modifications to the existing PLC code, DCS configuration, or control network architecture. The optimisation model generates setpoint recommendations that are written to a separate database table or OPC tag that the existing control system reads as its setpoint input — the same way a human operator would enter a setpoint change through the HMI. This means the existing control logic remains fully intact as a safety layer: if the AI platform goes offline or the connection is lost, the control system defaults to its last setpoint or a failsafe mode. No PLC programming changes, no control network reconfiguration, and no write-access to safety-critical control loops are required. Talk to an expert to review the connection architecture for your specific plant's SCADA and control system configuration.
The primary training data consists of historical SCADA historian records — typically 12 to 36 months of continuous operating data including influent flow rate, BOD, COD, TSS, ammonia, total phosphorus, pH, temperature, conductivity, DO readings per aeration zone, blower power consumption and airflow, chemical feed rates, and effluent quality measurements. Most plants already collect the majority of these parameters through their existing online instrumentation and laboratory sampling programme. External data inputs include hyperlocal weather forecasts (precipitation probability, intensity, and duration) and seasonal temperature projections. The model also benefits — but does not require — data from upstream collection system sensors or industrial discharge permits that provide advance notice of loading events. The model begins generating usable predictions after approximately 4 weeks of data ingestion and baseline establishment, with accuracy improving progressively as the model accumulates more operating history and learns plant-specific loading patterns and process response characteristics. Book a Demo to review the data requirements checklist for your plant's instrumentation and SCADA configuration.
The closed-loop compliance assurance layer is designed as an override control that takes precedence over energy optimisation whenever a compliance risk is detected. The system continuously monitors every effluent parameter against its permit limit with a configurable safety margin — typically set at 80 percent of the permit limit as a warning threshold and 90 percent as an action threshold. If the optimisation model's setpoint recommendations would cause any effluent parameter to approach the action threshold, the compliance layer overrides the optimisation setpoint and applies a conservative setpoint that brings the parameter back toward its target operating range. The override is time-limited: once the parameter returns to a safe operating zone, the compliance layer releases the override and the optimisation model resumes its normal operation. Every override event is logged with the parameter value that triggered it, the setpoint adjustment applied, and the time to resolution — creating a documented record that demonstrates the system's compliance-first design to regulatory inspectors. In documented deployments, this architecture has maintained 100 percent permit compliance while achieving 20 to 30 percent aeration energy reduction, proving that the energy-versus-compliance trade-off is a false dichotomy. Talk to an expert about configuring compliance safety margins for your specific NPDES permit limits and treatment process configuration.
Yes. The platform's model architecture is process-agnostic and has been deployed across conventional activated sludge, modified Ludzack-Ettinger (MLE) for biological nutrient removal, sequential batch reactors (SBR), membrane bioreactors (MBR), oxidation ditches, and trickling filter configurations. The model adapts to the specific process configuration by learning the relationships between the plant's unique set of control variables (aeration zones, chemical dosing points, recirculation rates, sludge wasting) and observed effluent outcomes from historical SCADA data. For plants with multiple parallel treatment trains — which is common in larger facilities — the model develops separate baselines and optimisation strategies for each train, accounting for differences in loading distribution, aeration equipment performance, and biological community composition. The platform has also been deployed at industrial wastewater treatment plants serving food processing, chemical manufacturing, and pharmaceutical facilities, where influent variability is significantly higher than municipal plants and the economic case for AI optimisation is correspondingly stronger. Book a Demo to see the platform configured for your specific treatment process type and plant configuration.
Your Aeration Blowers Are Running at Fixed Setpoints While Your Influent Loading Changes Every Hour. AI Closes the Gap Between Energy Input and Real-Time Oxygen Demand. Get a Free Energy Intensity and Compliance Margin Assessment.
iFactory's AI process optimisation platform for wastewater treatment plants — predictive influent forecasting, multi-parameter aeration and chemical optimisation, autonomous setpoint control, and closed-loop NPDES compliance assurance — built for process engineers who need to reduce energy expenditure without increasing permit violation risk.