Building Energy Benchmarking — ENERGY STAR Portfolio Manager & AI Optimization Analytics

By Grace on June 20, 2026

building-energy-benchmarking-energy-star-portfolio-manager-ai

On May 1, 2026, every building owner in New York City over 25,000 square feet must submit their twelfth consecutive month of energy and water data through ENERGY STAR Portfolio Manager or face quarterly fines of $500. In Washington D.C., the threshold drops to 10,000 square feet starting this year. In Maryland, third-party verification is now mandatory. In Colorado, buildings must demonstrate a 7% emissions reduction by 2026 or begin paying performance penalties. These are not isolated municipal requirements. They are the leading edge of a regulatory wave that has expanded from three cities in 2008 to more than fifty jurisdictions today — with Building Performance Standards now enforcing actual energy reduction targets, not just disclosure. The era of voluntary benchmarking is over. For operations directors managing multi-building portfolios, the question is no longer whether to benchmark. It is whether your current approach to benchmarking — spreadsheets, manual data entry, annual compliance scrambles — is exposing your organisation to penalties, missed savings, and regulatory risk that AI-powered energy analytics eliminates entirely.

ENERGY STAR Portfolio Manager · AI Benchmarking · BPS Compliance · Energy Optimization Analytics
Fifty Jurisdictions Now Mandate Energy Benchmarking. Your Compliance Strategy Should Not Be a Spreadsheet.
iFactory connects your building data directly to ENERGY STAR Portfolio Manager, automates compliance reporting across every jurisdiction, and applies AI optimisation analytics that turn benchmarking from a regulatory obligation into a portfolio-wide energy reduction engine.

The Benchmarking Mandate Is Expanding Faster Than Most Portfolio Teams Can Keep Up

What began as a trio of city-level ordinances in 2008 has become a nationwide compliance framework that now covers more than half of all U.S. commercial building space. New York's Local Law 97 imposes carbon emission caps with penalties of $268 per metric ton over the annual limit. Washington D.C.'s BEPS programme requires buildings to meet performance thresholds or follow prescribed improvement pathways or face penalties up to $10 per square foot. Colorado mandates 7% emissions reductions every five years. Washington State's Clean Buildings Standard enforces Energy Use Intensity targets with compliance deadlines beginning June 1, 2026. Across all jurisdictions, ENERGY STAR Portfolio Manager has become the universal compliance platform — yet most building owners still manage their benchmarking through manual utility data entry, annual compliance scrambles, and disconnected spreadsheets that provide no operational insight between reporting deadlines.

50+
U.S. jurisdictions with mandatory energy benchmarking or Building Performance Standards — up from 3 cities in 2008
25%
of U.S. commercial building space already actively benchmarked in Portfolio Manager — the rest faces growing compliance risk
$10
Per square foot penalty for non-compliance in Washington D.C. BEPS — a 100,000 sq ft building faces $1M exposure
18%
Median verified energy savings from AI-driven building optimisation across 1,200+ commercial deployments

What ENERGY STAR Portfolio Manager Does and What It Does Not Do

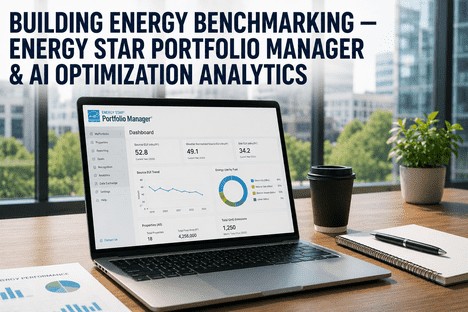
ENERGY STAR Portfolio Manager is the industry-standard benchmarking tool developed by the EPA. It allows building owners to track energy and water consumption, generate a 1-to-100 ENERGY STAR score that compares performance against similar buildings nationwide, and produce compliance reports for any jurisdiction that requires them. A score of 50 represents median performance. Buildings scoring 75 or higher may qualify for ENERGY STAR certification. The platform is free, secure, and supports every commercial building type. It has transformed how building performance is measured and compared.

But Portfolio Manager is a measurement tool. It does not optimise your energy consumption. It does not detect the faulty damper actuator that is wasting 12% of your HVAC energy. It does not tell you which building in your portfolio will benefit most from a retrofit investment. And it does not automate the data collection process that consumes hundreds of hours of staff time every year across a multi-building portfolio. It answers the question "how is my building performing?" It does not answer "what should I do about it?" That is the gap that AI-powered energy analytics fills.


Layer 01
Automated Data Collection — Eliminate the Manual Utility Data Entry That Drains Hundreds of Hours Per Year
Labour Elimination

The single biggest operational cost of energy benchmarking is not the software. It is the staff time spent collecting utility bills, normalising data formats, entering consumption into Portfolio Manager, and troubleshooting data quality errors that trigger compliance flags. For a portfolio of twenty buildings across five jurisdictions with different reporting deadlines, the annual labour cost of manual benchmarking routinely exceeds $40,000. iFactory connects directly to utility data feeds, building management systems, and submeter infrastructure to populate Portfolio Manager automatically — with real-time consumption data that eliminates the lag between measurement and action. The compliance reports that previously required two weeks of staff effort are generated in minutes.

Direct utility data integration
Automated Portfolio Manager population
Jurisdiction-specific compliance report generation

Layer 02
AI Fault Detection and Diagnostics — Find the 12% Energy Waste Hidden in Your HVAC Systems
Waste Identification

Portfolio Manager tells you that a building has an ENERGY STAR score of 48. It does not tell you that the air handling unit economizer damper has been stuck open for six months, that the chiller plant is operating on a manual override schedule from a tenant improvement project two years ago, or that the VAV box reheat valves are opening simultaneously with cooling because the zone temperature sensors drifted calibration. iFactory's AI fault detection layer continuously analyses HVAC system data, lighting consumption patterns, and plug load profiles to identify the specific equipment-level faults driving portfolio energy waste. Verified data from the Lawrence Berkeley National Laboratory across 312 commercial HVAC optimisation projects shows median energy savings of 18%, with buildings that had deferred maintenance or outdated controls achieving savings at the higher end of the range.

Real-time HVAC fault detection
Equipment-level waste attribution
Prioritised repair recommendations

Layer 03
Portfolio-Wide Investment Prioritisation — Know Which Building Will Deliver the Highest ROI Before You Spend a Dollar
Capital Allocation

When an operations director manages twenty buildings across multiple jurisdictions with different compliance deadlines, ENERGY STAR scores ranging from 32 to 89, and a limited capital budget for energy improvements, the decision about where to invest first determines the portfolio's compliance trajectory and financial return for years. iFactory's AI analytics layer ranks every building in your portfolio by energy reduction potential, compliance risk exposure, and projected ROI for each improvement pathway. The platform models the financial impact of HVAC upgrades, lighting retrofits, envelope improvements, and control system modernisation against your specific utility rates, jurisdiction requirements, and available incentive programmes — so capital allocation decisions are driven by data, not by whichever building has the loudest facility manager.

Building-level savings potential scoring
Compliance risk and penalty exposure analysis
Incentive and rebate programme matching

The Compliance Timeline Is Accelerating — Every Jurisdiction Has Different Rules and Every Deadline Matters

An operations director managing buildings across multiple states cannot afford to track compliance requirements through manual calendar entries. The regulatory landscape is shifting too fast. New York City's Local Law 97 began carbon emission cap enforcement in 2025 with escalating penalties. Washington D.C. expanded benchmarking to buildings over 10,000 square feet starting in 2026. Maryland now requires third-party data verification for 2025 data submitted by June 1, 2026. Colorado moved its reporting season to July through November and removed non-compliance penalties for 2026 targets but established a new Building Decarbonization Enterprise fund with a $400 fee per covered building. Washington State's Clean Buildings Standard begins compliance enforcement on June 1, 2026. Missing any of these deadlines triggers fines, penalty accumulation, and regulatory scrutiny that compounds with every subsequent reporting period.

Key 2026 Compliance Deadlines Every Portfolio Operations Director Must Know
Jurisdiction
Deadline
Requirement
New York City
May 1, 2026
LL84 benchmarking + LL97 carbon cap compliance. Penalties: $500/quarter late filing + $268/MT CO2 over cap.
Washington D.C.
May 1, 2026
BEPS benchmarking. Expanded to buildings over 10,000 sq ft. Penalties: up to $10/sq ft for non-compliance.
Maryland
June 1, 2026
BEPS benchmarking. Third-party verification required for 2025 data. Buildings over 35,000 sq ft covered.
Colorado
Nov 1, 2026
BPC benchmarking. 7% emissions reduction target. $400/ building decarbonization fee. Buildings over 50,000 sq ft.
Washington State
June 1, 2026
Clean Buildings Standard. EUI targets or approved investment pathway. Tier 1 deadlines begin.

From Benchmarking to Optimisation — The Operational and Financial Case for AI-Powered Energy Analytics

The regulatory pressure to benchmark is real and growing. But the organisations that extract the highest value from energy compliance are those that treat benchmarking not as a reporting obligation but as the foundation of a portfolio-wide energy optimisation programme. The AI energy optimisation market reached $8.4 billion in 2025 and is projected to hit $19.2 billion by 2028. Verified data from more than 1,200 commercial deployments compiled by Lawrence Berkeley National Laboratory shows median energy savings of 18%, with commercial offices achieving 17%, data centres 23%, and healthcare facilities 16%. Typical payback periods range from 18 to 36 months for buildings over 100,000 square feet with modern BMS infrastructure. The ACEEE reports that organisations reduce energy use by 10 to 25% using building energy management and control systems enhanced by AI.

18%
Median verified energy savings across 1,200+ commercial building AI optimisation deployments with full measurement and verification
10-25%
Energy reduction range reported by ACEEE for commercial buildings using AI-enhanced energy management and control systems
$19.2B
Projected global AI energy optimization market by 2028, growing at 18%+ CAGR from $8.4 billion in 2025
18-36 mo
Typical payback period for AI energy optimisation in buildings over 100,000 sq ft with modern BMS infrastructure

We were managing compliance across eighteen buildings in four jurisdictions with separate benchmarking deadlines, different utility data formats, and a spreadsheet-based tracking system that consumed roughly 300 staff hours per year. The first year on iFactory, we eliminated the manual data entry entirely, cut our compliance preparation time from three weeks to two days, and identified $187,000 in annual energy savings from HVAC faults that Portfolio Manager scores had flagged as underperformance but could not diagnose. The compliance reports that used to trigger panic two weeks before every deadline now generate automatically. Benchmarking used to be our biggest operational headache. Now it is the data foundation for our entire energy reduction programme.

— Director of Operations, Regional Commercial Real Estate Portfolio — 1.8M Square Feet Across 18 Buildings

Conclusion

Energy benchmarking is no longer a voluntary best practice. It is a regulatory requirement enforced by more than fifty jurisdictions across the United States, with Building Performance Standards that impose real financial penalties for non-compliance and real reduction targets that escalate every five years. Operations directors managing multi-building portfolios face a rapidly expanding compliance landscape where the cost of manual benchmarking is measured not just in staff hours but in missed savings, penalty exposure, and the absence of the portfolio-wide energy intelligence that AI-powered analytics provides. iFactory connects your building data directly to ENERGY STAR Portfolio Manager, automates compliance reporting across every jurisdiction your portfolio operates in, and adds the AI optimisation layer that transforms benchmarking from a regulatory obligation into an energy reduction engine — with fault detection, investment prioritisation, and portfolio-wide savings that pay for the platform multiple times over within the first year.

The regulatory deadlines are not slowing down. The penalties are not decreasing. And the technology to turn compliance from a cost centre into a competitive advantage is available today. Book a Demo to see how iFactory maps to your portfolio's specific jurisdictional requirements, or Talk to an Expert to assess your current benchmarking compliance status and identify the savings hidden in your Portfolio Manager data.

Frequently Asked Questions

iFactory works alongside ENERGY STAR Portfolio Manager as an intelligent data layer. It connects directly to your Portfolio Manager account via EPA's secure API, automating the data population process that is otherwise done manually. Utility consumption data, building attribute updates, and occupancy changes flow from iFactory into Portfolio Manager automatically. The AI analytics layer operates on the same data to provide fault detection, savings projections, and investment prioritisation that Portfolio Manager does not offer. You maintain your Portfolio Manager account for ENERGY STAR scoring and jurisdiction compliance. iFactory eliminates the manual work and adds the optimisation intelligence. Book a Demo to see the integration live.

No historical data is lost. iFactory reads your existing Portfolio Manager data, including historical consumption, ENERGY STAR scores, and property attributes, through the EPA API connection. All historical benchmarking data remains in your Portfolio Manager account and is accessible through iFactory's dashboard alongside new data. The transition is additive, not disruptive — your existing compliance records, ENERGY STAR certification status, and score trends are preserved and enhanced with iFactory's analytics layer. Talk to an Expert to review your current Portfolio Manager setup and migration path.

iFactory maintains a jurisdiction compliance registry that maps each building in your portfolio to its applicable regulatory requirements, reporting deadlines, performance targets, and penalty structures. The platform tracks every jurisdiction's specific data format, submission method, and verification requirements — whether it is New York City's LL84 and LL97, Washington D.C.'s BEPS, Colorado's BPC, Washington State's Clean Buildings Standard, or any of the fifty-plus active programmes. Compliance reports are generated automatically in each jurisdiction's required format. The compliance calendar shows every deadline across your entire portfolio in a single view, with automated alerts as deadlines approach. Book a Demo to configure your portfolio's jurisdictional map.

iFactory maintains a complete audit trail of every data point submitted to Portfolio Manager, including source attribution, timestamp, and any transformations applied. For jurisdictions requiring third-party verification, the platform generates the documentation package that verification professionals need, including data source records, meter-to-building mapping, and consumption history. The automated data collection eliminates the most common sources of verification failures: manual entry errors, missing consumption periods, and incorrect property use classification. Maryland's June 1, 2026 deadline for verified 2025 data is approaching rapidly, and iFactory can have your portfolio integrated, data populated, and verification package ready within weeks. Talk to an Expert to assess your readiness for the Maryland BEPS verification requirement.

Your ENERGY STAR Portfolio Manager Data Already Holds the Answers. iFactory Unlocks Them.
Automated compliance reporting across 50+ jurisdictions. AI fault detection and energy optimisation. Portfolio-wide investment prioritisation. One platform connected to your existing Portfolio Manager infrastructure.

Share This Story, Choose Your Platform!