Most Operations Directors managing infrastructure across multiple jurisdictions already sense the problem: two facilities running the same asset class, the same maintenance budget, even the same CMMS — yet one consistently outperforms the other on uptime, cost per asset, and failure frequency. The difference is rarely spend. It is almost always intelligence. Infrastructure benchmarking at fleet scale gives you the tool to identify exactly where that gap lives, replicate what your best-performing sites are doing, and stop allocating capital to interventions that the data does not support.
AI-Powered Benchmarking · Multi-Jurisdiction Intelligence · Fleet-Wide Condition Analytics
Know Which Sites Are Leading, Which Are Lagging, and Exactly What Separates Them — Across Every Asset Class in Your Portfolio.
iFactory delivers AI-powered infrastructure benchmarking as a fully managed service — continuous cross-site performance comparison, jurisdiction-level analytics, and best-practice replication built directly into your operational view.
$4T
Annual global infrastructure gap by 2040 — operators who benchmark performance now capture efficiency gains before the maintenance deficit compounds
25–35%
Reduction in total infrastructure lifecycle costs achieved by organisations implementing systematic preventive benchmarking frameworks
97%
Of infrastructure leaders agree that benchmarking with real-time data is now vital to navigating operational volatility — yet most still rely on static reports
10–15x
The cost differential between emergency repair and preventive intervention — the case for benchmark-driven maintenance prioritisation in every portfolio
Why Cross-Jurisdiction Benchmarking Is the Performance Lever Most Operations Directors Are Not Using
Infrastructure operators managing assets across multiple sites or jurisdictions have a structural advantage that most never extract full value from: the ability to compare like-for-like performance across locations operating the same asset classes under different management approaches. When that comparison is visible, it immediately surfaces the sites running above the fleet average and the sites creating outsized maintenance spend — and, critically, it surfaces the operational patterns that explain the difference.
The barrier has historically been the data. Cross-jurisdiction benchmarking requires consistent condition scoring, normalised maintenance cost tracking, and comparable asset health metrics across systems that were rarely designed to talk to each other. AI changes this by processing heterogeneous data from across a fleet and producing normalised performance indices that make comparison actionable rather than anecdotal.
What Benchmarking Without AI Looks Like
Quarterly spreadsheet reviews aggregated manually from site managers, typically reflecting conditions two to three months prior to the review meeting
Condition scores that vary by inspector, creating inconsistency that makes cross-site comparison unreliable and politically contested
Budget allocation driven by loudest escalations rather than objective condition data — the "worst-first" trap that accelerates deterioration portfolio-wide
Best-practice replication that never happens because no one can identify which sites are performing best or what operational decisions drove that performance
What AI-Powered Benchmarking Delivers
Continuous normalised condition indices updated from live sensor feeds — every site scored on the same objective scale regardless of who inspected what
Ranked fleet-wide view showing which sites and asset classes are exceeding expected condition benchmarks and which are deteriorating faster than the fleet average
Capital allocation supported by deterioration curves and cost-per-intervention data — every budget decision anchored to objective condition evidence, not internal advocacy
Automatic identification of maintenance patterns at top-performing sites that can be systematically replicated across the portfolio
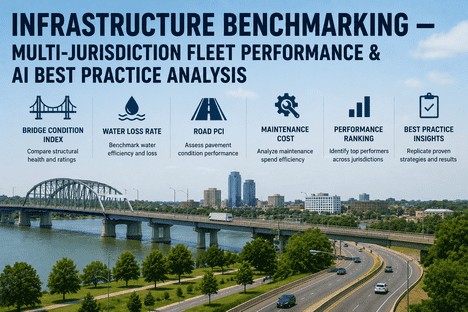
The Four Benchmark Metrics That Define Infrastructure Performance Across Jurisdictions
Effective cross-jurisdiction benchmarking requires a consistent set of performance metrics that translate meaningfully across different site contexts. These four indices are the standard framework that AI-powered infrastructure platforms use to produce comparable performance rankings across mixed asset portfolios.
Bridge Condition Index — Structural Health Across the Fleet
Structural Assets
The Bridge Condition Index aggregates sensor telemetry — strain gauge readings, vibration signatures, tilt measurements — into a single structural health score updated continuously from live monitoring. Benchmarked across a multi-jurisdiction portfolio, it allows the Operations Director to rank structures by deterioration rate rather than chronological age. A bridge built fifteen years ago in a well-monitored, well-maintained jurisdiction can outperform a structure half its age under reactive management. The benchmark exposes this gap. AI models trained on fleet-wide deterioration patterns can predict which structures will breach critical condition thresholds within defined planning windows — prioritising inspection and intervention at the portfolio level before failures reach emergency classification.
Real-time structural telemetry
Deterioration rate ranking
Predictive threshold alerts
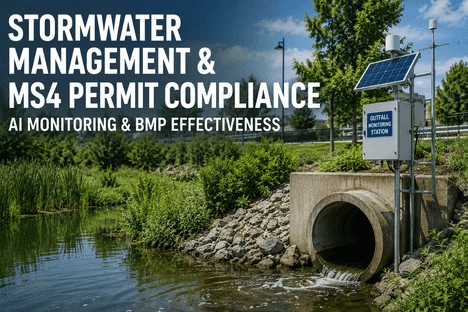
Water Loss Rate — Network Efficiency and Leakage Benchmarking
Water Networks
The International Water Association benchmarks water loss against a standard of 10–15% for well-managed distribution networks. Most multi-jurisdiction operators find that their portfolio spans a wide range — with some networks performing well inside that range and others losing significantly more volume through undetected leakage and infrastructure inefficiency. Without cross-site comparison, each site manager believes their water loss rate is an unavoidable product of pipe age and local conditions. With AI-driven benchmarking, the comparison shows clearly that pipe age is not the primary driver — maintenance approach, sensor coverage, and early leak detection practice are. Sites managing above the fleet average typically have active pressure monitoring and acoustic sensor coverage. Sites operating below it rarely do. The benchmark makes the investment case obvious.
IWA standard comparison
Cross-site loss ranking
Acoustic leak detection integration
Pavement Condition Index — Road Network Health at Fleet Scale
Road Infrastructure
The Pavement Condition Index is a standardised numerical rating from 0 to 100 — codified in ASTM D6433 — that expresses the structural and functional health of a road surface. Because the method is standardised, a PCI score of 72 in one jurisdiction means exactly the same thing as a 72 in another, making it the most reliable cross-jurisdiction comparison metric in road network management. AI-powered PCI tracking replaces periodic manual surveys with continuous condition inference — using vehicle-mounted camera data, environmental sensors, and traffic load modelling to maintain an updated pavement health score across every road segment in the network. When benchmarked at fleet scale, the PCI comparison immediately reveals which jurisdictions are maintaining road surfaces at prevention cost (PCI above 70, where seal coating and minor treatment applies) versus which are allowing surfaces to deteriorate into the rehabilitation and reconstruction bands where the cost per lane-mile increases by a factor of four to seven.
ASTM D6433 standardised scoring
Continuous condition inference
Prevention vs rehabilitation ranking
Maintenance Cost Per Asset — Spend Efficiency Across the Portfolio
All Asset Classes
Maintenance cost per asset is the metric that bridges condition performance and financial performance. A site posting excellent condition scores while spending three times the fleet average per asset is not a benchmark leader — it is a site consuming disproportionate capital to achieve results that other sites achieve at lower cost. AI-powered cost benchmarking normalises spend by asset class, asset age cohort, and operational environment to produce a like-for-like cost efficiency index that shows where the portfolio's maintenance budget is delivering the highest return and where spend is high without a corresponding condition advantage. Leading municipalities invest 2–4% of asset replacement value annually in preventive maintenance and achieve outcomes that reactive organisations spending the same total amount cannot match — because the spend is applied earlier in the deterioration curve, where each dollar prevents ten to fifteen dollars of emergency repair cost.
Normalised cost efficiency index
Spend vs condition correlation
Preventive vs reactive spend ratio
How the Benchmark Gap Compounds Across Jurisdictions Over Time
The performance spread between high-performing and low-performing jurisdictions in the same portfolio does not stay constant — it widens. This is the compounding dynamic that makes early benchmarking visibility so operationally valuable, and late visibility so costly.
The Deterioration Compounding Cycle — Why Benchmark Gaps Widen Without Intervention
Phase 1
Minor condition gap appears
Two jurisdictions diverge slightly in PCI or condition index. The gap is invisible in quarterly reports and appears within normal variance.
Phase 2
Deferred maintenance accumulates
The lagging jurisdiction defers minor treatments. The leading site applies them. The condition gap triples over twelve to eighteen months.
Phase 3
Emergency cost spikes
Assets in the lagging jurisdiction reach failure thresholds. Emergency repairs cost 10–15x more than preventive treatment would have. Capital is diverted from other priorities.
Phase 4
Portfolio performance diverges permanently
Without benchmarking visibility, the gap becomes structural. The lagging jurisdiction requires 2–3x the capital investment to return to fleet-average condition.
The AI benchmark interrupts this cycle at Phase 1 — surfacing the minor gap before deferred maintenance accumulates. Infrastructure operators implementing continuous benchmarking report 50–70% fewer emergency repairs and asset lifespans extended 15–25 years beyond design specifications.
Your Portfolio Already Has the Data. What It Is Missing Is the Comparison That Makes It Actionable.
iFactory's AI benchmarking service turns your existing sensor feeds, CMMS records, and operational data into a live cross-jurisdiction performance ranking — without any internal data science or IT infrastructure investment.
Best Practice Replication — Turning the Top Performer Into the Fleet Standard
Identifying the performance gap is the first output of AI benchmarking. The second — and the one that drives operational improvement — is understanding what the top-performing jurisdiction is doing differently and translating those practices into prescriptive guidance for the rest of the fleet. This is where benchmarking moves from measurement to management leverage.
Maintenance Interval Comparison
AI analysis of maintenance records across the fleet identifies whether top-performing sites are intervening at different frequencies, earlier in the deterioration cycle, or with different treatment types compared to lagging sites operating the same asset class. The pattern is then formalised as a recommended maintenance protocol for the underperforming jurisdictions.
Sensor Coverage Gap Analysis
Benchmarking frequently reveals that top-performing sites have more complete sensor coverage — catching developing anomalies earlier because they have more monitoring points. The gap analysis identifies the specific coverage deficiencies at underperforming sites and quantifies the condition improvement achievable by closing those gaps, making the capital case for sensor expansion straightforward.
Alert Response Behaviour Analysis
AI benchmarking tracks not just condition scores but the time between alert generation and maintenance response across different sites. Sites where alerts are actioned within hours consistently outperform sites where the same alerts sit in a queue for days. This response behaviour analysis identifies where the management workflow — not the asset condition — is the primary driver of the performance gap.
"
We had seventeen sites, all running the same asset types with similar budgets, and we could not explain why three of them were consistently generating emergency call-outs while the rest were not. We assumed it was age or local conditions. Once we had cross-site condition benchmarking live, we could see within six weeks that the three problem sites had a common pattern: slower maintenance response times and lower sensor coverage on a specific asset class. We did not need to spend more. We needed to act faster and monitor more completely. The benchmarking told us where. We closed that gap and the emergency call-out rate dropped by over half in the following quarter.
— Operations Director, Public Infrastructure Portfolio — 19 Sites, 4 Jurisdictions
How iFactory Delivers Multi-Jurisdiction Benchmarking as a Managed Service
iFactory's AI benchmarking capability is not a standalone analytics module. It is embedded within the managed service delivery model — meaning the data integration, model management, and benchmarking dashboard are maintained by iFactory, not by an internal data team that the Operations Director has yet to hire.
iFactory Benchmarking Service — What Is Managed vs What the Operations Director Sees
Managed by iFactory — Behind the Service Layer
What the Operations Director Receives
Cross-site data pipeline integration — sensor feeds, CMMS records, and environmental data normalised into consistent scoring frameworks across all jurisdictions
A single ranked dashboard showing all sites by condition index — updated continuously, not on a quarterly reporting cycle
AI model management across all four benchmark metric types — with ongoing drift detection and retraining as operational conditions and fleet configurations change
Automated identification of which sites are exceeding fleet-average benchmarks and which are deteriorating faster — with the specific asset classes driving each deviation
24/7 monitoring of benchmark deviations — with alert triage that escalates only the conditions requiring director-level attention rather than flooding the dashboard with minor variance
Best-practice analysis reports that identify what top-performing sites are doing differently and translate those patterns into prescriptive guidance for lagging jurisdictions
New site onboarding within service scope — adding a new jurisdiction to the benchmarking view is a service request, not an internal IT project
Capital investment recommendations ranked by portfolio-level impact — showing where spend will deliver the greatest condition improvement relative to current deterioration trajectories
Conclusion
The infrastructure performance gap between the best-managed and worst-managed jurisdictions in a portfolio is not a mystery. It is a data problem. The assets producing the most emergency spend, the highest maintenance cost per unit, and the fastest condition deterioration are following predictable patterns — patterns that become visible the moment you have a continuous, normalised comparison running across every site in the fleet.
AI-powered cross-jurisdiction benchmarking delivers that comparison as a live operational view — not as a quarterly report that reflects conditions three months ago. For Operations Directors managing infrastructure portfolios where capital allocation decisions compound over years, the ability to identify a deteriorating jurisdiction at Phase 1 rather than Phase 4 of the compounding cycle is not incremental improvement. It is the difference between preventive management and reactive damage control.
iFactory's managed benchmarking service makes this capability available without the data science team, the data pipeline project, or the multi-year build timeline. The benchmarking intelligence goes live in weeks, updates continuously, and scales across every new site and jurisdiction you add to the portfolio. Book a demo to see how the cross-jurisdiction benchmarking view maps to your current portfolio, or talk to an expert about your specific asset classes and site count.
Frequently Asked Questions
Stop Guessing Which Sites Are Underperforming. Start Managing With a Live Fleet-Wide Benchmark.
iFactory's AI benchmarking service delivers cross-jurisdiction condition rankings, best-practice analysis, and capital prioritisation intelligence — managed for you, live across your full portfolio, updated continuously.