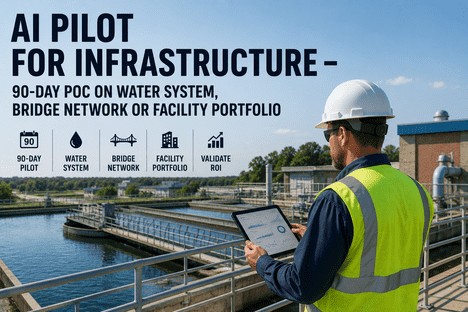
AI Pilot for Infrastructure — 90-Day POC on Water System, Bridge Network or Facility Portfolio
By Grace on June 25, 2026
More than 80% of AI projects in infrastructure and operations never reach production. Gartner's 2026 survey of infrastructure leaders found that only 28% of AI use cases fully succeed and meet ROI expectations, while 20% fail outright. The majority stall somewhere between proof of concept and meaningful deployment — not because the AI technology was inadequate, but because the pilot was poorly scoped, the wrong assets were selected, or the success criteria were defined after the project started rather than before. For a plant manager responsible for water systems, bridge networks, or facility portfolios, the path to AI adoption is not a massive upfront investment — it is a structured 90-day pilot programme that validates prediction accuracy on a controlled set of critical assets before committing to portfolio-wide deployment. iFactory's 90-day AI infrastructure pilot framework gives plant managers a repeatable methodology for selecting pilot assets, defining measurable success criteria, deploying IoT sensor and edge computing infrastructure, and delivering documented ROI within three months — with a clear decision gate for scaling to the full asset portfolio.
90-Day AI Pilot · Infrastructure POC · Water Systems · Bridge Network · Facility Portfolio · Predictive Maintenance
80% of AI Projects Fail Before They Deliver. iFactory's 90-Day Pilot Flips That Odds.
iFactory's structured 90-day AI pilot programme selects your highest-impact assets, deploys sensor and edge infrastructure, validates prediction accuracy against baseline data, and delivers documented ROI before a single dollar is committed to portfolio-wide deployment.
Of AI projects in infrastructure and operations never reach production — the gap is not technology but pilot structure, asset selection, and undefined success criteria
28%
Of AI use cases in infrastructure fully succeed and meet ROI targets — structured pilots with defined success metrics are 3x more likely to reach production
10:1
Typical ROI ratio within 12-18 months for predictive maintenance AI programmes that begin with a properly structured pilot phase on critical assets
30-50%
Reduction in unplanned downtime documented by organisations that move from reactive maintenance to AI-driven predictive programmes after a validated pilot
Why AI Pilots Fail in Infrastructure Organisations — Three Root Causes That a Structured 90-Day Programme Eliminates
The failure rate of AI initiatives in infrastructure is not a technology problem. The same AI models that fail in a poorly structured pilot succeed in a well-structured one. Analysis of stalled AI programmes across water utilities, bridge authorities, and facility operators reveals three consistent root causes — each of which is directly addressed by the structure and discipline of a 90-day phased pilot framework that defines success before deployment begins.
01
Success Was Defined After the Pilot Started — or Was Never Defined at All
The most common failure pattern across stalled AI projects is the absence of a measurable success criterion that was established before data collection began. Organisations deploy sensors, collect data, train models, and then ask: did it work? Without a pre-defined metric — a target reduction in unplanned downtime, a minimum false positive rate, a specific maintenance cost reduction — there is no objective answer. The pilot continues indefinitely, scope creeps, and the project is eventually classified as a learning exercise rather than a decision gate. A structured 90-day pilot defines the success metric, the baseline value, the target threshold, and the measurement methodology on day one — not at week twelve when results are being interpreted.
02
The Wrong Assets Were Selected — Either Too Critical or Not Critical Enough
Asset selection is the most strategically important decision in any AI pilot. Choose assets that are too critical — the primary water pumping station, the main bridge on the interstate route, the facility's lead production line — and the risk of perceived failure during the pilot phase kills the programme before it has data to defend itself. Choose assets that are too peripheral — a rarely used valve, a secondary access road bridge, a backup chiller — and the ROI demonstration is unconvincing when scaled. The correct pilot assets are critical enough that improvement matters but not so critical that the organisation cannot tolerate the learning curve. A structured pilot framework uses an asset criticality matrix to select the three to five assets that occupy the optimal position on the risk-reward curve.
03
The Pilot Was a Technology Project, Not a Business Decision Process
AI initiatives that are led by the IT department or the data science team without embedded operational ownership rarely produce actionable outcomes. The pilot is judged on model accuracy metrics — precision, recall, F1 score — rather than business metrics — avoided downtime events, maintenance cost reduction, extended asset life. When the pilot ends, the operations team has no framework for interpreting the results or making the scale-or-stop decision. A structured pilot is a business process with a pre-defined decision gate at day 90: a documented comparison of pilot results against baseline, a cost-benefit analysis for portfolio-wide deployment, and a recommendation signed by the plant manager who will own the scaled programme, not by the data science team that ran the pilot.
90-Day Pilot · Phased Deployment · Asset Selection · ROI Validation · Decision Gate
Do Not Bet the Portfolio on a Pilot. Bet Three Assets. Validate. Then Scale.
iFactory's 90-day AI pilot framework limits risk to three to five critical assets, establishes measurable success criteria before deployment, and delivers a documented scale-or-stop recommendation at day 90 — not a technology report, but a business case.
The 90-Day AI Pilot Framework — Three Phases from Asset Selection to Scale Decision
The iFactory 90-day AI pilot framework is structured into three sequential phases, each with defined outputs and decision gates. The framework is identical whether the pilot is deployed on water system pumps, bridge structural health sensors, or facility HVAC and chiller plant equipment — the asset type changes, but the methodology for validating AI prediction accuracy and documenting ROI does not.
Phase 1 · Days 1-30
Asset Selection, Baseline Data, and Sensor Deployment
The first phase establishes the foundation that determines whether the pilot produces a credible business case at day 90. Asset selection follows a criticality matrix that scores each candidate asset on failure consequence, current data availability, maintenance cost variability, and failure predictability potential. Between three and five assets are selected. Baseline data is collected for each asset — at least 30 days of current operational data if sensors are already present, or immediate sensor deployment if they are not. The success metric is defined with a specific target: for example, "detect pump cavitation events at least 72 hours before failure with fewer than 15% false positives, reducing unplanned downtime on the selected assets by 40% within the pilot period."
Asset criticality matrix
30-day baseline data
Success metric definition
IoT sensor deployment
Phase 2 · Days 31-60
AI Model Training, Validation, and Real-Time Monitoring
Phase 1's baseline data is used to train initial AI models for anomaly detection, fault classification, and remaining useful life estimation. Models are validated against historical failure data where available. The trained models are deployed on the edge computing hardware installed during Phase 1 and begin processing live sensor data in real time. During this phase, the operations team receives its first alerts from the AI system. Every alert is logged and tracked — true positive, false positive, true negative — to build the accuracy dataset that will determine the scale decision. Weekly review sessions between the iFactory deployment team and the plant manager review alert performance, adjust model thresholds, and document early operational impact.
AI model training and validation
Edge deployment go-live
Alert accuracy tracking
Weekly ops review sessions
Phase 3 · Days 61-90
ROI Validation, Documentation, and Scale-or-Stop Decision Gate
The final phase produces the documented business case that answers the question every plant manager needs to answer: did this pilot deliver measurable value, and should we scale it across the full asset portfolio? Actual alert performance against the success metric defined in Phase 1 is compared to the baseline. Maintenance cost avoidance, downtime reduction, and labour efficiency improvements are quantified. A portfolio-wide deployment cost-benefit analysis is produced, including sensor counts, edge computing hardware, platform licensing, and implementation timeline. The scale-or-stop decision gate at day 90 is a meeting, not a report: the plant manager, operations lead, and iFactory deployment lead review the documented results and make a yes-or-no decision on portfolio-wide deployment with clear supporting evidence.
Results vs. baseline comparison
ROI and cost-benefit analysis
Portfolio deployment cost model
Day 90 scale-or-stop gate
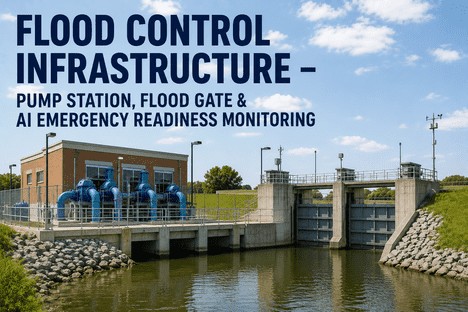
Three Infrastructure Categories — One Pilot Framework Adapted to Each Asset Type
The 90-day pilot framework is structurally identical across infrastructure categories, but the sensor types, AI models, and success metrics are adapted to the specific failure modes of water, bridge, and facility assets. The table below illustrates how the same three-phase methodology applies to each infrastructure category with category-specific parameters.
90-Day AI Pilot Parameters by Infrastructure Category — Water Systems, Bridge Network, and Facility Portfolio
Parameter
Water System Pilot
Bridge Network Pilot
Facility Portfolio Pilot
Recommended Pilot Assets
3-5 pumping stations with variable frequency drives and history of maintenance events. Avoid primary supply stations — select distribution booster stations.
2-3 bridges in fair condition with known deterioration patterns. Avoid both structurally deficient and recently rehabilitated bridges — select mid-lifecycle assets.
3-5 HVAC chillers, cooling towers, or air handling units in a single facility. Select assets with variable load profiles and accessible sensor mounting locations.
Sensor Type
Vibration, pressure, flow rate, power consumption, acoustic sensors for leak and cavitation detection
Vibration, temperature, current draw, refrigerant pressure, thermal imaging for heat exchanger performance
AI Model Objective
Predict pump seal failure, cavitation events, and leak detection 72+ hours before failure with fewer than 15% false positives
Detect crack propagation rate changes, structural deformation, and bearing deterioration from vibration and strain data
Forecast chiller efficiency degradation, compressor failure risk, and cooling tower performance decline 7-14 days before measurable loss
Success Metric
Reduction in unplanned pump downtime by 40% on pilot assets. Maintenance cost per pump reduced by 25%.
Early detection rate — percentage of structural alerts confirmed during follow-up inspection. Target: 80%+ confirmation rate.
Reduction in emergency HVAC work orders by 35%. Chiller plant energy efficiency improvement of 8-12% from condition-based optimisation.
The Pilot ROI Framework — What to Measure, How to Measure It, and What the Numbers Mean for the Scale Decision
The difference between a pilot that justifies scale and a pilot that sits on a shelf is the ROI framework that was established before the pilot began. iFactory's pilot programme measures five categories of return — each quantified against the baseline data collected in Phase 1 and each directly translatable to portfolio-wide projections.
Downtime Avoidance
Hours of unplanned downtime prevented during the pilot period compared to baseline. Extrapolated to annual hours across full asset portfolio at scale.
Baseline: historical failure data
Maintenance Cost
Emergency repair cost avoided vs. planned intervention cost. Includes labour, parts, and any production or service impact costs.
Baseline: last 12 months invoices
Labour Efficiency
Hours of maintenance labour shifted from reactive to planned work. Measured as percentage of total maintenance hours on pilot assets.
Baseline: reactive vs. planned ratio
Asset Life Extension
Projected life extension from condition-based vs. calendar-based maintenance. Inferred from reduced wear pattern data during pilot.
Baseline: manufacturer life estimates
Accuracy Validation
True positive rate, false positive rate, and lead time between alert and verified failure. Determines operational trust in the AI system.
Baseline: no prior alert system
"
I had seen three AI pilot proposals in five years. Every one of them was a technology vendor asking for access to our data and a six-figure commitment with no clear answer to the question I cared about: will this reduce my unplanned downtime enough to justify the investment? When iFactory proposed a 90-day pilot on three of our distribution pumping stations with a defined success metric — detect seal degradation 72 hours before failure with less than 15% false positives, reducing unplanned downtime by 40% on the pilot assets — I agreed because the risk was contained. At day 60, the system detected a developing bearing fault on our oldest pump that our manual vibration monitoring programme had missed. We scheduled the repair during planned downtime. The cost was $4,200. A catastrophic bearing failure on that pump would have been $47,000 in repair costs plus 14 hours of lost production. At day 90, the pilot results exceeded the success threshold. We signed the portfolio-wide deployment within two weeks.
— Plant Manager, Regional Water Utility — 24 Years Water Infrastructure Operations
Conclusion
The barrier to AI adoption in water, bridge, and facility infrastructure is not the technology — it is the absence of a structured, low-risk methodology for proving that the technology works on the organisation's specific assets with the organisation's specific data and the organisation's specific success criteria. With over 80% of AI projects failing to reach production and only 28% meeting ROI expectations, the risk of launching an unstructured AI initiative is real and well-documented. The organisations that successfully adopt AI-powered predictive maintenance are not the ones that made the largest upfront investment — they are the ones that started with a contained, well-defined pilot on three to five critical assets, validated prediction accuracy against baseline data, documented the ROI in terms that the plant manager and finance team both accept, and used that evidence to build the business case for portfolio-wide deployment.
iFactory's 90-day AI pilot framework gives plant managers a complete, repeatable methodology for infrastructure AI adoption — from asset selection and success metric definition through sensor deployment, model training, alert validation, and documented ROI. With the predictive maintenance market projected to reach $98 billion by 2033 and a typical 10:1 ROI ratio within 12-18 months of validated deployment, the question for infrastructure leaders is not whether AI-powered predictive maintenance works — it is whether they are ready to prove it on their own assets within a contained, low-risk, 90-day pilot that answers the scale question with data rather than speculation. Book a Demo to discuss which three to five assets in your portfolio should be the candidates for a 90-day AI pilot, or talk to an expert about scheduling a pilot scoping session with your operations and engineering team.
Frequently Asked Questions
The 90-day pilot is structured as a fixed-fee engagement with a defined scope and a pre-agreed success metric. If the pilot does not meet the success threshold defined in Phase 1, the organisation has a documented result showing that the selected assets were not suitable candidates for AI-driven predictive maintenance — which is itself a valuable outcome that prevents a larger misallocation of capital. The pilot cost is limited to the fixed fee, and no ongoing commitment is required. iFactory provides the post-pilot analysis explaining what was learned, why the success threshold was not reached, and whether a different asset category or sensor configuration would be expected to produce different results. The scale-or-stop decision is a genuine decision — stopping is a valid and valuable outcome if the data supports it. Talk to an expert to discuss pilot pricing structure and success metric definition for your specific infrastructure category.
Pilot asset selection is the primary mechanism for ensuring representativeness. The criticality matrix used in Phase 1 scores candidate assets on factors that include failure mode diversity, asset age distribution, operational load variability, and data availability. The selected three to five assets are chosen to represent the range of conditions across the full portfolio rather than being the best-behaved or most conveniently instrumented assets. The baseline collected in Phase 1 establishes pre-pilot performance for each metric category — downtime, maintenance cost, labour allocation — and pilot results are compared against this baseline rather than presented as absolute improvements. Any asset-specific factors that could affect generalisation are documented in the day 90 decision report, so the plant manager can make an informed judgement about how pilot results project to the broader asset population. Book a Demo to see how the asset criticality matrix and representativeness analysis work for your specific infrastructure category.
The pilot is designed to work with whatever instrumentation level exists on the selected assets. If assets already have sensors producing usable data — vibration, temperature, pressure, flow, or current draw — those data streams are integrated directly into the AI platform during Phase 1. If the selected assets have limited or no existing instrumentation, iFactory deploys pre-configured IoT sensor bundles as part of the pilot scope. The sensor deployment includes mounting, calibration, network connectivity configuration, and data pipeline validation. For water system assets, typical sensors include vibration and pressure transducers. For bridge assets, accelerometers and strain gauges. For facility assets, vibration and temperature sensors. Installation is managed by iFactory's deployment team in coordination with the plant's on-site maintenance staff, with typical installation requiring two to four hours per asset. Talk to an expert to confirm sensor requirements for your pilot asset candidates.
Portfolio-wide deployment follows the same phased methodology as the pilot, scaled by asset criticality rather than by geography. The day 90 decision report includes a deployment plan that sequences remaining assets into rollout phases — typically four to six waves of 20-50 assets each, depending on portfolio size. Each wave follows the same structure: sensor deployment, model configuration, alert validation, and operational handover. Lessons learned from the pilot and each subsequent wave inform the deployment parameters for the next wave. The edge computing architecture deployed during the pilot is designed to scale — additional assets connect to the same NVIDIA edge devices or to additional edge nodes that feed the same analytics dashboard. The plant manager's operational involvement decreases with each wave as the deployment methodology is standardised and the operations team becomes proficient in managing AI-driven alerts within existing maintenance workflows. Book a Demo to review a sample portfolio deployment plan for your asset class and facility count.
80% of AI Projects Fail. The Ones That Succeed Start With a 90-Day Pilot That Defines Success Before It Deploys Anything.
iFactory's 90-day AI pilot programme gives plant managers the structured methodology to validate prediction accuracy on three to five critical assets and deliver a documented scale-or-stop business case before committing to portfolio-wide deployment.