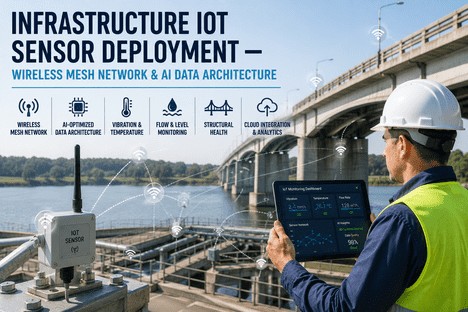
Infrastructure IoT Sensor Deployment — Wireless Mesh Network & AI Data Architecture
By Grace on June 23, 2026
Global IoT sensor deployments surpassed 14 billion active connections in 2025, yet fewer than one in three infrastructure operators can translate that sensor data into actionable maintenance decisions. The gap is not in the hardware — it is in the architecture. Wireless mesh networks, edge computing nodes, and AI-driven analytics pipelines must work as a single coherent system, not a collection of point solutions. Operations directors responsible for bridges, water distribution networks, facility HVAC, and industrial plants face a common problem: how to select, position, connect, and interpret sensor data at scale without building a parallel IT organisation to manage it. This guide covers the complete infrastructure IoT sensor deployment stack — from sensor selection and mesh topology design through AI data architecture and KPI frameworks — written for the operations director who needs a practical, scalable strategy.
Deploy Sensors That Don't Just Collect Data — They Drive Decisions. iFactory Unifies the Full Stack.
iFactory's infrastructure monitoring platform integrates wireless mesh sensor networks with AI analytics and tiered KPI dashboards — so your sensor data becomes operational intelligence, not another database to ignore.
Projected IoT sensor market by 2029, growing at 34% CAGR — the fastest technology adoption curve in industrial infrastructure history
25–40%
Lower installation cost with wireless mesh vs. wired sensor networks — the economic case for skipping the trenching and conduit
99.999%
Time-synchronised mesh network data reliability — exceeding the uptime of most wired industrial fieldbus systems
50B+
Connected IoT devices worldwide as of 2025 — each a potential data point for infrastructure health, if the architecture is designed to use it
The Infrastructure Sensor Taxonomy — Matching the Right Sensor to the Right Asset
Every infrastructure asset class generates different failure signatures. A bridge experiences structural fatigue across decades. A water pump bearing fails in weeks. An HVAC compressor degrades seasonally. Deploying the wrong sensor type — or the right sensor at the wrong sampling frequency — produces data that looks correct in a dashboard and tells you nothing useful about asset health. The table below maps the primary infrastructure asset categories to the sensor types, sampling frequencies, and failure modes they are designed to detect.
Wireless Mesh Network Topology — Self-Healing, Self-Organising, and Purpose-Built for Infrastructure
The difference between a sensor network that works on day one and one that quietly degrades over eighteen months is almost always the mesh topology design. In a star network, every sensor talks directly to a central gateway — and when one sensor loses signal, the data is lost. In a properly designed mesh, every node can relay data from every other node. When a signal path is blocked by a concrete wall, a steel tank, or a passing vehicle, the mesh routes around it automatically. Time-synchronised channel hopping (TSCH) mesh networks deliver over 99.999 percent data reliability in industrial environments — a standard that wired fieldbus systems struggle to match in harsh conditions.
Star Topology
Every sensor connects directly to a central gateway. Simple to configure. Fragile in infrastructure environments — one obstruction, one gateway failure, or one range limitation disconnects the node permanently. Suitable only for open-plan facilities with clear line of sight and fewer than 30 nodes.
Mesh Topology (TSCH)
Every node relays data from neighbouring nodes. When a path degrades, the mesh reroutes in milliseconds across a different frequency channel. Self-healing and self-organising. Delivers >99.999 percent data reliability. Supports hundreds to thousands of nodes across square-kilometre areas. The standard for infrastructure IoT.
Hybrid Star-Mesh
Sensor nodes within a local cluster use star topology to a cluster head. Cluster heads form a mesh backbone. Balances battery life and reliability for large-area deployments with dense local clusters — for example, a wastewater plant with sensor-dense treatment zones spread across a wide site.
The Six Barriers to Reliable IoT Deployment — and How to Engineer Around Them
Wireless sensor networks fail predictably. The same deployment challenges appear across water treatment plants, bridge monitoring projects, and industrial facilities. The difference between a deployment that delivers value and one that generates support tickets is whether these six barriers were addressed in the design phase or discovered in the operations phase.
1
Coverage Gaps and Signal Obstruction
Concrete walls, steel beams, buried pipes, and metallic equipment create radio shadows that disconnect sensors from the network. A mesh topology with at least three redundant paths per node eliminates most coverage gaps without increasing hardware count.
Solution: Deploy a mesh with path diversity >2 and conduct a site survey before installation to map signal shadow zones.
2
Battery Life vs. Sampling Frequency
Every radio transmission consumes battery. Every sensor reading consumes processing power. A vibration sensor sampling at 10-second intervals on a lithium battery lasts approximately 18 months. The same sensor sampling at 60-second intervals lasts over 5 years. Sampling strategy must match the failure mode time scale.
Solution: Use adaptive sampling — low frequency for healthy assets, high frequency when threshold deviations are detected.
3
Data Overload and Alert Fatigue
A 200-node sensor network generating readings every 10 seconds produces over 1.7 million data points per day. Without edge-based pre-processing and tiered alerting, the operations team is overwhelmed by noise and misses the signals that matter.
Solution: Deploy edge analytics that filter, aggregate, and threshold before data reaches the dashboard. Only anomalies generate alerts.
4
Interference from Co-Located Wireless Systems
Industrial environments run Wi-Fi, Bluetooth, cellular, and proprietary radio systems in the same spectrum bands. TSCH mesh networks mitigate this by frequency hopping across 16 channels per transmission, avoiding congested bands dynamically.
Solution: Implement frequency-hopping spread spectrum (FHSS) with per-packet channel diversity in the mesh protocol.
5
Gateway and Backhaul Single Points of Failure
If every sensor depends on one gateway to reach the cloud, losing that gateway means losing the entire deployment. Redundant gateways with automatic failover are essential for critical infrastructure monitoring.
Solution: Deploy dual gateways per zone with cellular failover. Ensure each gateway supports at least 500 nodes in a mesh topology.
6
Data Architecture Without a Decision Pipeline
The most technically sound sensor deployment delivers no value if the data does not connect to a decision. Raw sensor values flowing into a database without threshold logic, trend analysis, and role-based KPI visibility produces a data lake, not an operational tool.
Solution: Architect the data pipeline to produce decisions, not reports. Every sensor stream maps to a specific operational KPI and alert threshold.
Your Sensors Generate 1.7 Million Data Points a Day. iFactory Turns Them Into the 12 Decisions That Matter.
iFactory's AI data architecture processes sensor streams at the edge, applies anomaly detection models, and surfaces only the actionable signals in a tiered KPI dashboard — so your team sees alerts, not noise.
The AI Data Architecture — From Raw Sensor Voltage to Operational Decision in Four Layers
An IoT sensor deployment without a data architecture is a hardware project. An IoT sensor deployment with a data architecture is an operational capability. The difference between data that fills a database and data that drives decisions is the pipeline that connects the sensor to the person who needs to act. The four-layer model below defines how raw sensor signals become operational intelligence.
1
Sensor & Edge Layer
Wireless mesh nodes collect raw vibration, temperature, pressure, flow, and current data. Edge processors apply calibrated scaling, convert analogue signals to engineering units, and discard corrupted or out-of-range samples before transmission. Typical edge processing latency: under 50 milliseconds per reading.
2
Gateway & Network Layer
Gateway nodes aggregate data from mesh clusters, apply network-level de-duplication, and forward cleansed data to the cloud or on-premise server via redundant backhaul (cellular + Ethernet). Gateways maintain local data buffers for up to 72 hours to survive backhaul outages without data loss.
3
AI Analytics & Model Layer
Trained anomaly detection models process the cleansed data stream. Models identify deviations from baseline behaviour — vibration amplitude exceeding three standard deviations from the rolling mean, temperature ramp rates outside expected bounds, pressure drops that indicate leaks. Models improve over time through feedback loops that compare predictions to actual outcomes.
4
KPI & Decision Layer
Anomaly signals are mapped to operational KPIs at three tiers: technician (asset-level alerts and fault codes), supervisor (zone-level trend and completion rates), and director (fleet-level cost, availability, and reliability trends). Threshold alerts are routed to the appropriate role with a recommended response action and priority level.
Wired vs. Wireless Deployment — Total Cost of Ownership Comparison
The decision to deploy wired or wireless sensor networks is often made on hardware unit cost alone. Hardware is the smallest component of total deployment cost. The table below compares the full cost structure across a 200-node infrastructure monitoring deployment.
The Infrastructure IoT KPI Framework — What to Measure at Each Organisational Level
Sensor data becomes valuable when it connects to a KPI that changes a decision. Without a tiered KPI framework, the same data that should drive operational improvement instead generates dashboards that are reviewed monthly and ignored between reviews. The framework below assigns each metric to the role that acts on it, the decision it influences, and the sensor type that feeds it.
Field Operator
Asset-level alarm count — number of active threshold breaches by asset and severity
Inspection priority queue — ranked by anomaly severity and predicted time to failure
Data quality flag rate — sensors with signal loss, low battery, or calibration drift
Shift Supervisor
Zone anomaly trend — week-over-week change in anomaly frequency by zone and asset class
Alert response time — average time from alert to corrective action, by priority level
Sensor uptime by zone — network health visibility across the deployment area
Maintenance Planner
Predicted vs. actual failure rate — how accurately AI models forecast failures by asset type
Condition-based interval optimisation — assets with no anomalies in 6 months flagged for extended PM cycles
Repeat anomaly rate — assets generating the same alert type more than twice in 90 days
Operations Director
Sensor programme ROI — maintenance cost avoided vs. sensor deployment cost, rolling 12-month basis
Asset availability trend — percentage of monitored assets in healthy state, month-over-month
Unplanned event rate — reactive maintenance events as a percentage of total events, by month
"
We deployed 340 wireless vibration and temperature sensors across a 40-year-old water treatment plant in twelve weeks. The wired alternative would have taken nine months and cost three times as much. Six months after deployment, the AI models identified a bearing degradation pattern on a clarifier drive that manual monthly vibration readings had missed for two consecutive cycles. The repair cost fourteen thousand dollars. A catastrophic failure would have shut down the primary treatment line for an estimated minimum of eight days. The sensor network paid for itself on that single detection. The infrastructure is only as reliable as the data pipeline that monitors it.
— Director of Operations, Metropolitan Water Utility — 22 Years Infrastructure Management
Conclusion
The infrastructure IoT sensor market is growing at over 30 percent annually, yet the majority of deployments underdeliver because the architecture was designed around hardware availability rather than operational outcomes. A successful sensor deployment is not defined by how many nodes are installed or how many data points are collected — it is defined by whether the data changes how decisions are made. Wireless mesh networks with TSCH protocol deliver the reliability that infrastructure monitoring demands. Edge analytics and AI models filter the noise and surface the signals. A tiered KPI framework ensures the right person sees the right metric at the right time.
iFactory's infrastructure monitoring platform integrates the full stack — wireless mesh sensor integration, AI-driven anomaly detection, and tiered KPI dashboards — so operations directors can deploy sensors that drive decisions rather than filling databases. Book a Demo to see how iFactory maps sensor data to operational KPIs, or Talk to an Expert about your infrastructure IoT architecture requirements.
Frequently Asked Questions
Each iFactory gateway supports up to 500 sensor nodes in a TSCH mesh topology, with redundant path diversity and automatic frequency hopping. For larger deployments covering wide-area infrastructure — multiple buildings, distributed water networks, or campus-scale facilities — dual gateways per zone with cellular failover can support thousands of nodes in a segmented mesh architecture. iFactory's platform manages the node-to-gateway mapping automatically, including dynamic re-routing when nodes are added, removed, or when signal conditions change. Talk to an Expert to review your deployment layout and get a gateway architecture recommendation.
iFactory natively supports triaxial accelerometers, temperature probes, pressure transducers, flow meters, current transformers, thermocouples, strain gauges, tiltmeters, pH and conductivity sensors, and partial discharge sensors. The platform's sensor abstraction layer allows any sensor that outputs a standard analogue (4-20mA) or digital (Modbus, IO-Link) signal to be integrated through the iFactory edge gateway. Custom calibration curves and engineering unit conversions are configurable in the platform without firmware changes. Book a Demo to see the full sensor compatibility list and integration workflow.
iFactory gateways maintain local data buffers capable of storing up to 72 hours of continuous sensor data at full sampling frequency. When cloud connectivity is restored, the gateway transmits the buffered data in chronological order, preserving the complete time-series record with accurate timestamps. No data is discarded during connectivity loss. The platform also supports on-premise deployment for facilities with restricted cloud connectivity policies — the full analytics and KPI pipeline runs locally, with an optional synchronisation layer for remote monitoring. Talk to an Expert to discuss your connectivity environment and data architecture requirements.
For standard deployments of up to 200 nodes, sensor installation and network commissioning takes two to four weeks depending on site conditions. Baseline data collection and AI model calibration requires an additional two to four weeks for the anomaly detection models to establish asset-specific thresholds. Condition-based alerts typically begin generating within the first week of baseline data collection, with model accuracy improving over the first 90 days as the feedback loop matures. Tiered KPI dashboards are configured during the commissioning phase and are operational from day one with real-time sensor visibility. Book a Demo to review a sample deployment timeline tailored to your facility size and asset complexity.
Your Sensors Are Collecting Data. iFactory Makes It Operational Intelligence.
From wireless mesh deployment to AI anomaly detection to tiered KPI dashboards — iFactory gives operations directors the full infrastructure IoT stack in a single platform. Deploy once. Decide daily.