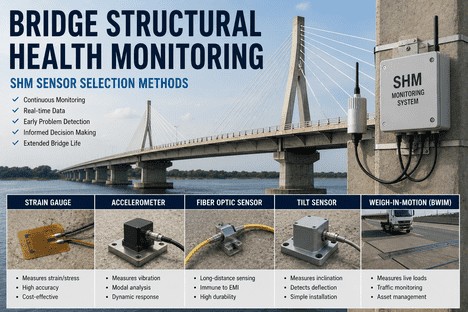
Bridge Structural Health Monitoring SHM Sensor Selection Methods
By Grace on June 18, 2026
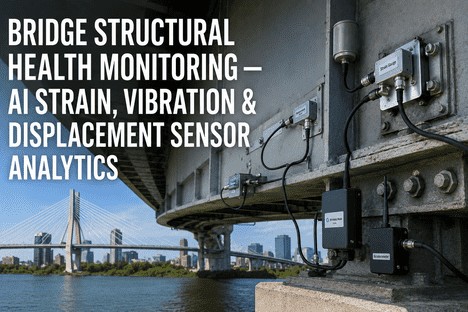
A biennial NBIS inspection tells you the condition of a bridge on the day the inspector stands under it. It does not tell you how the bridge responded to the overload permit vehicle that crossed at 3:47 AM on a Tuesday in February, or whether the pier scour detected after the spring flood has progressed since the last sonar survey, or if the cracked diaphragm connection identified on the element-level report is propagating under every freeze-thaw cycle. Structural health monitoring fills that gap — but only if the right sensor type is matched to the right failure mode, the right measurement frequency, and the right budget. With strain gauges, accelerometers, fiber optic arrays, tiltmeters, vibrating wire piezometers, and distributed acoustic sensing cables all competing for space in the same bridge instrumentation budget, the selection decision determines not just what data you collect — but whether the data tells you anything worth acting on before the next inspection cycle.
Bridge Structural Health Monitoring SHM Sensor Selection Methods
iFactory integrates the full SHM sensor stack — from traditional foil strain gauges to distributed fiber optic arrays — into a single data acquisition and analytics platform purpose-built for bridge owners moving from periodic inspection to continuous monitoring.
Global structural health monitoring market value in 2026, growing at 13.5% CAGR as bridge owners shift from periodic inspection to continuous sensor-based monitoring programmes
60-80%
Of actionable SHM value derived from selecting the correct sensor type and placement — the remaining contribution comes from data acquisition frequency and analytics quality
1:8
Ratio of sensor system cost to avoided maintenance expenditure when SHM data enables condition-based rather than schedule-based intervention on fracture-critical bridge members
40km
Maximum sensing range of a single distributed acoustic sensing interrogator — monitoring an entire bridge corridor from one access point using standard telecom-grade fiber optic cable
Six Sensor Types. Six Measurement Philosophies. One Bridge.
Every bridge monitoring requirement can be met by at least one sensor technology. The skill in SHM system design is understanding which sensor delivers the measurement you need at the spatial density, sampling rate, and lifecycle cost that fits the bridge's risk profile. The six primary sensor types used in bridge SHM today each occupy a different position in the trade-off space between measurement precision, coverage, installation complexity, and long-term durability.
Sensor
SG
Type 1
Foil Strain Gauge
Bonded resistive foil sensors that measure localised surface strain on steel and concrete members. The most mature and widely deployed SHM sensor — reliable, well-characterised, and low-cost per channel. Output in microstrain with sensitivity down to 1-2 microstrain under ideal conditions. Requires careful surface preparation, temperature compensation, and protection from moisture ingress for long-term deployment.
Static + dynamic
1-5 kHz sampling
$50-200/channel
Accuracy
+/- 1-2 ue
Coverage
Point
Sensor
AC
Type 2
Accelerometer
MEMS and piezoelectric accelerometers measure structural vibration, modal response, and seismic excitation. Used for natural frequency tracking, damping ratio estimation, and modal analysis to detect stiffness changes that indicate damage. Tri-axial MEMS accelerometers have become the dominant choice for bridge SHM due to their low cost, wide dynamic range, and ease of integration with wireless data acquisition systems.
Dynamic only
100-1000 Hz
$100-600/unit
Accuracy
+/- 0.01 g
Coverage
Point
Sensor
FB
Type 3
Fiber Bragg Grating
FBG sensors are etched directly into a single-mode optical fiber, creating periodic refractive index variations that reflect a specific wavelength. When the fiber is strained or its temperature changes, the reflected wavelength shifts proportionally. Multiple FBGs at different wavelengths can be multiplexed on a single fiber, enabling distributed point sensing along a bridge girder with a single cable run and a single interrogator port. Immune to electromagnetic interference and corrosion-resistant over decades of deployment.
Static + dynamic
1-1000 Hz
$500-2000/ch
Accuracy
+/- 1 ue
Coverage
Multi-point
Sensor
DA
Type 4
Distributed Acoustic Sensing
DAS uses a standard telecom-grade optical fiber as a continuous sensing element, measuring strain and vibration at every point along the cable at spatial resolutions of 0.5-5 metres over lengths up to 40 km. A single interrogator unit at one end of the fiber converts the backscattered laser light into a continuous strain profile that detects traffic loading, structural vibrations, thermal effects, and acoustic events across the entire bridge length simultaneously. The most cost-effective solution for long-span or multi-structure monitoring corridors.
Dynamic
0.1-10000 Hz
$20-50k/interrogator
Accuracy
+/- 10 ne
Coverage
Continuous
Sensor
TL
Type 5
Tiltmeter and Displacement Sensor
Electrolytic and MEMS tiltmeters measure angular rotation of bridge piers, abutments, and girder ends with sensitivity down to 1-2 arc-seconds. Used for long-term settlement monitoring, bearing degradation detection, and pier scour assessment. Vibrating wire displacement transducers and potentiometric linear position sensors complement tiltmeters for direct measurement of joint opening, crack propagation, and bearing movement over time.
Static
1-100 Hz
$400-1500/unit
Accuracy
+/- 1 arc-sec
Coverage
Point
Sensor
BW
Type 6
Bridge Weigh-in-Motion
BWIM uses instrumented bridge response — typically strain from the underside of primary girders — to calculate axle weights and gross vehicle weights of crossing traffic. The bridge itself becomes the weighing scale. Algorithms based on influence lines convert measured strain into axle loads, providing both traffic data for load rating verification and structural response data for fatigue assessment. Increasingly deployed as a dual-purpose system that produces both traffic enforcement data and SHM condition indicators.
Dynamic
100-500 Hz
$15-40k/system
Accuracy
+/- 5-10% GVW
Coverage
System-span
Matching Sensor to Failure Mode: The Selection Matrix
The most common error in SHM system design is selecting a sensor before defining the failure mode it is meant to detect. An accelerometer network that measures natural frequency shifts at 200 Hz sampling rate is the right choice for detecting global stiffness loss in a steel truss — but it will not detect a 0.3 mm crack propagating at a welded diaphragm connection, which requires a strain gauge or FBG sensor at that specific location sampling at a sufficient rate to capture the strain transient when the crack opens under traffic load. The selection matrix below maps each sensor type to the failure modes it is best suited to detect, ensuring the monitoring strategy matches the structural risk.
Sensor-to-Failure-Mode Matching Matrix
Steel Fatigue Crack Initiation
Concrete Deck Delamination
Pier Scour & Settlement
Global Stiffness Loss
Strain Gauge
Primary
Not suitable
Not suitable
Not suitable
Accelerometer
Not suitable
Not suitable
Not suitable
Primary
FBG Fiber Optic
Primary
Not suitable
Not suitable
Primary
DAS
Emerging
Not suitable
Not suitable
Primary
Tiltmeter
Not suitable
Not suitable
Primary
Not suitable
BWIM
Not suitable
Not suitable
Not suitable
Secondary
Data Acquisition and System Architecture: From Sensor to Decision
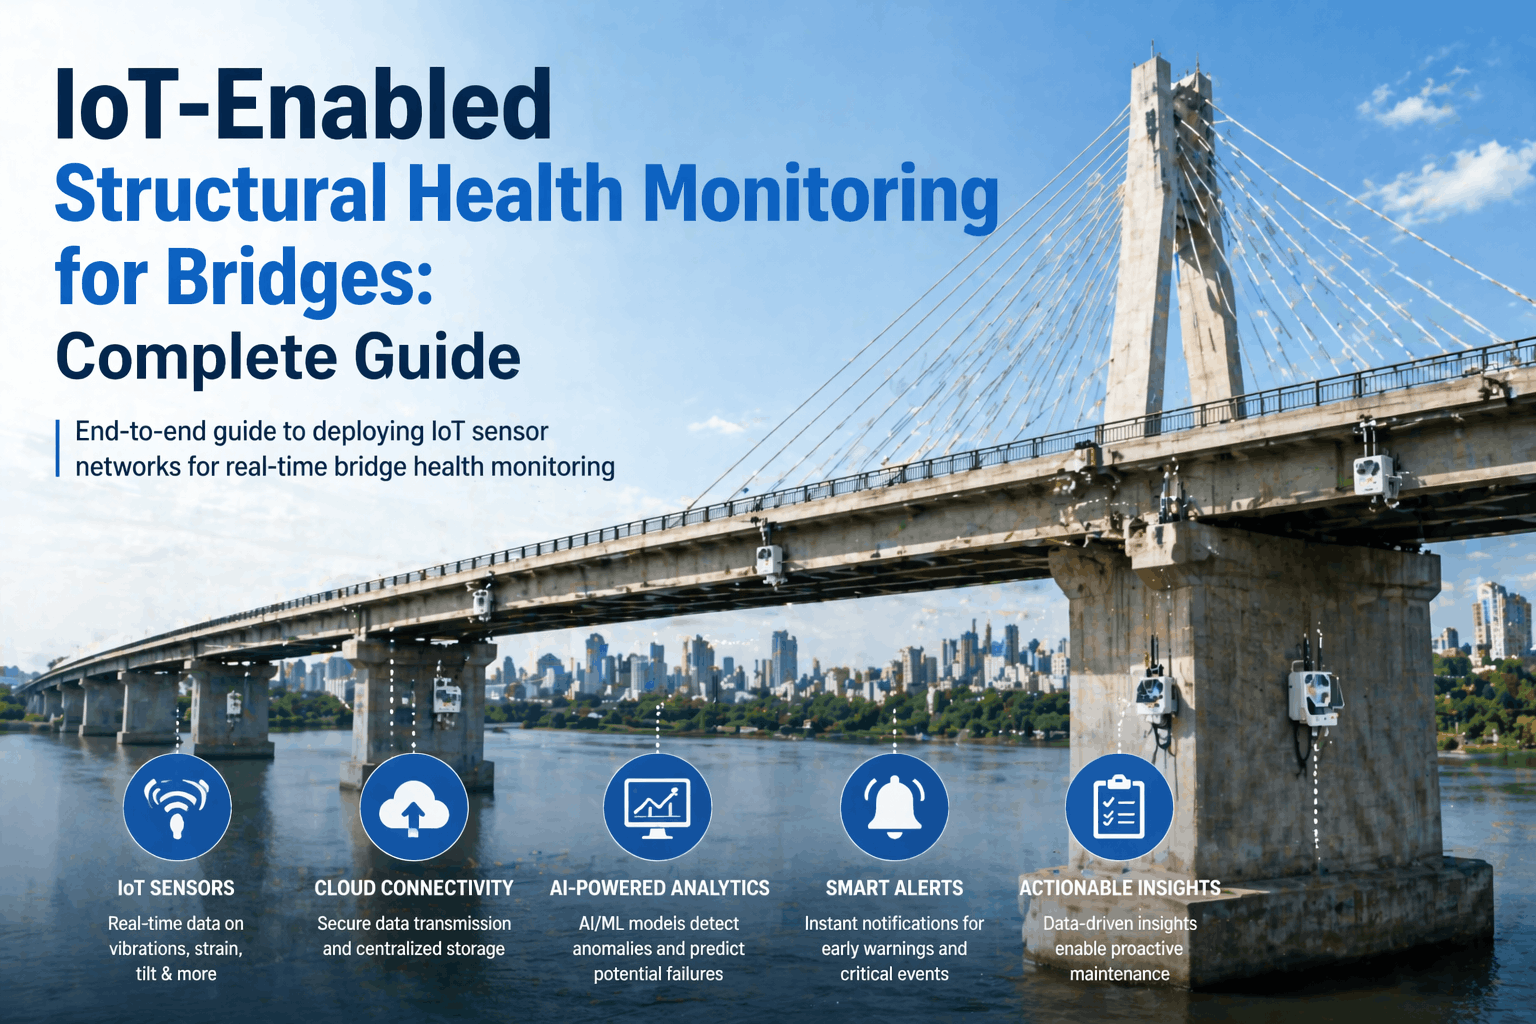
The sensor is only the first link in the SHM data chain. Between the strain gauge bonded to the girder web and the condition alert on the bridge engineer's dashboard lies a data acquisition architecture that must handle continuous streaming data from dozens or hundreds of channels, synchronise measurements across sensor types with different sampling rates, manage power and communication in a remote environment with no permanent infrastructure, and deliver processed data that supports engineering decisions — not just raw time-series that require specialist interpretation.
The SHM Data Chain: From Physical Measurement to Engineering Action
Layer 1
Sensor
Strain, vibration, tilt, temperature, acoustic — analog or digital output at the measurement point
→
Layer 2
DAQ
Data logger or interrogator with channel multiplexing, analog-to-digital conversion, timestamp synchronisation, and local buffering
→
Layer 3
Edge Compute
On-site processing — filtering, feature extraction, anomaly detection, data compression for transmission over cellular or satellite link
Condition rating update, maintenance work order, inspection interval adjustment, or load posting revision triggered by data-driven threshold breach
Cost-Per-Bridge: Building a Sensor Budget That Delivers Real SHM Value
SHM system cost is not driven primarily by sensor hardware. It is driven by the installation labour, the data acquisition infrastructure, the communication link, and the ongoing data management and analytics. A common mistake is to budget for sensors and overlook the total system cost — which typically allocates 20-30% to sensors, 30-40% to installation and commissioning, 15-25% to DAQ and communication hardware, and 15-25% to data management and analytics over the first five years of operation. Understanding the full cost structure before selecting the sensor technology prevents the most common outcome of bridge SHM deployments: a sensor network that produces data but no actionable information because the analytics budget was exhausted by the hardware procurement.
Small Bridge
Single-span, 30-60 m
$18-35k
6-12 strain gauges, 2 accelerometers, temperature, 1 DAQ node, cellular telemetry, 5-year data management. Suitable for fatigue-prone details on high-traffic routes.
Recommended: Strain gauge + accelerometer
Medium Bridge
Multi-span, 60-300 m
$45-95k
20-40 FBG sensors on 2-3 fiber runs, 6-8 accelerometers, tiltmeters at piers, 2-3 DAQ nodes, cellular with local edge processing, 5-year data analytics.
Recommended: FBG + accelerometer + tiltmeter
Large or Critical Bridge
Long-span, 300m+ or FCM
$150-400k
DAS interrogator with full-length fiber sensing, FBG array on critical details, accelerometer network for modal analysis, BWIM system, tiltmeters, weather station, edge AI, full cloud platform.
Recommended: Full multi-sensor stack + DAS
Modal Analysis and Vibration-Based SHM: Detecting Damage You Cannot See
One of the most powerful SHM techniques for steel and pre-stressed concrete bridges is modal analysis — the measurement of the bridge's natural frequencies, mode shapes, and damping ratios from ambient vibration data. When a bridge suffers a loss of stiffness — from a cracked girder, a corroded connection, or a failed bearing — its modal properties shift in ways that can be detected by a well-placed accelerometer network even when no visible damage is present on the surface. The challenge is that modal properties are also affected by environmental factors — temperature, humidity, and boundary condition changes — that can mask damage-induced shifts unless the monitoring system has sufficient historical baseline data and temperature compensation models.
iFactory's SHM platform integrates continuous modal analysis with temperature-compensated baseline models, enabling automatic detection of stiffness changes that exceed the normal environmental variation envelope. When a natural frequency shift is detected that cannot be explained by temperature or traffic loading patterns, the platform generates a structural alert with the estimated location and severity of the stiffness change, directing the bridge engineer to the specific span or element that requires closer inspection.
The first sign of trouble on a post-tensioned concrete box-girder bridge we monitor was not a crack, a spall, or a leak. It was a 3.2% shift in the second bending mode frequency, detected by an accelerometer on the mid-span diaphragm. The shift correlated with a tendon anchorage that had begun to lose prestress force — invisible from the deck, undetectable by visual inspection, and caught by the SHM system five months before the annual inspection would have required a qualified inspector to be within arm's reach of the anchorage zone.
Structural health monitoring is not a technology problem. The sensors exist, the data acquisition systems are mature, and the analytics capability is advancing faster than most bridge programmes can absorb. The challenge is selection — choosing the right sensor type, at the right spatial density, with the right sampling strategy, and within the right total-cost envelope for each bridge in an inventory that may range from a 20-metre single-span rural crossing to a 1.5-kilometre cable-stayed urban river crossing. The sensor that is optimal for one bridge is wrong for another, and the monitoring strategy that works for steel fatigue detection is ill-suited for concrete deck delamination tracking or pier scour monitoring.
The bridge owners who are extracting maximum value from SHM are not the ones who install the most sensors. They are the ones who match their sensor selection to their failure mode risk, who invest in the data acquisition and analytics infrastructure to turn raw measurements into engineering decisions, and who integrate the SHM data stream into their existing bridge management workflow rather than treating it as a parallel system. iFactory's platform is designed for that integration — supporting the full sensor stack from foil strain gauges to distributed fiber optic arrays, managing the data acquisition and edge processing layer, and delivering actionable condition information to the bridge engineer's existing reporting workflow. Book a Demo to see the iFactory SHM platform configured for your bridge inventory, or talk to an expert about building your sensor selection strategy.
Frequently Asked Questions
There is no single number — the optimal sensor count depends on the bridge type, span configuration, failure modes of concern, and the desired detection sensitivity. For a simply supported steel multi-girder bridge where the primary concern is fatigue cracking at welded diaphragm connections, 6-12 strain gauges positioned at known fatigue-prone details, paired with 2-4 accelerometers for global modal tracking, can provide effective coverage. For a post-tensioned concrete box girder where the concern is tendon degradation and prestress loss, a distributed fiber optic array covering 50-100 measurement points along the span length may be necessary to capture strain redistribution patterns. The iFactory SHM design methodology uses a risk-based optimisation approach — starting with the failure modes that carry the highest consequence and working backwards to the minimum sensor configuration that provides actionable detection confidence for those modes. Talk to an expert about a sensor configuration assessment for your bridge inventory.
Sensor lifespan varies significantly by type and deployment environment. Foil strain gauges installed with proper surface preparation, waterproofing, and environmental protection typically last 5-10 years before signal degradation from moisture ingress or adhesive creep becomes significant. MEMS accelerometers and tiltmeters have demonstrated 10-15 year lifespans in bridge environments with no moving parts to wear, though their cables and connectors often fail before the sensor element. Fiber optic sensors — FBG and DAS — have the longest service life, with the passive fiber itself rated for 20-30 years in outdoor environments. The interrogator electronics for fiber optic systems typically require maintenance every 5-8 years. The most common maintenance item across all sensor types is not the sensor — it is the cable, connector, and data acquisition interface, where environmental exposure causes the highest failure rate. iFactory's platform includes automated sensor health diagnostics that detect signal degradation, cabling faults, and data quality issues before they result in data loss, scheduling maintenance interventions based on measured performance rather than calendar intervals. Book a Demo to see the sensor health monitoring module.
Not entirely, and current FHWA guidance does not permit full replacement of hands-on inspection for fracture-critical members with SHM alone. However, a growing number of state DOTs are using SHM to extend inspection intervals on fracture-critical bridges — moving from 12-month to 24-month hands-on inspection cycles when continuous monitoring data demonstrates that the structure is within expected performance parameters. The SHM system provides the evidence that no unexpected stiffness change, load redistribution, or abnormal vibration has occurred since the last hands-on inspection, giving the bridge engineer the data needed to justify the extended interval under a risk-based inspection programme. This hybrid approach — continuous monitoring with less frequent but still regular hands-on verification — is widely considered the most cost-effective strategy for managing fracture-critical bridge inventories. Talk to an expert about developing a risk-based inspection interval programme supported by SHM data.
The iFactory SHM platform outputs condition data in formats compatible with Pontis, BrM, and proprietary agency BMS systems. Element-level condition ratings derived from sensor data — for example, a strain-based fatigue damage accumulation index converted to a condition state 2 rating for the affected element — are exported as structured records that map to the NBIS element-level inspection framework. Sensor-detected anomalies that exceed threshold values generate automated condition report entries with the date, duration, and severity of the event, providing the bridge engineer with a continuous audit trail between biennial inspections. The platform also supports automated work order generation through REST API or email-to-ticket integration with maintenance management systems, so an SHM-detected section loss alert can flow directly into the repair queue without manual data transcription. Book a Demo to see the BMS integration workflow for your agency's system.
Sampling rate requirements vary fundamentally by measurement type. Static monitoring — long-term strain, tilt, displacement, and temperature — typically requires sampling rates of 0.1-1 Hz, as the physical processes being measured (creep, settlement, thermal expansion) change over minutes to months. Dynamic monitoring — traffic-induced strain, vibration, modal response — requires sampling rates of 50-500 Hz for steel bridges (to capture the 5-20 Hz natural frequencies typical of steel superstructures) and 20-100 Hz for concrete bridges (where natural frequencies are typically 1-10 Hz due to higher mass and stiffness). Impact and acoustic emission monitoring for fatigue crack detection requires the highest sampling rates, typically 1-20 kHz, to capture the characteristic stress wave released when a crack propagates. The iFactory DAQ platform supports configurable sampling rates per channel, allowing a single system to mix high-rate dynamic channels on fatigue-prone details with low-rate static channels on pier settlement tiltmeters, optimising data volume and power consumption. Talk to an expert about configuring the sampling strategy for your specific bridge types and defect modes.
Your Bridge Data Is Telling You Something Between Inspections. iFactory's SHM Platform Makes Sure You Hear It.
From foil strain gauges to distributed fiber optic DAS arrays — iFactory integrates every SHM sensor type into a single platform that turns raw bridge data into engineer-ready condition intelligence, continuously, across every structure in your inventory.