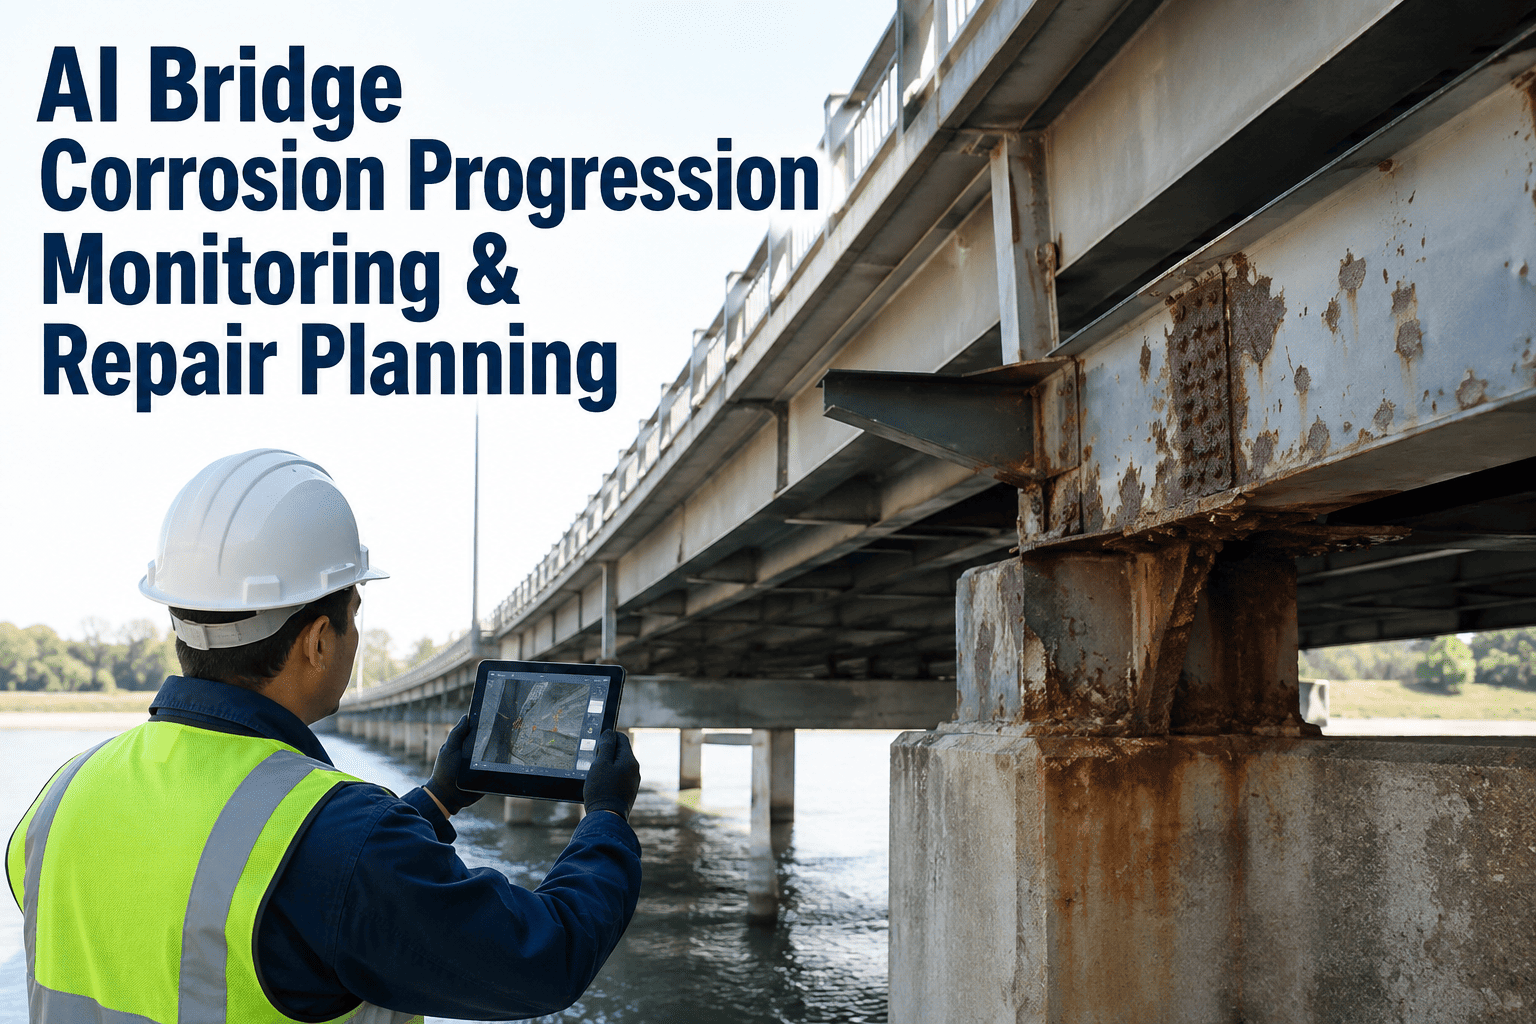
Steel bridges lose section thickness at a rate most inspection cycles are never fast enough to catch. A routine visual inspection every one or two years can spot rust staining on a girder, but it cannot tell an engineer whether that staining sits on two percent section loss or fifteen, or how quickly the corrosion cell underneath is spreading toward a load-bearing flange. Owners are left comparing photographs taken by different inspectors, in different lighting, from different angles, and trying to guess whether last year's patch of rust has actually gotten worse. Continuous condition data changes that equation entirely, turning a guess into a measurable trend line that repair budgets can actually be built around. iFactory pairs sensor-based corrosion monitoring with AI vision analysis to track how corrosion is actually progressing on your structure.
Bridge Infrastructure · Corrosion Analytics
Measure Bridge Corrosion Progression Before It Becomes a Load Rating Problem
Coatings fail, weathering steel patinas unevenly, and rebar corrodes from the inside out long before it shows on the surface. iFactory combines corrosion sensors, AI vision inspection, and historical inspection records into a single progression score for every span, so repair dollars go to the members that actually need them first instead of the ones that simply look the worst in a photograph.
Continuous
Condition tracking between inspection cycles
Per-Member
Corrosion scoring down to individual girders and gussets
Ranked
Repair priority list generated automatically
Why Corrosion Gets Missed
The Gap Between Inspection Cycles Is Where Section Loss Happens
01
Corrosion Doesn't Wait for the Inspection Calendar
A bridge inspected on a two-year cycle can develop significant section loss in a chloride-exposed splash zone long before the next scheduled visit, and nobody knows until the tape measure comes out during the next site visit, by which point the repair scope and cost have both grown considerably.
02
Photographs Don't Measure Rate
Two photos of the same rust patch taken a year apart can look almost identical to the eye while the underlying corrosion rate has actually accelerated well past the point of simple maintenance, and there is no easy way to prove that acceleration without a documented numeric trend.
03
Hidden Corrosion Stays Hidden
Corrosion inside gusset plate connections, under deck joints, or behind bearing seats often isn't visible at all during a walk-through inspection until section loss is already structurally significant, since these areas typically require rope access or specialized equipment to inspect closely.
04
Repair Budgets Get Spread Too Thin
Without a way to rank which members are corroding fastest, maintenance dollars often go toward the most visible rust rather than the connection that is actually closest to a load rating reduction, leaving the structure's true weak point unaddressed for another cycle.
The Progression Model
Four Stages iFactory Tracks From First Oxidation to Critical Section Loss
Stage 1
Surface Oxidation
Coating breakdown or early patina formation is visible but has not yet penetrated base metal; the member is flagged for watch-list tracking and re-imaged on the next inspection or drone pass to confirm whether it is stable.
Stage 2
Active Pitting
Localized pitting begins consuming base metal at a measurable rate; half-cell potential and thickness sensors start recording a defined trend rather than a single reading, and the member moves onto the active monitoring list.
Stage 3
Measurable Section Loss
Section loss crosses a defined percentage of original thickness on a load-bearing member, triggering an automatic engineering review and an entry near the top of the repair priority list for the next funding cycle.
Stage 4
Critical Loss
Section loss approaches the threshold used in load rating calculations, and the platform escalates the finding immediately to the responsible engineer rather than waiting for the next scheduled inspection report to surface it.
Choosing a Monitoring Method
How Corrosion Detection Methods Compare
| Method | What It Measures | Best Fit | Limitation |
| Visual Inspection |
Surface rust, coating condition, visible damage |
Routine biennial inspection baseline |
Cannot quantify rate or hidden corrosion |
| Half-Cell Potential |
Corrosion probability in reinforced concrete |
Deck and substructure rebar assessment |
Concrete elements only, not steel members |
| Ultrasonic Thickness |
Direct section loss at a measured point |
Confirming section loss on known hot spots |
Point measurement, not continuous coverage |
| AI Vision Inspection |
Corrosion extent, severity grade, area change over time |
Continuous tracking across an entire span |
Needs a baseline image set to compare against |
Who Relies On This
Corrosion Progression Tracking Across Different Types of Bridge Owners
State and County DOTs
Large bridge inventories spread across counties need a single ranked view of which structures are corroding fastest, so limited inspection crews and repair contracts get routed to the highest-consequence members first instead of whichever bridge is next on a rotating schedule.
Toll Authorities
Toll structures carry high daily traffic volumes and steep detour costs if a lane has to close, which makes early detection of active pitting on primary girders worth far more than the cost of the sensors that catch it months ahead of a visual finding.
Rail and Transit Agencies
Rail bridges often carry stricter deflection and load rating tolerances than highway structures, so a corrosion trend that would be a maintenance note on a road bridge can require an immediate engineering review when it appears on a rail crossing.
Municipal Bridge Departments
Smaller departments rarely have a dedicated structural engineer reviewing every inspection report line by line, so an automated escalation rule that flags Stage 3 findings on its own closes a gap that would otherwise depend on someone noticing a subtle change in a photo.
What's Included
The Four Capabilities Behind the Progression Score
Sensor and Inspection Data Integration
Half-cell potential, ultrasonic thickness, and any existing corrosion monitoring hardware already installed on a structure feed directly into the same per-member record used for scoring, so owners aren't asked to rip out working equipment to get a unified view.
AI Vision Baseline Comparison
Each new set of inspection or drone photographs is compared against the documented baseline image for that member, measuring change in corroded area and severity grade rather than relying on an inspector's memory of what it looked like last time.
Engineering Escalation Rules
Threshold rules tied to section loss percentage and structural role trigger an automatic review request the moment a member crosses into Stage 3 or Stage 4, instead of waiting for the finding to surface in a quarterly summary report.
Repair Budget Export
The ranked repair priority list exports into the format capital planning teams already use for multi-year budget requests, with the underlying progression data attached so funding justifications don't have to be rebuilt from scratch each cycle.
See Your Own Structures Scored
Bring Your Last Two Inspection Reports and We'll Show You the Trend
Most owners already have the historical inspection data needed to build a first progression baseline. We'll walk through what a corrosion trend line looks like for your actual bridge inventory and where a pilot program would make the most sense.
How It Works
From Raw Readings to a Ranked Repair List
1
Capture Baseline Condition
Historical inspection reports, prior photographs, and any existing sensor readings are digitized into a per-member baseline for every span in the structure.
2
Layer In Continuous Readings
Corrosion sensors and periodic AI vision passes add new data points to each member's record, building a trend line instead of a single snapshot.
3
Calculate Progression Rate
The platform compares successive readings to estimate how fast section loss is advancing on each member, not just how much has already occurred.
4
Score Against Structural Criticality
Progression rate is weighted against the member's role in the load path, so a fast-corroding secondary bracket doesn't outrank a slower-moving primary girder.
5
Publish the Repair Priority List
Engineers get a ranked list of members by urgency, with the underlying trend data attached, instead of a flat inspection report to interpret manually.
A Composite Scenario
A District With Forty Steel Bridges and One Inspection Crew
Before
Forty structures shared one biennial inspection cycle, and rust patches noted in one cycle's report were only compared against the previous cycle's photos by memory. A gusset plate connection on one truss bridge had been flagged as "monitor" for three consecutive cycles with no way to tell if it was stable or accelerating, and the inspection team had no objective basis for moving it up the repair queue ahead of other flagged findings across the inventory.
After
Sensor readings and AI vision passes between inspections showed the gusset plate connection had moved from Stage 2 to Stage 3 in under a year, well outside the pace suggested by the biennial photo comparison. The repair was scheduled before the next scheduled inspection would even have caught it, and the remaining thirty-nine structures across the district were ranked so the crew's limited field time went to the fastest-moving members first instead of the structures simply next on the calendar. The district's capital planning team also reported that funding requests tied to a documented progression rate moved through review noticeably faster than the general condition narratives they had submitted in prior years.
What Changes on the Ground
The Practical Difference a Progression Score Makes
Repair Contracts Get Scoped Earlier
Instead of waiting for a member to reach a visually obvious state before scoping a repair contract, capital planning teams can see a fast-moving trend line months in advance and get the procurement process started before the finding becomes urgent enough to force an emergency contract at a premium rate.
Inspection Crews Focus Where It Matters
A ranked list of the fastest-moving members across an entire inventory means the next physical inspection can be planned around confirming a handful of specific findings rather than a generic walk-through of every accessible surface on a structure that hasn't changed much since the last visit.
Load Rating Reviews Get Triggered on Time
When section loss on a load-bearing member approaches the threshold used in rating calculations, an automatic escalation means the structural review happens as soon as the data supports it, rather than at whatever point the finding happens to be noticed during the next scheduled report cycle.
Budget Requests Come With Evidence Attached
A capital funding request backed by a documented progression rate and a clear engineering rationale moves through approval faster than a request supported only by a general statement that a structure "needs attention," because the underlying trend data answers the follow-up questions before they're asked.
Common Missteps
Where Corrosion Monitoring Programs Go Wrong
Treating Every Rust Patch the Same
Surface staining on a non-critical secondary member gets the same attention as active pitting on a main girder, diluting inspector time away from where it matters most and leaving genuinely urgent findings buried in a long list of low-priority notes.
No Baseline to Compare Against
Without a documented starting condition, every new reading is just another isolated data point instead of evidence of a trend, making rate impossible to establish and leaving engineers to guess at how urgent a given finding actually is.
Ignoring Hidden Connection Points
Bearing seats, gusset plates, and deck joint areas often corrode faster than open web members but get inspected less often because they're harder to access, which means the fastest-progressing corrosion is frequently the least documented.
Waiting for the Next Scheduled Report
A finding that would justify an early intervention sits unactioned for months simply because it surfaced outside the normal reporting cycle, turning what could have been a routine repair into an urgent, higher-cost one.
Before You Start
Preparing to Track Corrosion Progression Across a Bridge Inventory
Gather the last two to three inspection reports for each structure, including any existing photographs, thickness readings, and half-cell potential data where available
Identify the members already flagged as "monitor" or "watch" in recent reports so they can be prioritized for baseline sensor placement ahead of a full inventory rollout
List known hard-to-access connection points such as gusset plates, bearing seats, and deck joints so they can be scheduled for targeted inspection and sensor coverage
Confirm which structures carry the highest traffic loads or detour costs so the criticality weighting used in the repair priority list reflects real operational consequences
Common Questions
Bridge Corrosion Monitoring — FAQ
Do we need to install sensors on every member of every bridge?
No, most programs start with the members already flagged as areas of concern in recent inspection reports, then expand sensor coverage to other critical connections over time. A full-inventory rollout typically follows a pilot on the structures with the fastest known deterioration or the highest consequence of failure. This staged approach keeps the upfront cost manageable while still catching the fastest-moving corrosion first.
Our team can help scope a realistic starting point for your inventory.
How is a corrosion progression rate actually calculated?
The platform compares successive readings from sensors and AI vision passes against the documented baseline condition for each member, then expresses the change as a rate of section loss or coating degradation over time. This turns what used to be a subjective comparison between two photographs into a measurable number that can be tracked, charted, and compared across the entire structure. Engineers can see not just how much corrosion has occurred but how quickly it's moving.
Can this replace our scheduled physical inspections?
No, continuous monitoring is designed to work alongside required inspection cycles, not replace them. It fills the gap between scheduled visits by flagging members that are changing quickly, so the next physical inspection can be planned around what actually needs the closest look rather than a generic walk-through of the entire structure. Regulatory inspection requirements remain unchanged.
How does the platform decide which repairs get top priority?
Repair priority combines the measured progression rate of a member with its role in the structure's load path, so a fast-corroding but non-critical bracket doesn't outrank a slower-moving primary girder that matters more to the load rating. The result is a ranked list rather than a flat inventory of findings, which makes it much easier to allocate a limited repair budget where it has the most structural benefit.
Book a demo to see how the scoring applies to your own bridge list.
Does this work for weathering steel bridges as well as painted steel?
Yes, though the baseline looks different for each. Weathering steel is expected to develop a stable protective patina over time, so the platform is tuned to distinguish normal patina formation from the uneven, active corrosion that signals a coating or drainage problem. Painted steel bridges are tracked against coating breakdown and any base metal exposure that follows once the coating fails.
Stop Guessing Which Rust Patch Is Getting Worse
Turn Bridge Inspection Data Into a Measurable Corrosion Trend
iFactory combines sensor data, AI vision inspection, and historical reports into a single progression score per member, so repair budgets go to the connections closest to a real structural consequence.