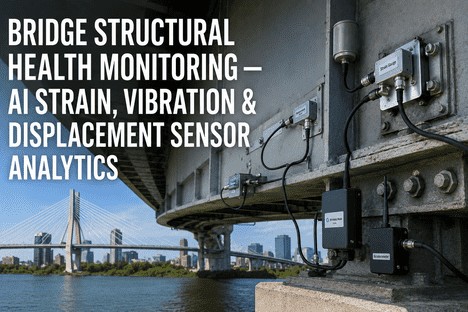
Bridge Structural Health Monitoring — AI Strain, Vibration & Displacement Sensor Analytics
By Grace on June 19, 2026
A bridge engineer's relationship with structural health monitoring typically begins the same way: a routine inspection reveals a crack that has been growing for months, a bearing that seized quietly and gradually shifted load paths across the superstructure, or a foundation settlement that went unnoticed until the approach slab differential became visible to the travelling public. The sensor data was there all along — strain gauges logging every fatigue cycle, accelerometers capturing every modal frequency shift, displacement sensors recording every thermal cycle expansion. What was missing was the analytical layer that connects sensor output to structural risk before the damage becomes visible. This article covers the three sensor domains that define modern bridge SHM — strain, vibration, and displacement — and how AI analytics transforms each from a data stream into a 2-to-6-week early warning system for fatigue cracking, bearing deterioration, and foundation settlement.
Bridge Engineers Who Detect Fatigue Cracks, Bearing Failure, and Settlement 2-6 Weeks Before Visual Inspection Confirm Them Have One Advantage: Their Analytics Layer Understands What the Sensors Are Saying.
iFactory's AI-driven SHM platform processes strain, vibration, and displacement data through ML models trained to detect the precursor patterns of structural deterioration — with automated alerting, digital twin integration, and audit-ready condition records.
Reduction in emergency bridge repairs achievable with AI-driven SHM — shifting from reactive maintenance triggered by visible defects to predictive intervention based on sensor-detected precursor patterns
94%+
Accuracy of CNN-based anomaly detection in classifying structural damage patterns from vibration and strain signal data — validated on full-scale bridge deck field tests
2-6 Weeks
Early warning window that AI-SHM provides for fatigue crack growth, bearing stiffness loss, and foundation settlement — before visual inspection or physical symptoms appear
$3.2M
Net present value documented from smart bridge SHM deployment across a 4-bridge fleet — achieved through deferred capital expenditure and condition-based maintenance scheduling
The Core Problem: Bridge Inspection Cycles Create a Structural Blind Window
Biennial inspection programmes, mandated by federal and state transportation regulations, are designed to identify structural deficiencies at discrete points in time. The limitation is structural: a fatigue crack that initiates the week after an inspection has up to 104 weeks of propagation time before the next inspection. During that window, the crack grows under traffic loading, redistributes stress to adjacent members, and reduces the remaining fatigue life of the detail. The bridge is structurally different from the last inspection record, and no inspector will see the change until the next scheduled visit.
SHM sensors close this window by providing continuous data between inspections. But raw sensor data — microstrain readings at 50 Hz, acceleration time histories, displacement measurements — does not constitute a structural assessment. It constitutes a dataset. The bridge engineer's problem is not sensor availability; it is the analytical gap between the data stream and the engineering decision. AI analytics addresses this gap by learning the signature patterns that precede each defect category and alerting the engineer when those patterns appear — converting continuous monitoring into actionable early warning.
Three Sensor Domains · Three Defect Categories · One AI Analytics Layer
01
Strain Gauges — Fatigue Crack Precursor Detection
Strain gauges measure localised deformation at fatigue-sensitive details — web-gap regions, cope holes, stiffener-to-flange welds, and cutout holes in cross girders. Each fatigue cycle accumulates as incremental damage, and the strain range per cycle determines the crack growth rate. Traditional analysis compares peak strain against allowable limits. AI analysis tracks the evolution of the strain distribution shape, the frequency content of strain events, and the correlation between strain at adjacent gauge locations. When the crack growth index begins to trend upward — even within the allowable strain range — the AI model identifies the precursor pattern and generates a fatigue alert. Studies on steel bridge fatigue monitoring demonstrate that wireless large-area strain sensors combined with wavelet-based crack growth indices can detect propagation trends that point-based sensors miss.
AI detects: Strain distribution shift, accumulated cycle anomaly, crack growth index trend before visible crack.
02
Accelerometers — Bearing Deterioration and Modal Shift Detection
Triaxial accelerometers mounted on the deck, at pier tops, and on girder ends capture the bridge's dynamic response to traffic, wind, and thermal loading. Every structure has a modal signature — natural frequencies, mode shapes, and damping ratios — that defines its healthy baseline. Bearing deterioration changes the boundary conditions of the superstructure: a seized bearing restricts longitudinal movement, an unseated bearing introduces a non-linear contact surface, and a deteriorated bearing changes the effective stiffness at the support. These changes appear as measurable modal parameter shifts before they produce visible symptoms such as cracked masonry or spalled concrete at the bearing seat. Wireless MEMS accelerometer networks deployed on highway bridges have demonstrated the ability to identify bearing stiffness degradation through frequency domain analysis, with machine learning models trained to classify bearing health state from modal parameters alone. The typical detection window is 3 to 6 weeks before visual bearing deterioration signs appear.
AI detects: Modal frequency drift, damping change, bearing stiffness degradation from boundary condition shifts.
03
Displacement Sensors — Foundation Settlement and Superstructure Deformation Tracking
Displacement sensors — including laser displacement sensors, linear potentiometers, and fibre-optic strain-based displacement transducers — measure absolute and relative movement at expansion joints, bearing interfaces, and pier-to-deck connections. Foundation settlement manifests as a long-term trend in vertical displacement that accumulates at rates measured in millimetres per year. The challenge is distinguishing settlement from thermal expansion and traffic-induced elastic deflection — both of which produce displacement signals an order of magnitude larger than the settlement trend. ML models trained on temperature-displacement correlation patterns can separate the thermal component from the permanent deformation component, enabling detection of settlement rates as low as 1-2 mm per year within a 4-8 week monitoring window. For bridges on spread footings in scour-prone environments, this early detection capability directly informs scour countermeasure deployment before foundation capacity is compromised.
AI detects: Thermal-corrected displacement trend, abnormal expansion joint movement, pier settlement rate below traditional detection threshold.
How AI Analytics Bridges the Gap Between Sensor Data and Engineering Action
A bridge instrumented with strain gauges, accelerometers, and displacement sensors generates approximately 15 to 50 GB of raw time-series data per year per sensor node. No engineering team has the bandwidth to review this volume of data cycle by cycle. AI analytics addresses this through a four-stage processing pipeline that converts raw sensor output into prioritised engineering alerts.
Stage 01
Data Ingestion and Quality Control
Raw time-series data from all sensor types is ingested, time-synchronised, and passed through automated quality control filters — spike removal, drift correction, temperature compensation, and missing-data imputation using GAN-based reconstruction. The output is a clean, labelled dataset aligned to a common timestamp, ready for feature extraction.
Stage 02
Feature Extraction and Baseline Modelling
For each sensor channel, the AI pipeline extracts domain-specific features — strain range histograms, peak-over-threshold counts, cumulative damage indices, modal frequencies, damping ratios, temperature-displacement correlation coefficients, and cross-correlation between sensor pairs. These features define the healthy baseline model of the structure. The baseline is continuously updated through a sliding window that accounts for seasonal temperature variation, long-term aging trends, and operational changes.
Stage 03
Anomaly Detection and Classification
When new sensor data deviates from the baseline model beyond a configurable statistical threshold, the anomaly detection engine flags the event and classifies it by type — fatigue crack precursor, bearing stiffness change, foundation settlement trend, or environmental event (thermal transient, seismic event, impact load). CNN-based classifiers operating on signal images achieve over 94% accuracy in distinguishing structural anomalies from environmental noise, reducing false alerts to a level that maintains operator confidence.
Stage 04
Alert Triage and Engineering Notification
Classified anomalies are assigned a severity score based on the rate of feature deviation, the criticality of the affected structural member, and the confidence level of the classification. Bridge engineers receive prioritised alerts through dashboard, email, or mobile notification — with the sensor data trace, the feature trend chart, and the recommended inspection scope included in the alert. Alerts below the configurable severity threshold are logged for trend analysis without generating notification noise.
Fatigue Crack Detection · Bearing Deterioration · Foundation Settlement · Digital Twin Integration
The Gap Between Sensor Data and Structural Assessment Is Not a Data Problem — It Is an Analytics Problem. AI Closes It.
iFactory builds the AI analytics layer that converts strain, vibration, and displacement data into engineering-intelligible condition assessments — with sensor-agnostic integration, ML-based anomaly classification, and automated alert escalation designed for bridge engineer workflows.
What the AI-SHM Dashboard Shows the Bridge Engineer
The bridge engineer's interface is organised around the questions that matter for structural asset management: what is the current condition of each instrumented bridge, which sensor domains are showing anomalous trends, and what is the recommended next action. The dashboard consolidates data from strain, vibration, and displacement domains into a single-pane-of-glass view.
Sensor View 01
Live Condition Map by Bridge and Sensor Domain
A geospatial view of all instrumented bridges with colour-coded condition indicators per sensor domain — green for normal, amber for trending, red for alert. Selecting a bridge opens the detailed dashboard showing strain gauge, accelerometer, and displacement sensor status. The engineer sees the fleet condition at a glance without navigating bridge by bridge.
Engineer action: Select amber or red bridges for detailed sensor review. Green bridges require no action.
Sensor View 02
Strain Fatigue Trend — Cumulative Damage and Crack Growth Index
For each strain gauge location, the dashboard displays the cumulative fatigue damage curve computed from the strain-range histogram using the applicable S-N curve. The crack growth index (CGI) trend is overlaid, showing whether the rate of damage accumulation is stable, accelerating, or decelerating. When CGI begins to trend upward at a rate exceeding the configurable threshold — even while remaining within the allowable cumulative damage envelope — the dashboard flags the detail for targeted inspection.
Engineer action: Rising CGI trend triggers inspection scope increase at the flagged detail before visible cracking.
Sensor View 03
Modal Parameter Trend — Frequency and Damping Shift History
Natural frequency and damping ratio for the first three modes are plotted continuously, with the healthy baseline and the alert threshold bands. A downward frequency shift combined with an upward damping shift is the characteristic signature of bearing stiffness degradation. The dashboard annotates each shift event with the ambient temperature and traffic loading context, enabling the engineer to distinguish between reversible thermal effects and permanent structural changes.
Engineer action: Frequency-damping shift pattern triggers bearing inspection protocol within the detection window.
Raw displacement data is decomposed into thermal expansion, traffic-induced elastic deflection, and long-term permanent deformation components using an ML model trained on temperature-displacement correlation. The engineer sees the corrected settlement trend with the estimated rate in mm per year and the statistical confidence interval. When the settlement rate exceeds the threshold defined by the foundation design parameters, the dashboard generates a foundation alert with the affected pier or abutment identified.
Engineer action: Settlement rate alert initiates foundation investigation and scour countermeasure assessment.
Sensor View 05
Alert History and Sensor Health Status
Every alert event — from anomaly detection through severity classification to engineer acknowledgement — is logged with the sensor data trace, the feature trend at alert time, and the engineer's response. The alert history is searchable by bridge, sensor domain, date range, and alert severity. Sensor health status is displayed separately: battery level, signal-to-noise ratio, data completeness percentage, and last calibration date. A sensor with deteriorating signal quality is flagged for maintenance before it creates a data gap.
Engineer action: Review alert history for pattern confirmation. Schedule sensor maintenance for flagged units.
Sensor View 06
Digital Twin Integration — Model Updating and Scenario Simulation
For bridges with a digital twin, the AI-SHM platform feeds feature data directly into the finite element model for continuous calibration. Detected anomalies trigger automated model updating — adjusting bearing stiffness, member section properties, or foundation boundary conditions to match the sensor-observed behaviour. The updated twin enables scenario simulation: if the crack growth rate continues at the current trajectory, what is the remaining fatigue life? If the bearing stiffness degrades another 20%, what is the redistribution impact on adjacent supports? The bridge engineer receives both the sensor alert and the simulation result in a single workflow.
Engineer action: Scenario simulation results inform intervention timing and prioritisation across the bridge fleet.
We had strain gauge data on our fracture-critical tied-arch bridge for three years before deploying AI analytics. The data was archived, inspected quarterly on paper charts, and never produced an alert because no individual reading exceeded the allowable microstrain limit. After we deployed the AI layer, the model identified that the strain distribution at the floorbeam-to-arch connection had been shifting progressively toward the web-gap region over 18 months — a pattern consistent with distortion-induced fatigue cracking that no single reading could reveal. Targeted inspection confirmed a 12 mm crack at the web gap that was not visible from the deck or from under-bridge access at the previous biennial inspection. The crack had been developing for at least 12 months. The AI detected it 14 weeks before the next scheduled inspection would have found it. That detection window was the difference between a weld repair performed under traffic and a fracture-critical emergency closure.
— Senior Bridge Engineer, State Department of Transportation — Tied-Arch Fracture-Critical Bridge
62%
Internal Rate of Return from Smart Bridge SHM Fleet Deployment
Documented IRR across a four-bridge smart bridge fleet programme — achieved through avoided emergency repairs, deferred capital expenditure, and condition-based maintenance scheduling. Net present value of $3.2 million over the fleet programme period.
$300-400M
Projected 20-Year Savings From Fleet-Level Smart Bridge Strategy
Economic modelling from Manitoba's 20-bridge smart bridge programme projects budget savings between $300 million and $400 million over 20 years through deferred capital expenses and optimised lifecycle management. Annual operating cost is under $500,000.
Conclusion
Bridge structural health monitoring is not a sensor deployment problem — it is an analytics architecture problem. When strain gauge data is reviewed as individual readings against allowable limits, fatigue crack precursors go undetected until the crack is visible. When accelerometer data is examined as raw acceleration time histories without modal parameter extraction, bearing stiffness degradation is invisible until the bearing seat shows physical signs of distress. When displacement data is analysed without temperature decomposition, foundation settlement rates below 5 mm per year are indistinguishable from thermal drift. These are not sensor limitations; they are analytical gaps that AI closes directly.
The industry evidence is converging on a clear conclusion: AI-powered SHM analytics that process strain, vibration, and displacement data through ML-based anomaly detection and classification achieve over 94% accuracy in identifying structural damage patterns, provide a 2-to-6-week early warning window before visual confirmation, and reduce emergency repair frequency by 35-40% through predictive rather than reactive intervention. The documented ROI from fleet-level smart bridge programmes — $3.2 million NPV on four bridges, $300-400 million projected savings across 20 bridges — demonstrates that the economic case is as strong as the engineering case.
iFactory's AI-SHM platform is purpose-built for bridge engineers who need to close the gap between sensor deployment and structural assessment. Book a Demo to see the analytics layer configured for your bridge inventory and sensor architecture, or talk to an expert about a free SHM analytics readiness assessment for your instrumented bridges.
Frequently Asked Questions
The AI model requires a minimum of 3 to 6 months of continuous sensor data to establish a statistically robust baseline for the primary anomaly detection features — modal frequencies, strain range distributions, and temperature-displacement correlations. Twelve to eighteen months of data captures seasonal temperature variation and improves the model's ability to distinguish between thermal effects and structural changes. If less than 3 months of data is available, the system deploys in a supervised baseline-building mode where alerts are generated but classified as low confidence until the baseline matures. The model also supports transfer learning from similar bridge types (same superstructure configuration, similar span range, comparable traffic loading), which can reduce the baseline-building period by up to 50% for bridges where data from a comparable instrumented structure is available. Talk to an expert about configuring the baseline-building window for your instrumented bridge inventory.
Temperature-induced frequency shifts are reversible — frequency returns to the baseline value when the temperature returns to the reference condition. Bearing deterioration produces an irreversible or progressively increasing shift that does not reverse with temperature. The ML model is trained on paired temperature-frequency data from the baseline period to learn the reversible temperature-frequency relationship for each mode. When a frequency shift is detected, the model computes the temperature-corrected frequency residual — the difference between the measured frequency and the frequency predicted by the temperature model. If the residual is statistically significant and persists beyond the thermal cycle duration, the shift is classified as a structural change rather than a thermal effect. This approach has been validated on long-span suspension bridges and prestressed concrete highway bridges, where temperature-compensated frequency monitoring detected bearing stiffness degradation 4 to 6 weeks before visual signs appeared. Book a Demo to see temperature-compensated modal analysis configured for your bridge type.
The iFactory AI-SHM platform is sensor-agnostic and integrates with existing sensor infrastructure through standard data acquisition interfaces — Modbus, OPC-UA, MQTT, REST API, and direct file ingestion for CSV, HDF5, and structured database exports. The platform supports all common bridge SHM sensor types: foil and vibrating-wire strain gauges, MEMS and piezoelectric accelerometers, laser and linear displacement sensors, fibre-optic distributed sensors, temperature sensors, and tiltmeters. For bridges with existing data acquisition systems, the platform connects to the existing data pipeline without requiring sensor replacement or additional hardware at the sensor level. A field-proven integration pattern uses an edge gateway installed at the bridge site that collects data from existing sensor nodes via the available protocol, performs initial quality control and downsampling, and transmits the processed data to the cloud analytics platform over cellular or fibre connection. Sensor replacement is only recommended when existing sensors have exceeded their service life or when additional sensor density is required to cover previously unmonitored details. Talk to an expert about configuring the data ingestion layer for your existing sensor architecture.
Yes. The data ingestion layer normalises all incoming sensor data to a common schema regardless of sensor vintage, manufacturer, or data format. Each sensor is registered with its metadata — type, model, installation date, calibration history, location on the structure, measurement range, and sampling frequency — and the platform handles the unit conversion, time-synchronisation, and resolution alignment automatically. For example, a foil strain gauge installed in 2018 and a fibre-optic strain sensor installed in 2024 on the same bridge are both ingested as strain data streams in microstrain units, time-synchronised to UTC, and available for cross-correlation analysis. The AI anomaly detection model treats each sensor as an independent input channel and learns the correlation structure between them during the baseline-building period — so the model understands that a strain event at gauge 12 should be correlated with a displacement event at sensor 7 based on the historical data pattern, regardless of when each sensor was installed. This capability is critical for the large number of bridges where SHM deployment has been phased over multiple budget cycles. Book a Demo to see multi-vendor sensor integration configured for a phased-deployment bridge.
The Gap Between Sensor Data and Structural Assessment Is Not a Data Problem. Get a Free SHM Analytics Readiness Assessment.
iFactory's AI-SHM platform for bridge engineers — sensor-agnostic analytics that convert strain, vibration, and displacement data into fatigue crack detection, bearing deterioration alerts, and foundation settlement warnings 2-6 weeks before visual confirmation, with digital twin integration and audit-ready condition records.