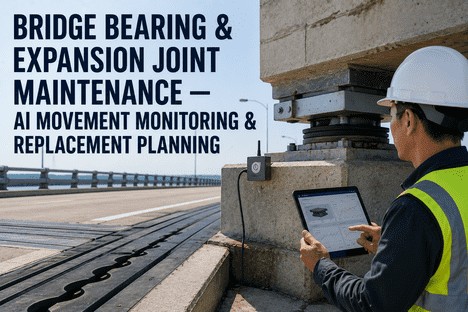
Bridge Bearing & Expansion Joint Maintenance — AI Movement Monitoring & Replacement Planning
By Grace on June 19, 2026
A bridge bearing seizes at 3 a.m. on a December night. The deck expands against a locked support. By morning, the expansion joint at the far abutment has extruded 40 mm beyond its design limit — the neoprene gland is torn, the steel extrusion is bowed, and the approach slab has a transverse crack wide enough to trap a truck tire. The maintenance manager gets the call at 4:17 a.m. — not from a sensor, but from a highway patrol officer who drove over the failed joint at 90 km/h. This is how bearing and expansion joint failures present in every infrastructure agency that relies on scheduled inspections: not as gradually developing conditions with a documented progression, but as sudden events that were predictable weeks or months earlier if the right data had been collected and interpreted. The technology to prevent this pattern has existed for years. The gap is not in sensor availability — it is in the integration of movement data, seal condition tracking, and replacement planning into a single system that a maintenance manager can open on a Monday morning to see which bearings are drifting off their neutral axis, which joints are approaching their cumulative movement limit, and which assets can safely be deferred to the next budget cycle versus those that need intervention this quarter.
AI Movement Monitoring · Bearing Tilt Detection · Joint Seal Condition Tracking · Degradation-Based Replacement Planning
Every Bearing and Joint on Your Bridge Network Has a Performance Curve That Predicts Its Failure. The Question Is Whether Your System Is Reading It.
iFactory's AI-powered monitoring platform tracks thermal movement patterns, bearing alignment drift, and joint seal degradation continuously — so maintenance managers schedule replacements based on actual condition trajectory, not calendar intervals that have no relationship to real deterioration rates.
The Cost of Getting It Wrong — What Every Bearing and Joint Failure Actually Costs the Agency
When a bearing fails or an expansion joint reaches end-of-life without a planned replacement window, the costs cascade across three categories that most maintenance budgets track separately but that every failure connects in a single event. The direct replacement cost — the bearing unit, the joint assembly, the deck lifting, the traffic management — is the visible portion. The indirect costs — emergency contractor mobilization at overtime rates, lane closures that disrupt network-level traffic flow, and the accelerated deterioration of adjacent components exposed to water and deicing chemicals through the failed joint — are typically three to five times the direct cost. And the reputational cost — a bridge that suddenly requires weight restriction or single-lane operation because an unmonitored bearing has drifted beyond its functional limit — erodes public and political confidence in the maintenance programme that a quarterly condition report cannot restore.
Direct Replacement
USD 6,000–20,000 per bearing
Unit cost including supply, jacking, installation, and traffic management for a single bearing replacement on a typical highway bridge.
Emergency Mobilisation
1.8–3.5x planned cost
Emergency reactive replacement costs due to overtime contractor rates, expedited bearing procurement, and unplanned lane closure duration that exceeds planned work windows.
Downstream Deterioration
3–5x joint cost in substructure repairs
Water and chloride infiltration through a failed expansion joint accelerates corrosion of girder ends, bearing assemblies, pier caps, and abutment backwalls within 18–24 months of seal failure.
Why Bearings and Joints Fail — and Why Scheduled Inspections Keep Missing the Warning Signs
Bridge bearings and expansion joints are the only structural components designed to move. Every other element — girders, piers, abutments, deck — is designed for static or quasi-static load resistance. Bearings and joints must accommodate daily thermal cycles of 15 to 30 degrees Celsius, seasonal cumulative displacement in the range of 200 to 600 mm per year depending on span length and climate zone, and the superimposed effects of creep, shrinkage, and braking loads. This movement regime creates specific deterioration mechanisms that periodic visual inspections — conducted at intervals of 12 to 48 months — are structurally incapable of capturing.
Bearing Deterioration Mechanisms
Five Conditions That Precede Bearing Failure
Elastomer cracking and delamination: Surface ozone cracking progresses to internal delamination under cyclic loading. Visible only when cracking exceeds 3 mm depth — typically 12–18 months after initiation.
PTFE sliding surface wear: Cumulative displacement wears the PTFE surface, increasing friction coefficient from 0.03 to above 0.10. The bearing begins to lock during thermal movement, transferring design loads to substructure elements.
Bearing tilt and misalignment: Differential settlement or rotation pushes the bearing off its neutral axis. Tilt beyond 0.01 radians induces eccentric loading on the masonry plate and sole plate connection bolts.
Corrosion of load plates: Water infiltration through failed joint seals above the bearing causes plate-edge corrosion that reduces the effective load-bearing area by 15 to 25 percent before it is visible from the inspection access point.
Anchor bolt distress: Cyclic lateral loads progressively elongate bolt holes in the masonry plate. Eight to ten years of accumulated movement can reduce bolt shear capacity below AASHTO factored load requirements without visible bolt head displacement.
Expansion Joint Deterioration Mechanisms
Five Conditions That Precede Joint Failure
Neoprene gland tear and pullout: Strip seal glands pull out of the steel extrusion when cumulative displacement exceeds the seal's movement rating. Iowa DOT studies document this as the most common failure mode, occurring at 10–15 years of service — earlier when installation temperature is not matched to the bridge neutral position.
Steel extrusion anchorage failure: Anchor bars in the header concrete loosen under repeated traffic impact and thermal cycling. Extrusion movement accelerates beyond the design gap; adjacent concrete spalls within two traffic seasons.
Modular joint spring fatigue: Control springs in modular joints lose preload after 200,000 to 400,000 thermal cycles. Individual centre beams drift out of alignment, creating wheel impact zones and uneven load distribution across the sealing elements.
Debris accumulation and lock-up: Incompressible material trapped in the joint cavity restricts thermal closing. The bridge deck locks against the abutment or adjacent span; unintended compressive forces develop in the superstructure and substructure.
Concrete header spalling: Impact loading and freeze-thaw cycling at the joint edge spall the header concrete. Loss of support at the joint edge increases dynamic load on the seal by 40 to 60 percent, accelerating all other failure mechanisms.
What Scheduled Inspections Cannot Tell You — and What Continuous Monitoring Reveals
The fundamental limitation of periodic bridge element inspection is that it samples a dynamic system at static points in time. A bearing assessment conducted in July at 28 degrees Celsius captures the bearing at its fully expanded position. The same bearing inspected in January at minus 10 degrees Celsius will show a different alignment, a different gap condition, and potentially a different tilt reading. Neither inspection is wrong — but neither alone can distinguish between a bearing that is performing correctly across its full movement range and a bearing that has lost half its movement capacity and is operating only within a restricted window. Continuous monitoring resolves this ambiguity by establishing the thermal movement baseline for every bearing and every joint on every span — and comparing each new measurement against that baseline to detect deviation within days of its onset rather than months or years later.
Bearing and Joint Monitoring — Inspection vs. Continuous AI Tracking Comparison
Parameter
Biennial Visual Inspection
AI Continuous Monitoring
Thermal movement range
Snapshot at inspection temperature only. Full range estimated from design calculations — not measured.
Measured continuously across all temperature conditions. Actual maximum and minimum values known for every asset.
Bearing tilt detection
Qualitative assessment. Tilt below 2 degrees not reliably detected. Progression rate unknown between inspections.
Quantitative tilt tracking to 0.05-degree resolution. Rate of change calculated daily. Trend projection alerts before tilt exceeds design limits.
Joint seal condition
Visual condition rating based on observable tears, extrusion, or debris. Subsurface seal damage not visible.
Cumulative displacement tracking and seal gap measurement. Anomaly detection identifies seal degradation before visual failure.
Replacement planning
Calendar-based intervals. Replacement triggered by element condition rating falling below threshold, typically after visible failure.
Degradation-based planning using measured performance trajectory. Replacement scheduled months before failure when cost and traffic impact are minimised.
The iFactory AI Monitoring Architecture — Three Layers That Close the Gap Between Inspection Cycles
The iFactory platform is designed around the specific information architecture that bridge maintenance managers need: a continuous data layer that captures movement, tilt, and seal condition; an analytics layer that converts that data into condition trends and degradation projections; and a planning layer that schedules interventions based on actual asset performance rather than fixed calendar intervals. Each layer operates autonomously once configured, and the output of all three layers is accessible through a single dashboard that the maintenance manager uses to allocate quarterly and annual budgets, prepare inspection reports, and justify replacement requests to senior management and funding authorities.
Layer 01
Continuous Movement and Condition Sensing
IoT sensor network on every monitored bearing and joint
Low-power IoT sensors deployed at each bearing location and expansion joint measure longitudinal displacement, transverse movement, vertical settlement or rotation, and ambient temperature at configurable intervals from once per minute to once per hour. Data is transmitted via LoRaWAN or cellular network to the cloud platform without requiring site power or data cabling. Sensor battery life exceeds five years under normal operating conditions. Each sensor is registered to a specific asset in the bridge inventory, so every data point is automatically associated with the correct bridge, span, bearing or joint type, and installation date. The sensor network operates continuously through temperature ranges from minus 30 to plus 50 degrees Celsius and requires no calibration or maintenance during its service life.
Thermal displacement tracking
Bearing tilt and rotation monitoring
Joint gap and seal condition sensing
Layer 02
AI Analytics and Degradation Projection
Machine learning models that detect anomalies and forecast remaining useful life
The AI analytics layer processes every data point from the sensor network and performs three distinct analyses continuously. First, thermal movement correlation modelling establishes the expected displacement-temperature relationship for each bearing and joint based on the first 90 days of data. Second, anomaly detection compares every new measurement against this baseline — a bearing that begins showing 15 percent less return movement than its baseline on the cooling cycle is flagged within 48 hours, not at the next inspection 18 months later. Third, degradation trajectory projection uses the accumulated anomaly history to estimate remaining useful life for each asset, with confidence intervals that tighten as more data accumulates. The system's predictive models improve continuously as the data history grows; at 12 months of data, the degradation forecast typically converges to within 10 percent of the actual remaining life for standard bearing and joint configurations.
Thermal baseline modelling
Anomaly detection within 48 hours
Remaining useful life forecasting
Layer 03
Replacement Planning and Budget Optimisation
Schedule interventions based on actual condition trajectory and budget cycles
The planning layer aggregates asset-level degradation projections into a network-wide replacement schedule. Each bearing and joint is assigned a current condition score, a degradation rate, an estimated failure date at current trajectory, and a recommended replacement window. The maintenance manager can filter by bridge, span, bearing type, joint type, condition score, or time to failure — and export the filtered list directly into a budget submission or work programme document. Scenario planning tools allow the manager to model the impact of deferring specific replacements: delaying bearing replacement on Bridge A by one year reduces funding requirement this year but increases the probability of emergency replacement next year. The system quantifies both options so the budget decision is based on risk exposure rather than prioritisation by inspection backlog.
Network-wide replacement schedule
Scenario and deferral impact modelling
Budget submission export
What the Maintenance Manager's Dashboard Shows — Six Views That Replace the Inspection Backlog
The iFactory dashboard is designed around the specific decisions a maintenance manager makes every week: which assets need attention this quarter, which replacements can be deferred, what the budget exposure is if a failure occurs before the planned intervention, and what evidence exists to support the funding request. Every view is generated automatically from the sensor data and AI analytics — no manual data compilation, no spreadsheet reconciliation, no waiting for the next inspection report to discover what the sensors already detected three months ago.
View 01
Network Health Overview — Bearing and Joint Condition at a Glance
A map-based view of the entire bridge network with colour-coded condition indicators for every monitored bearing and expansion joint. Green indicates normal operation within baseline parameters. Yellow indicates a detected anomaly under investigation. Red indicates an asset that exceeds its intervention threshold and requires action within the configurable window. The maintenance manager sees the network status in 10 seconds rather than navigating through 50 inspection reports.
Action: Identify which bridges need attention this week without opening a single inspection file.
View 02
Thermal Movement Trend — Per Bearing and Per Joint
A time-series chart showing displacement versus temperature for any selected bearing or joint over any date range. The baseline correlation model is overlaid as a grey band. Current data points that fall outside the band are flagged in red. The maintenance manager can see at a glance whether a bearing that showed normal movement in the last inspection is starting to stick on the cooling cycle — the earliest precursor to PTFE wear and eventual lock-up.
Action: Identify sticking bearings before they lock. Trend deviation visible within days of onset.
View 03
Degradation Projection and Replacement Window
For each asset, the platform calculates and displays a remaining useful life estimate with lower and upper confidence bounds, a recommended replacement window based on the projected failure date minus a safety margin, and the consequence of deferring replacement beyond the recommended window — expressed as the probability of emergency intervention. The maintenance manager uses this view to prioritise replacements by urgency rather than by inspection cycle.
Action: Schedule replacements based on actual condition trajectory. Defer with quantified risk exposure.
View 04
Budget Scenario Modeller
The scenario tool allows the maintenance manager to select a subset of assets for planned replacement in the current budget cycle and see the projected impact on network condition scores, emergency replacement probability, and funding requirement. Deferred assets remain on the dashboard with an updated risk score that increases as the degradation trajectory continues. The output is exportable as a budget submission table showing each asset, its current condition, its projected condition at end of the budget cycle under both intervention and deferral scenarios, and the cost of each approach.
Action: Build budget submissions with quantified scenario evidence. Show senior management the cost of deferral.
View 05
Anomaly Event Log and Alert History
Every anomaly detected by the AI system is logged with the asset ID, the parameter that triggered the alert, the deviation magnitude from baseline, the timestamp, and the current status — new, investigated, scheduled for action, or resolved. The alert history provides the evidence trail that regulatory and funding audits require: a documented record that the maintenance programme identified the deterioration of Bearing A-12 twelve months before replacement occurred, intervened at the planned intervention point, and prevented an emergency failure. This is the audit record that demonstrates proactive management rather than reactive response.
Action: Generate audit-ready event records automatically. Demonstrate proactive maintenance to regulators and funders.
View 06
Asset Inventory with Complete Lifecycle History
Every bearing and joint in the monitored network has a digital record that aggregates the design specifications, installation data (including installation temperature and neutral gap setting), inspection history imported from the agency's bridge management system, continuous sensor data, AI anomaly events, replacement interventions, and post-replacement baseline data. The lifecycle record is searchable by asset ID, bridge number, span, bearing type, joint type, and date range. This single view eliminates the need to cross-reference design drawings, inspection reports, maintenance work orders, and budget spreadsheets to understand a single asset's history.
Action: Access complete lifecycle history for any asset in the network. One view replaces six separate data sources.
"
We had 34 bridges with elastomeric bearings that we were inspecting on a two-year cycle. Every inspection found the same set of bearings in similar condition — some surface cracking, some minor delamination at the edges — but we had no way of knowing which ones were actually deteriorating between cycles. We replaced bearings based on the inspector's subjective rating, which meant we were replacing some that still had five years of service life left and deferring others that failed eight months later. The AI monitoring system changed this completely. Within six months of deployment, the thermal movement data showed us that three bearings on one span were returning only 60 percent of their expected displacement on the cooling cycle — something no visual inspection had ever caught. We scheduled those for replacement in the next planned lane closure. The bearings that had surface cracking but normal thermal movement we confidently deferred. Our replacement spend in the first year dropped by 35 percent, and we eliminated emergency bearing replacements entirely.
— Bridge Maintenance Manager, US State DOT — 140-Bridge Network, Mixed Steel and Concrete Spans
Stop Replacing Bearings and Joints on a Calendar Schedule. Start Replacing Them When the Data Says They Need It.
iFactory's AI-powered monitoring platform for bridge maintenance managers — thermal movement tracking, bearing tilt detection, joint seal condition monitoring, degradation-based replacement planning, and audit-ready documentation generated automatically from the data your bridges already produce.
From Reactive to Predictive — the Financial Case for AI-Powered Bearing and Joint Monitoring
Every bridge maintenance manager operates within a budget constraint that is insufficient to replace all assets at their optimal intervention point. The financial case for AI monitoring is not that it eliminates replacement cost — it is that it ensures every dollar allocated to bearing and joint replacement is spent on the asset that most needs it, at the time when replacement cost and traffic impact are at their minimum. The published literature on bridge asset management is consistent on this point: agencies that transition from calendar-based to condition-based replacement schedules report 30 to 50 percent reductions in annual bearing and joint maintenance expenditure within the first two years, primarily through the elimination of emergency interventions and the deferral of assets that do not need replacement. The iFactory platform achieves this by providing the data that makes condition-based replacement defensible — not only to the maintenance manager's own team, but to the funding authorities and elected officials who approve the budget.
30–50%
Reduction in annual bearing and joint maintenance expenditure documented by agencies transitioning from calendar-based to AI condition-based replacement scheduling.
85%
Reduction in emergency bearing and joint interventions reported by early adopters of continuous AI monitoring — from an average of 5 to 8 emergency callouts per year to fewer than 1.
12–18 months
Lead time provided by AI degradation forecasting between anomaly detection and functional failure — enough to plan, budget, and schedule replacement during a planned lane closure rather than an emergency one.
5–8 years
Additional service life achieved for bearings and joints through early anomaly detection and targeted maintenance intervention before damage becomes irreversible.
Conclusion
Bridge bearing and expansion joint failure is not an unpredictable event — it is a predictable process that current inspection protocols are not designed to capture. Bearings do not seize spontaneously. Joints do not fail without weeks or months of accumulating deviation from their thermal movement baseline. The deterioration mechanisms — PTFE wear, elastomer cracking, seal tear propagation, anchor bolt elongation — all follow measurable trajectories that begin long before the component reaches a condition state that a biennial inspection would flag. The limitation is not in the predictability of the process but in the frequency and resolution of the data used to observe it.
AI-powered continuous monitoring addresses this limitation directly. By measuring thermal displacement, bearing alignment, and joint condition at hourly intervals and comparing every measurement against a dynamically updated baseline, the system detects the onset of deterioration within days rather than months or years. The maintenance manager sees not a biennial snapshot of condition but a continuously updated trajectory of performance — and makes replacement decisions based on where that trajectory is heading, not where it was at the last inspection.
The financial case is equally direct. Emergency bearing replacement at overtime rates costs two to four times a planned replacement. A failed expansion joint that leaks deicing chemicals onto girder ends and bearing assemblies for 18 months accelerates substructure deterioration that costs three to five times the joint replacement itself. And every emergency intervention consumes budget that was allocated for planned replacements, perpetuating a cycle in which reactive maintenance dominates the expenditure profile and planned maintenance is continuously deferred. Continuous AI monitoring breaks this cycle by providing the data that justifies planned intervention before the emergency occurs — and the audit trail that proves the maintenance programme is proactive, not reactive.
iFactory's AI-powered monitoring platform is designed for bridge maintenance managers who need to eliminate emergency bearing and joint failures, optimise replacement spend across a constrained budget, and demonstrate to regulators and funding authorities that the maintenance programme is driven by data rather than by inspection cycles. Book a Demo to see the platform configured for your bridge network, bearing types, and joint inventory. Or talk to an expert about a free AI monitoring assessment for your highest-risk bearing and expansion joint assets.
Frequently Asked Questions
Sensor density depends on the bridge configuration, span length, bearing type, and joint type. A typical simply supported steel or concrete girder bridge with expansion joints at both abutments requires one displacement-temperature sensor per bearing line at the expansion end and one joint gap sensor at each expansion joint — typically 4 to 8 sensors total per single-span bridge. Multi-span bridges with intermediate expansion joints require additional sensors at each expansion location. Sensors are installed on the bearing masonry plate or sole plate using non-invasive brackets, and on the joint extrusion or header using surface-mounted fixtures. Installation takes 30 to 45 minutes per sensor and does not require traffic lane closure — sensors are installed from the inspection walkway or using an under-bridge access unit. Each sensor is factory-paired with a LoRaWAN gateway that covers up to 15 km in open terrain. Talk to an expert about a sensor layout plan for your bridge network.
The thermal movement baseline requires a minimum of 14 days of data covering a temperature range of at least 15 degrees Celsius to establish a statistically significant displacement-temperature correlation. In temperate climates with seasonal temperature variation, a reliable baseline is typically established within 30 days of installation. The AI system begins detecting anomalies in shadow mode from day one — generating alerts internally without sending them to the dashboard — allowing the maintenance manager to validate alert accuracy against known conditions before the system becomes operational. Full operational mode with dashboard alerts and degradation projections is typically enabled after 90 days, by which point the model has sufficient data to distinguish between measurement scatter and genuine deviation. The degradation trajectory projection converges to useful accuracy within 6 to 12 months of continuous data collection. Book a Demo to see deployment timelines and validation data from comparable bridge networks.
iFactory is designed to complement existing bridge management systems, not replace them. The platform imports bridge inventory data, inspection records, and element condition ratings from AASHTOWare, Pontis, or any standard BMS via CSV, XML, or API integration. Sensor data and AI analytics are presented alongside imported inspection data in the same dashboard — the maintenance manager sees both the biennial condition rating and the continuous sensor trend for each asset in a single view. Inspection workflow is unaffected: inspectors continue their scheduled visual inspections, and the sensor data provides additional evidence that the inspector can use to validate or update condition ratings. The key integration point is that sensor-detected anomalies are automatically flagged for the inspector's attention before the next inspection — so the inspector arrives at the bridge knowing which bearings or joints need closer evaluation. Talk to an expert about integration options for your specific bridge management system.
ROI varies with network size, asset age profile, and current emergency intervention frequency, but the contributing factors are consistent across deployments. The primary savings come from four sources: elimination of emergency bearing replacements at 1.8 to 3.5 times planned cost, deferral of bearings and joints that do not need replacement based on sensor data rather than calendar schedules, avoidance of downstream substructure damage from undetected joint seal failure, and reduction in inspection labour cost through targeted rather than blanket inspection priorities. Agencies with 50 to 200 bridges typically achieve full payback on the monitoring system investment within 12 to 18 months of full deployment. A Midwest US state DOT with a 140-bridge network reported net savings of USD 420,000 in the first year of operation against a monitoring system cost of USD 180,000 — an ROI of 233 percent in year one, with year-two savings projected to increase as the degradation models continue to improve. Book a Demo to discuss an ROI projection for your bridge network.
The platform is bearing-type agnostic. Sensor configuration and baseline modelling parameters are adjusted for the specific movement characteristics of each bearing type. Elastomeric bearings are monitored primarily for shear displacement and tilt — the key indicators of elastomer degradation and PTFE wear in sliding elastomeric bearings. Pot bearings are monitored for vertical settlement, rotation, and seal leakage (detected through abnormal displacement patterns rather than direct fluid sensing). Disc bearings are monitored for rotational displacement and load plate corrosion indicators. Spherical bearings are monitored for multi-axial rotation and sliding surface wear. Steel rocker and roller bearings — the oldest and most failure-prone type in many inventories — are monitored for roll axis alignment, lateral displacement, and corrosion-induced binding. Each bearing type has a default degradation model calibrated to published deterioration rates, which is refined with actual data from the first 6 to 12 months of monitoring. Talk to an expert about sensor configuration for your specific bearing inventory.
The Next Bearing or Joint Failure on Your Network Is Already Developing. AI Monitoring Will Detect It Before It Disrupts Traffic. Get a Free AI Monitoring Assessment.
iFactory's AI-powered monitoring platform for bridge maintenance managers — continuous thermal movement tracking, bearing tilt detection, joint seal condition monitoring, degradation-based replacement planning, and audit documentation generated automatically from the data your bridges already produce.