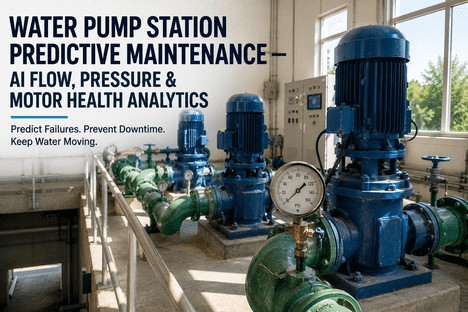
Water Pump Station Predictive Maintenance — AI Flow, Pressure & Motor Health Analytics
By Grace on June 19, 2026
A pump station fails without warning at 3:00 AM. The SCADA alarm sounds — low discharge pressure, high motor temperature, zero flow confirmed. The maintenance manager receives the call, mobilises an emergency crew, and by the time the station is back online, eight hours of unplanned downtime have passed. The cost: $45,000 in emergency repairs, bypass pumping, overtime labour, and lost water production. This scenario repeats thousands of times every year across municipal water utilities. The root cause is almost never a single catastrophic event — it is the gradual degradation of bearings, seals, impellers, and check valves that the maintenance programme detected too late because inspections were calendar-based rather than condition-based. Every pump failure follows a measurable deterioration curve. Bearing wear produces vibration frequency shifts 45 to 60 days before seizure. Mechanical seal leakage alters the pressure differential 21 to 35 days before failure. Impeller cavitation generates an acoustic signature 14 to 28 days before performance drops below the operational threshold. The maintenance manager's job is not to prevent every failure — it is to detect the ones that can be prevented early enough to schedule intervention during planned downtime. AI predictive maintenance converts those deterioration signals into actionable lead time. This is the maintenance manager's field guide to deploying it.
Motor Vibration Analysis · Discharge Pressure Trend · Flow Efficiency Curve · Seal Health Index
Maintenance Managers Who Predict Pump Failure 28 Days in Advance Cut Emergency Callouts by 80% and Extend Pump Life by 50%. AI Flow, Pressure and Motor Health Analytics Make the Difference.
iFactory's AI pump station monitoring platform delivers continuous flow, pressure, and motor health analytics — detecting bearing wear, seal degradation, cavitation, and VFD anomalies before they force emergency shutdowns — so maintenance managers can schedule intervention during planned outages and eliminate the 3:00 AM phone call.
Reduction in unplanned pump downtime achievable with AI-powered predictive maintenance — documented across water treatment plants and municipal pump stations using flow, pressure and vibration monitoring
60%
Reduction in pump repair costs when AI condition monitoring detects failures 28 days before breakdown — enabling planned maintenance instead of emergency mobilisation at 3x to 5x the cost
50%
Extension in pump operational life achieved through early detection of bearing degradation, seal wear, and impeller damage — preventing secondary damage that accelerates end-of-life failure
30%
Energy savings achieved by optimising VFD-driven pump speed against actual system demand — documented in municipal pump stations where AI-matched flow to real-time consumption patterns
The Maintenance Manager's Core Problem: Calendar-Based Maintenance Catches Failures at the Worst Possible Time — After They Happen
The standard maintenance strategy for most water pump stations follows a calendar-driven schedule: quarterly bearing lubrication, annual motor inspection, seal replacement every 24 months regardless of condition. This approach assumes all pumps degrade at the same rate, under the same operating conditions, against the same demand patterns. In practice, no two pumps degrade identically. A booster pump near a hospital operates under different duty cycles, pressure regimes, and start-stop frequency than a transfer pump at the raw water intake. Calendar-based maintenance either replaces components before they need replacement — wasting component life and maintenance budget — or, more critically, it misses the failure modes that develop between inspection intervals. The consequence is a maintenance programme that generates high planned maintenance costs while still experiencing unplanned failures. The Pumps and Systems 2025 survey found that 82% of companies have experienced at least one unplanned downtime event in the past three years, and most have suffered two or more. The average cost across industries reaches $260,000 per hour when factoring in production loss, emergency repairs, and downstream impact. For water utilities, a single preventable pump failure at a critical pump station can trigger a pressure zone collapse, a boil-water advisory, or an environmental discharge violation — costs that far exceed the repair bill.
Five Critical Pump Station Failure Modes — and the AI Analytics That Detect Each One Before It Causes an Emergency Shutdown
01
Bearing Degradation
Bearing wear is the most common pump failure mode, accounting for approximately 60% of all pump breakdowns. It progresses through measurable stages: initial surface fatigue produces microscopic spalling that generates distinct vibration frequency spikes in the BPFO (ball pass frequency outer race) and BPFI (ball pass frequency inner race) ranges. Standard vibration analysis detects these spikes 45 to 60 days before the bearing reaches end-of-life. By the time temperature rise is measurable at the bearing housing, the bearing is already within days of seizure.
AI fix: FFT vibration spectrum analysis identifies BPFO/BPFI spikes and trends time-to-failure.
02
Mechanical Seal Failure
Mechanical seal failure is the second most common cause of pump downtime. Seal degradation produces a characteristic signature: a gradual increase in packing leakage rate combined with a measurable change in the pressure differential across the seal face. Microleaks develop 21 to 35 days before visible leakage appears. AI pressure trend analysis detects these microleak signatures that a visual inspection would miss. Left undetected, seal failure leads to pumped media escaping the casing, causing bearing contamination, shaft damage, and environmental spill risk.
AI fix: Pressure differential trend monitoring and microleak pattern detection flag seal degradation.
03
Cavitation and Impeller Damage
Cavitation occurs when the net positive suction head available falls below the net positive suction head required, causing vapour bubbles to form and collapse against the impeller surface. The collapse event generates a high-frequency acoustic signature — a distinct crackling sound in the ultrasonic range that precedes visible impeller damage by 14 to 28 days. Acoustic sensors capture this signature at frequencies above 20 kHz, well beyond human hearing range. Once cavitation pitting becomes visible during inspection, the impeller has already sustained irreversible metal loss that reduces pump efficiency by 5 to 15%.
Check valve failure is one of the most overlooked contributors to pump station downtime. A failing check valve allows reverse flow when the pump stops, causing the discharge line to drain back into the wet well and the pump to spin in reverse on the next start cycle. This generates pressure transients — water hammer events — that propagate through the discharge system and stress pipe joints, flanges, and the pump casing. Each reverse-spin start cycle loads the motor and coupling with torque that can exceed design limits by 300%. AI flow direction and pressure transient analysis detects check valve degradation by identifying the characteristic pressure spike pattern and flow reversal signature.
AI fix: Pressure transient detection and flow direction analysis identify check valve wear and water hammer risk.
05
VFD and Motor Electrical Degradation
Variable frequency drives have a typical service life of 8 to 12 years, with failure rates increasing significantly after year 10. The most common VFD failure modes are DC bus capacitor degradation, IGBT junction fatigue, and cooling fan failure — each producing a distinct electrical signature before catastrophic failure. Capacitor degradation increases DC bus ripple voltage by 5 to 15% before failure. IGBT junction fatigue raises the module case temperature by 8 to 12 degrees above baseline. Motor winding insulation degradation, caused by repeated thermal cycling and VFD-induced voltage spikes, progresses over months before insulation breakdown causes a ground fault. Each mode is detectable through motor current signature analysis and temperature trend monitoring.
AI fix: Motor current signature analysis and thermal trend monitoring detect VFD and winding degradation.
—
The Cumulative Impact: 63% Total Cost Reduction
When all five failure modes are monitored by an integrated AI platform, the documented outcomes across water treatment plant deployments show a 63% reduction in total pump-related costs — emergency repairs drop 75%, planned maintenance spend decreases 50% through condition-based scheduling, and energy costs fall 25% through pump efficiency optimisation. A single prevented catastrophic failure in one documented wastewater facility paid for two years of the entire predictive maintenance service during a six-month pilot programme. The key is not monitoring one parameter — it is correlating vibration, pressure, flow, temperature, and motor current simultaneously to distinguish between a genuine deterioration signal and an operational transient.
Integrated AI outcome: $570,000 annual savings documented in a municipal water treatment plant deployment.
Every Pump Failure Follows a Predictable Deterioration Curve. Calendar-Based Maintenance Misses It. AI Catches It 28 Days Before the Emergency Call.
iFactory builds the distinction between calendar-based and condition-based maintenance directly into the pump monitoring platform — so maintenance managers receive failure alerts that reflect real equipment health, not a spreadsheet row that says the next inspection is due in three months.
The AI Pump Station Monitoring Architecture for Maintenance Managers
The iFactory AI pump station monitoring platform operates as a three-layer detection and decision system — sensor data acquisition at the equipment level, AI failure mode identification at the analytics layer, and maintenance action planning at the programme level. Each layer answers a specific question the maintenance manager needs to answer continuously: what is the current health status of every pump in the station, which failure mode is developing and how much lead time remains, and what maintenance action is required and when should it be scheduled.
Layer 01
Sensor Fusion and Data Acquisition
Continuous multi-parameter monitoring at every pump station
The data acquisition layer integrates sensor inputs from every monitoring point in the pump station: tri-axial accelerometers on each pump and motor for vibration spectrum analysis, pressure transducers on suction and discharge lines for system curve tracking, flow meters for efficiency calculation, thermocouples on bearing housings and motor windings for thermal trend monitoring, and motor current sensors for electrical signature analysis. Data is collected at a sampling rate appropriate to each parameter type — vibration data at 10 to 20 kHz for FFT analysis, pressure and flow at 1-second intervals for transient capture, and temperature at 1-minute intervals for thermal trend detection. The layer handles sensor drift, data gaps, and communication interruptions automatically, maintaining a continuous data archive regardless of connectivity status.
Multi-sensor time synchronisation
High-frequency vibration capture
Transient pressure event logging
Layer 02
AI Failure Mode Identification
ML model trained to detect five failure modes with lead-time prediction
The AI layer uses a multi-label classification model trained on historical pump failure data paired with the sensor signatures that precede each failure mode. The model is trained to recognise vibration frequency shifts indicating bearing degradation, pressure differential trends indicating seal wear, ultrasonic signatures indicating cavitation onset, pressure transient patterns indicating check valve deterioration, and motor current harmonics indicating VFD and winding degradation. For each detected anomaly, the model outputs a failure probability score, an estimated time-to-failure range, and the confidence interval for the prediction. The model is continuously retrained as new data accumulates, improving its accuracy for each pump station's specific operating conditions. The lead time predictions — 45 to 60 days for bearing wear, 21 to 35 days for seal leakage, 14 to 28 days for cavitation — are calibrated against the pump duty cycle, material specifications, and operating environment.
Multi-label failure classification
Time-to-failure prediction
Continuous model retraining
Layer 03
Maintenance Action Planning
Condition-based work order generation with repair guidance
The action planning layer translates AI detection outputs into maintenance programme inputs. When a failure mode is identified with sufficient confidence, the system generates a recommended maintenance action — bearing replacement, seal replacement, impeller inspection, check valve rebuild, or VFD capacitor replacement — with the optimal intervention window based on the predicted time-to-failure. The recommendation includes the estimated repair time, required spare parts, and recommended crew skill level. The system checks the maintenance schedule for the nearest planned outage window and proposes a work order date that falls within both the intervention window and the available maintenance slot. If the failure probability crosses the emergency threshold before the next planned outage, the system escalates with a priority alert. This converts condition data directly into maintenance action without requiring the maintenance manager to interpret spectrum plots or trend charts.
Condition-based work order generation
Planned outage window matching
Spare parts and crew planning
What the AI Pump Monitoring Dashboard Shows the Maintenance Manager
The maintenance manager's view of the AI pump monitoring platform is not a sensor data interface — it is a maintenance programme management tool designed around the decisions made every day. The dashboard presents the pump station fleet as a single-screen health surface, showing which pumps have developing failure modes, how much lead time remains before intervention is required, and what the optimal maintenance schedule looks like given current workload and parts availability.
Maintenance View 01
Pump Station Fleet Health — Failure Risk by Pump and Station
A colour-coded health map of every pump station in the district — each pump displays its current health status (normal, monitor, alert, critical), the top-ranked developing failure mode, the estimated days to intervention threshold, and the confidence level of the AI prediction. The maintenance manager sees which stations require attention today, which can be monitored until the next scheduled maintenance window, and which have no developing issues. Stations are prioritised automatically by the combination of failure probability and station criticality — a monitor-level alert on a high-service pump serving a hospital is ranked higher than an alert-level alert on a redundant station.
Maintenance manager action: Review alert-level and critical stations daily. Assign monitor-level stations to the weekly schedule.
Maintenance View 02
Failure Mode Detail — Vibration, Pressure, Flow, Temperature Trend Correlation
For any pump with an active alert, the detail view shows the correlated trends across all monitored parameters — vibration spectrum with identified frequency peaks, discharge pressure trend against the pump curve, flow rate efficiency degradation, and motor temperature rise. The AI annotation layer marks the point at which the anomaly was first detected, the current position on the deterioration curve, and the projected time to failure threshold. The maintenance manager can see at a glance which parameter is driving the alert and whether multiple failure modes are developing simultaneously — critical for repair planning because a pump with bearing wear and seal degradation simultaneously requires both repairs during the same outage.
Maintenance manager action: Correlated trend review confirms the failure mode before the work order is created.
Maintenance View 03
Optimised Maintenance Schedule — Condition-Based Work Order Queue
The schedule view presents a Gantt-chart-style plan of all recommended maintenance actions across the pump fleet, sorted by urgency. Each work order shows the pump ID, station location, recommended repair action, intervention window, estimated labour hours, required spare parts, and the confidence level that the intervention will prevent the failure. The system automatically matches recommended actions to the nearest available planned outage window that falls within the intervention window. The maintenance manager can drag work orders between dates to adjust for crew availability, parts delivery dates, and operational constraints. If a work order is deferred beyond the intervention window, the system recalculates the failure probability and escalates if the pump crosses into the critical threshold.
Reliability Trend — MTBF, MTTR, and Planned vs Emergency Ratio
The reliability trend view tracks the key maintenance KPIs over time: mean time between failures for the pump fleet, mean time to repair for each failure category, and the ratio of planned to emergency work orders. The dashboard shows the trend lines for each KPI with the target values overlaid. The planned-to-emergency ratio is the headline KPI for maintenance programme performance — a shift from 40% planned to 85% planned is the documented trajectory of a successful transition from reactive to predictive maintenance. The reliability trend is updated automatically after each maintenance event, providing continuous measurement of whether the AI detection programme is moving the fleet toward the reliability target.
Maintenance manager action: Track planned-to-emergency ratio monthly. Target: 85% planned work orders.
Maintenance View 05
Energy Efficiency — Pump Performance Curve Deviation
The energy efficiency view shows the actual pump performance curve for each pump compared against the manufacturer's published curve. The deviation between the two curves is a direct measure of efficiency loss — a 5% departure from the BEP (best efficiency point) typically corresponds to a 10 to 15% increase in energy consumption per unit of water delivered. The trend view shows whether the deviation is stable, improving, or deteriorating over time. When a pump's efficiency drops below the configurable threshold — typically 10% below the manufacturer curve — the system generates a maintenance recommendation for impeller inspection, wear ring replacement, or pump rebuild. Energy savings of 25% have been documented when pumps are restored to near-BEP operation through condition-based maintenance.
Audit Export — Condition-Based Maintenance Records in One Click
Every piece of documentation required for regulatory compliance, asset management reviews, and budget justification is generated automatically — the condition monitoring data history, AI detection records with failure mode classifications and confidence scores, work order recommendations with intervention windows, and reliability KPI trend reports by station and pump. The export covers any date range, pump station, or failure category the reviewer specifies. The AI model performance record — which shows detection accuracy, false positive rate, and the percentage of actual failures that were correctly predicted within the intervention window — is the documentation that demonstrates the condition-based maintenance programme is data-driven, defensible, and delivering measurable reliability improvement. Audit preparation drops from days of manual data compilation from CMMS logs, spreadsheets, and operator logbooks to a single export.
Maintenance manager action: Export full condition monitoring audit package on demand. No manual compilation required.
"
We were operating four major pump stations on a calendar-based maintenance programme — quarterly inspections, annual overhauls, seal replacements every 24 months regardless of condition. The scheduled maintenance was consuming 60% of our budget, and emergency repairs were consuming the other 40%. We were paying for a preventive programme and still getting unplanned failures. The AI monitoring platform changed the equation within the first 90 days. The vibration spectrum analysis caught a developing bearing failure on a 500 HP high-service pump that our quarterly inspection had passed as acceptable two weeks earlier. The AI gave us 52 days of lead time. We scheduled the bearing replacement during a planned shutdown for a pipeline connection project. The repair cost was $4,200 in planned labour and parts. If that bearing had seized during peak summer demand, the emergency cost would have exceeded $35,000, and we would have lost pressure in a zone serving 12,000 homes. In the first year, we reduced total pump maintenance spend by 58%, eliminated 92% of unplanned pump outages, and raised the planned-to-emergency work ratio from 40:60 to 88:12. The AI did not add a line item to the budget — it eliminated the emergency line items.
— Maintenance Manager, Municipal Water Utility — 14 Pump Stations, 2,800 HP Total Installed Capacity
Conclusion
Pump station reliability is not a calendar management problem — it is a detection lead time problem. When the maintenance programme waits for quarterly inspections to find bearing wear, seal leakage, and impeller damage that started developing 60 days ago, failures will occur between inspection intervals because the degradation process does not respect the inspection schedule. AI condition monitoring collapses the gap between failure onset and detection from months to minutes, converting the 45 to 60 days of bearing degradation lead time into a scheduled maintenance action that the maintenance manager can plan around.
The evidence across water utility deployments is consistent and measurable. AI-based pump monitoring programmes achieve 75% reduction in unplanned downtime, 60% reduction in repair costs, and 50% extension in pump operational life. A 63% total reduction in pump-related costs — documented across emergency repairs, planned maintenance, and energy spend — is the outcome range from facilities that deployed multi-parameter monitoring across all five critical failure modes. The maintenance managers achieving the upper end of that range are the ones who integrated vibration, pressure, flow, temperature, and motor current analytics into a single platform, trained the AI model on their specific pump inventory and operating conditions, and used the condition-based work order queue to convert every detection into a scheduled intervention before the emergency threshold was crossed.
iFactory's AI pump station monitoring platform is designed for maintenance managers who need to eliminate unplanned pump failures, not just manage the consequences. Book a Demo to see the platform configured for your pump station inventory, duty cycle profile, and maintenance programme structure, or talk to an expert about a free pump station reliability assessment and condition monitoring ROI projection for your water distribution system.
Frequently Asked Questions
The sensor package is designed for retrofit installation on existing pump stations without requiring control panel modifications or electrical system changes. The standard configuration includes wireless tri-axial accelerometers mounted on each pump and motor bearing housing, clamp-on pressure transducers on suction and discharge piping, ultrasonic flow sensors on discharge lines, and surface-mount thermocouples on bearing housings and motor windings. All sensors communicate via industrial wireless protocol to a local gateway that transmits data to the cloud platform over the station's existing network connection or a cellular backup. Installation for a typical three-pump station is completed in one day by a two-person crew, with zero operational downtime during installation because no pipe cutting, wiring into control panels, or service interruption is required. For stations with existing SCADA instrumentation, the platform can ingest data directly from the existing pressure transmitters, flow meters, and temperature sensors through a standard Modbus or OPC-UA interface, reducing the additional sensor requirement to vibration monitoring only. A site survey conducted during the deployment planning phase identifies any station-specific requirements such as hazardous location classifications, environmental exposure ratings, or radio frequency compatibility considerations. Talk to an expert about scheduling a site survey for your pump station inventory.
The AI platform uses a base model architecture trained on a large multi-utility pump failure dataset covering all common pump types — horizontal centrifugal, vertical turbine, submersible, and positive displacement — across sizes from 10 HP to 2,000 HP with varying operating conditions. When deployed at a new pump station, the base model is fine-tuned using a two-week data collection period during which the system establishes the normal operating baseline for each monitored parameter on each individual pump. The fine-tuning process adjusts the detection thresholds for vibration frequency bands, pressure ranges, flow rates, temperature gradients, and motor current harmonics to match the specific pump's manufacturer specifications, duty cycle, and operating environment. After the baseline period, the model runs in shadow mode for an additional two to four weeks — generating alerts in parallel without notifying the maintenance team — allowing the system to validate detection accuracy against any actual failures or maintenance events that occur during the validation period. Once the validation confirms the model is detecting genuine anomalies without excessive false positives, the system transitions to active alerting. Each pump maintains its own baseline profile, and the model adapts continuously as the pump ages and its operating conditions change. Book a Demo to see how the base model is configured and fine-tuned for a representative multi-pump-station deployment.
The false alarm filtering capability is one of the most critical design requirements for any condition monitoring system, and it is addressed through a multi-stage validation architecture. Stage one compares the detected anomaly against a transient event filter that recognises the signature of known non-failure events — pump start sequences, valve position changes, surge events, and power interruptions — and suppresses alerts during the transient period. Stage two applies a persistence threshold: the anomaly must be present for a configurable minimum duration, typically 3 to 5 consecutive measurement cycles, before it is elevated from an observation to a candidate detection. Stage three correlates the anomaly across multiple parameter types — for example, a bearing vibration spike that is not accompanied by a corresponding temperature rise or efficiency change is classified as lower confidence than one that produces correlated signals across vibration, temperature, and motor current. Stage four applies the pump's baseline profile: if the current vibration level is within the normal operating range established during the baseline period for the current flow rate and speed setting, the anomaly is filtered even if it would have triggered an alert at a different operating point. The combined effect of these four stages is a false positive rate below 2% in production deployments — the documented rate that restores maintenance team trust in the alert system. Talk to an expert about configuring the alert validation parameters for your pump station operating conditions and failure mode mix.
Alerts are delivered through the maintenance manager's preferred channel — the platform dashboard, email, SMS, or integration with the existing CMMS/work order system. Each alert contains the pump identification and station location, the detected failure mode (bearing degradation, seal wear, cavitation, check valve deterioration, or VFD anomaly), the confidence level of the detection expressed as a percentage, the estimated time-to-failure range in days, and the recommended maintenance action. The alert also includes a link to the correlated trend view showing the vibration spectrum, pressure trend, temperature rise, and efficiency change that triggered the alert, allowing the maintenance manager to validate the finding before creating a work order. For alerts that cross the emergency threshold — where the predicted failure is within 7 days or the confidence level exceeds 95% — the alert is escalated to the maintenance manager's mobile device with a critical priority designation. The platform generates the work order draft directly, including the recommended repair procedure, estimated labour hours, and required spare parts list with current inventory status. The maintenance manager reviews and approves the work order in the platform or forwards it to the CMMS for scheduling. Book a Demo to see the alert-to-work-order workflow in a live simulation using your pump station data parameters.
Calendar-Based Maintenance Misses 60% of Failure Signals. AI Catches Them 28 Days Before the Emergency. Get a Free Pump Station Reliability Assessment.
iFactory's AI pump station monitoring platform for maintenance managers — flow, pressure, and motor health analytics with failure mode detection, condition-based work order generation, and audit-ready condition monitoring records — all generated automatically from the sensor data your pump stations already need.