A water treatment plant operates 1,200 valves. A wastewater collection system has over 3,000. A district cooling facility manages 800 actuated valves across its distribution network. Each one is a potential leak path, a flow control failure point, or an isolation failure waiting to happen. The reliability engineer responsible for these assets faces a problem that no calendar-based PM programme can solve: a valve that stroked perfectly six months ago may today be suffering from seat erosion that bypasses 15 litres per minute, or an actuator whose torque has increased 22% from packing degradation — changes invisible to the technician who opens and closes it during a quarterly stroke test and pronounces it satisfactory. Valve failures account for approximately 36% of process incidents in infrastructure operations. The cost of a single failed isolation valve on a major water main or a stuck control valve on a building chiller system regularly exceeds ten times the cost of the valve itself in production disruption, emergency repair, and water loss. The reliability engineer who prevents these failures does not need more stroke tests. They need continuous visibility into the torque profile, stroke time trend, and seat leakage signature of every critical valve in the network.
Valve Predictive Maintenance · Actuator Monitoring · Stroke Analysis · Torque Trending · Seat Leakage · iFactory AI
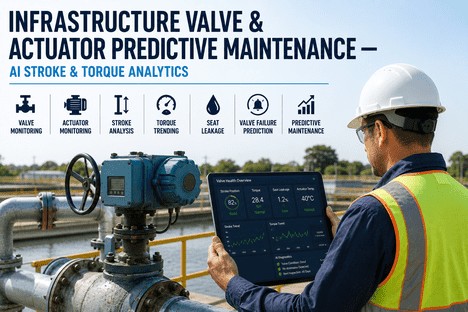
Your Valves Fail Slowly and Silently. iFactory Reads the Signs in Every Stroke, Torque Shift, and Seat Profile.
iFactory's AI-driven valve and actuator analytics platform monitors stroke time trends, torque profiles, seat leakage signatures, and actuator condition across water, wastewater, and building infrastructure — turning raw positioner and drive data into scheduled interventions before valves fail.
36%
Of process plant incidents trace to valve failures — seat leakage, stuck position, and actuator failure are the three most common root causes
10K-40K
Valves per typical infrastructure facility — each a potential failure point that calendar-based inspection misses because condition changes between quarterly stroke tests
22%
Torque increase from packing degradation is detectable through AI trend analysis 6-10 weeks before the valve becomes inoperable — yet most facilities never track torque
$99.6B
Global valve market in 2025 — as infrastructure ages and smart actuation adoption accelerates, predictive maintenance becomes the differentiator in valve reliability
The Failure Sequence — How Valves and Actuators Degrade Between Inspections
Valve failure is rarely a sudden event. It is a sequence of measurable changes — in torque, stroke time, seat leakage, and actuator response — that progresses over weeks or months before the valve becomes inoperable. The reliability engineer who tracks these four dimensions has continuous visibility into the condition of every critical valve in the network, independent of the quarterly stroke test schedule. iFactory's AI analytics platform monitors all four dimensions simultaneously, from data the valves and actuators already generate.
Torque and Thrust Trending
Torque required to seat the valve increases as packing friction, seat wear, and stem deposits accumulate — a 15-25% increase above baseline signals developing issues
Breakaway torque (the force required to initiate valve movement) rises before running torque in packing degradation — providing the earliest indicator
iFactory tracks torque profile curves per stroke, comparing each cycle to the baseline and flagging deviations in the top-of-stroke, mid-stroke, and seating zones
Detection Lead Time: 6-10 weeks before valve becomes inoperable
Full stroke time, open-to-close and close-to-open, is recorded per cycle and trended against the valve's established baseline — a 10% increase warrants investigation
Partial stroke time for critical valves is tracked separately — deviations in the first 20% of travel indicate actuator or positioner issues before the full stroke is affected
Asymmetric stroke time (fast in one direction, slow in the other) indicates specific failure modes — spring fatigue, diaphragm degradation, or actuator air supply issues
Detection Lead Time: 4-8 weeks before functional failure
Acoustic emission sensors mounted on the valve body detect the ultrasonic signature of fluid passing through a degraded seat — the most sensitive indicator of internal valve leakage
Downstream temperature monitoring identifies leakage in isolation valves — a temperature rise downstream of a closed valve indicates seat bypass that warrants investigation
Pressure decay rate across closed valves is trended over time — accelerating decay indicates progressive seat erosion that will eventually require intervention
Detection Lead Time: 8-16 weeks before leakage exceeds allowable limits
Actuator Health Monitoring
Air consumption trending for pneumatic actuators — increasing air usage indicates internal seal leakage, diaphragm degradation, or supply line issues developing gradually
Spring-return timing for fail-safe actuators — a slowing return stroke signals spring fatigue that could compromise fail-safe functionality in an emergency
Positioner calibration drift tracking — the frequency and magnitude of positioner corrections reveal developing control loop instability before it affects process performance
Detection Lead Time: 4-12 weeks before actuator failure or control degradation
Torque Profile · Stroke Trending · Seat Leakage · Actuator AI · Valve Fleet Analytics
Quarterly Stroke Tests Catch Failures After They Have Started. iFactory's Continuous Monitoring Catches the Degradation Trail Months Earlier.
iFactory ingests valve positioner data, actuator telemetry, and acoustic sensor streams to deliver continuous fleet-wide valve health visibility — detecting torque deviations, stroke time shifts, seat leakage progression, and actuator degradation before they become operational failures.
The Reliability Engineer's Valve KPI Framework — What to Measure Across Your Valve Fleet
A water utility with 2,000 valves or a building portfolio with 500 actuated valves cannot inspect its way to reliability. The following KPI framework converts continuous monitoring data into fleet-wide visibility — telling the reliability engineer which valves need attention today, which are degrading normally, and which have developed patterns that require root cause investigation.
Torque profile deviation — percent increase in breakaway, running, and seating torque compared to baseline per valve, per cycle
Stroke time trend — full stroke and partial stroke time comparison against baseline, asymmetric detection between open and close directions
Acoustic emission level at closed position — rising amplitude indicates progressive seat wear before leakage becomes measurable by flow or pressure methods
Pressure decay rate across closed isolation valves — accelerating decay trend signals seat erosion that requires planned intervention
Air consumption trend — litres per cycle increasing over time indicates internal seal leakage or diaphragm degradation in pneumatic actuators
Spring-return timing trend — slowing fail-safe stroke signals spring fatigue that compromises emergency shut-down functionality
Valve failure rate by type — butterfly vs. gate vs. ball vs. control valve breakdown reveals whether the issue is design-specific or installation-wide
Emergency vs. planned valve intervention ratio — target below 5% emergency for mature predictive programmes on critical valve classes
How iFactory's AI Platform Monitors Valves and Actuators Across Distributed Infrastructure
The platform is designed for the reliability engineer managing hundreds or thousands of valves across multiple sites, who needs a single pane of visibility into valve condition without deploying dedicated hardware to every asset. iFactory works with the data your infrastructure already generates.
01
Ingest Positioner Data
iFactory connects to smart positioners via HART, Foundation Fieldbus, or Profibus PA — reading position feedback, torque/force signals, and diagnostic data from every valve with a digital positioner installed. No additional sensors required for positioner-equipped valves.
02
Add Acoustic Sensors
For critical isolation and control valves without positioner data, iFactory integrates wireless acoustic emission sensors that detect seat leakage signatures through the valve body — non-invasive, surface-mounted, installed in under 15 minutes per valve.
03
AI Pattern Engine
The platform learns each valve's normal operating profile — torque range, stroke duration, seat leakage baseline, and cycle frequency. Deviations are classified by failure mode with a confidence score, and the asset is added to the corrective work order queue at the appropriate priority level.
A utility monitoring 2,000 valves across 12 sites can deploy iFactory's valve analytics module and begin receiving actionable alerts within 14 days of connecting the first positioner data stream — without a single site visit for sensor installation on positioner-equipped valves.
When a valve crosses the defined threshold for torque increase, stroke time elongation, or seat leakage amplitude, iFactory generates a work order in the CMMS with the asset ID, detected fault type, severity level, and recommended intervention timeline.
We manage 1,800 actuated valves across a water distribution system serving 400,000 connections. Before iFactory, our valve maintenance was entirely calendar-based — quarterly stroke tests on critical valves, annual exercise on the rest. The stroke tests told us a valve worked or it didn't, but gave us zero visibility into whether it was degrading between tests. The first three months of torque trending revealed that 12 of our 48 largest isolation valves had packing degradation accelerating at a rate that would have made them inoperable within two quarters. We repacked them during planned shutdowns instead of emergency excavations. The data did not add work to our schedule. It let us schedule the work that was already coming, on our terms.
— Reliability Engineer, Regional Water Utility — 1,800 Actuated Valves Across 12 Pump Stations and 4 Treatment Plants
Conclusion
Valves are the most numerous active components in infrastructure operations and among the least monitored. The quarterly stroke test that passes a valve today provides no information about whether that valve will pass again in three months — because seat erosion, packing degradation, and actuator wear are continuous processes that accelerate between inspections. The reliability engineer who moves from calendar-based valve testing to continuous condition monitoring gains the ability to see degradation as it happens, schedule interventions at the optimal point on the failure curve, and eliminate the emergency valve failures that drive the highest cost and operational disruption.
iFactory's AI-driven valve and actuator analytics platform is built for the reliability engineer who manages valve fleets across water, wastewater, and building infrastructure. It ingests positioner data, actuator telemetry, and acoustic sensor streams to deliver continuous visibility into torque profiles, stroke time trends, seat leakage progression, and actuator health — without requiring dedicated hardware on every valve. The platform converts the data your valves already generate into scheduled interventions before failure, at a fraction of the cost of emergency repair.
Book a Demo to see how iFactory's valve analytics platform maps to your infrastructure's valve fleet, or talk to an expert to discuss a pilot deployment across your most critical valve assets.
Frequently Asked Questions
Thirty-Six Per Cent of Infrastructure Incidents Trace to Valve Failure. iFactory Detects the Degradation Trail Months Before the Valve Fails.
iFactory gives every reliability engineer continuous visibility into the torque profile, stroke time trend, seat leakage signature, and actuator health of every critical valve in their network — turning positioner data and acoustic signals into scheduled interventions before emergency failure.