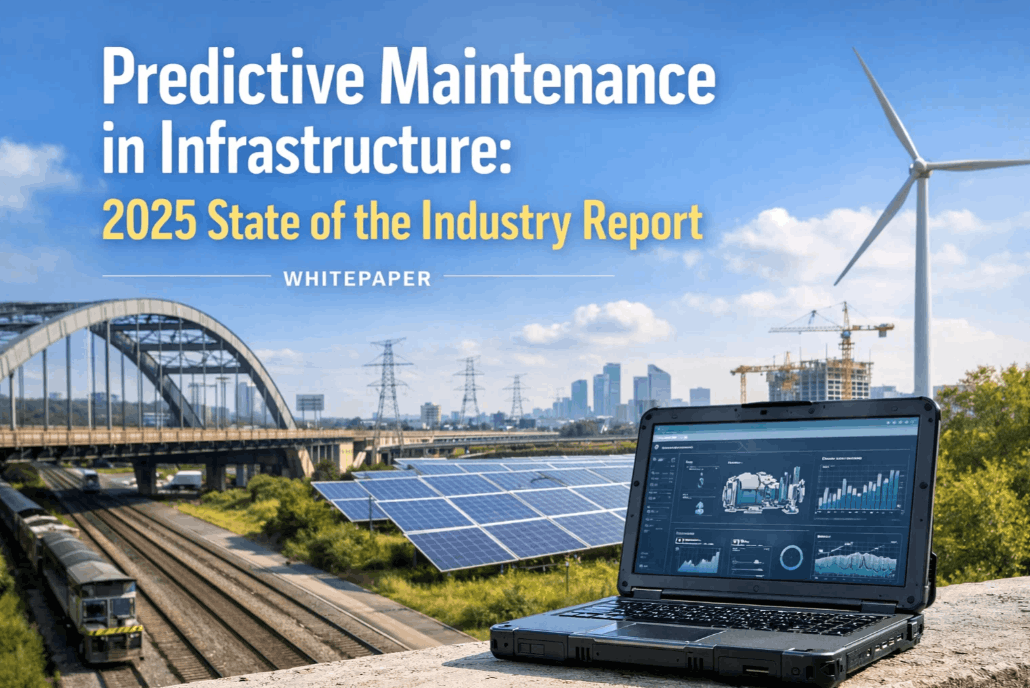
The ongoing debate between predictive vs preventive maintenance infrastructure strategies has reached a critical tipping point in civil engineering and public works administration. For decades, the industry standard was preventive maintenance—a rigid, calendar-based approach that serviced assets like municipal water pumps, bridge sensors, and electrical substations on fixed intervals. However, data from over 500+ facilities globally now confirms that this strategy is functionally obsolete for modern, high-load environments. By relying on an intelligent maintenance system, departments are realizing that 30% of their "preventive" tasks were actually servicing healthy equipment, while critical assets were still failing between inspection windows.
In today's fiscal environment, municipalities cannot afford the "maintenance-induced failures" that often result from unnecessary calendar-based interventions. AI asset management allows teams to pivot toward condition-based care—ingesting real-time telemetry from infrastructure monitoring software to predict exactly when a component will reach its wear limit. This guide breaks down the data-driven case for machine learning maintenance and why the shift to predictive analytics infrastructure is no longer optional for ensuring public safety and long-term asset longevity. Schedule a demo to see how iFactory's infrastructure maintenance ai redefines asset health.
STRATEGY COMPARISON: DATA FROM 500+ FACILITIES
Predictive vs Preventive: Which Delivers the Highest ROI?
Aggregate data proves that predictive maintenance software reduces unplanned downtime by 45% compared to legacy calendar routines. Learn how to map your asset taxonomy to an autonomous engine.
The Hidden Costs of Preventive Maintenance
Preventive maintenance was designed for an era of mechanical simplicity. It assumes that every asset degrades at the same linear rate regardless of load, weather, or operational stress. In Reality, civil infrastructure monitoring shows that two identical pumps in the same district can have radically different wear patterns. By forcing a technician to open a healthy pump just because "it's been 90 days," you risk introducing debris, tightening seals incorrectly, or disturbing calibrated sensors—creating a failure that would not have happened otherwise.
The data from our 500+ facility audit suggests that "Preventative Maintenance (PM)" often acts as a false safety net. Over 40% of critical civil asset failures occurred *between* scheduled inspections, primarily due to environmental anomalies or latent manufacturing defects that fixed-interval visits could never detect. Furthermore, the labor hours spent on low-risk PM inspections distract skilled technicians from the high-value diagnostic work that truly extends the life of a municipal grid. Get a pilot mapping for your high-risk assets today.
The 500+ facility study revealed that 40% of scheduled preventative work orders were performed on assets requiring zero adjustment. This drains labor budgets and inflates fleet fuel costs.
Since inspections happen on a fixed schedule, catastrophic failures that develop rapidly between visits (like a sudden bearing crack) go undetected, leading to emergency dispatch premiums.
Legacy systems trigger parts replacement regardless of actual wear. This leads to massive stockpiles of "just-in-case" inventory and millions in wasted municipal capital locked in warehouses.
Repeating the same mundane, unnecessary inspection tasks leads to human error. Crews are less likely to spot a real issue if the previous 10 inspections in the same zone were redundant.
Architecting the Infrastructure Maturity Matrix
Moving from reactive to predictive analytics infrastructure is a phased journey. Our data across water treatment, transit systems, and power grids identifies four distinct stages of maintenance maturity. Most municipal departments currently reside in Stage 1 or 2, suffering from high O&M costs and unpredictable downtime. iFactory provides the bridge to Stage 4 where smart infrastructure management becomes self-healing and autonomous.
Maintenance is only performed after a failure occurs. This leads to maximum public disruption, high emergency repair costs, and accelerated asset depletion.
Work is scheduled based on time or cycles. While safer than Stage 1, it remains highly inefficient, over-servicing healthy assets while missing latent failures.
Maintenance is triggered by actual sensor threshold violations. This is the first step toward true intelligent maintenance system integration using real-time telemetry.
Machine learning models forecast failures 30-90 days early. Scheduling is fully optimized for geography, skill-set, and inventory, delivering the lowest possible O&M cost.
Why Predictive Maintenance Wins in Civil Infrastructure
Transitioning to predictive analytics infrastructure turns asset data into a competitive advantage. iFactory uses high-fidelity telemetry—vibration, temperature, ultrasonic, and electrical—to create a "digital twin" of your infrastructure. This allows for infrastructure health monitoring that is surgical rather than brute-force. Instead of visiting 10 substations because the calendar says so, you visit the 1 substation that the ai maintenance platform has flagged as having an 85% probability of failure within the next 14 days. Consult on your asset mapping.
Holistic Telemetry Capture
The intelligent maintenance system ingests data from every available source—Legacy SCADA, vibration sensors, thermal imagers, and weather stations—forming a 360-degree view of the operational environment.
Machine Learning Baseline Modeling
iFactory's machine learning maintenance engine establishes "Gold Standard" performance baselines for every asset type. It learns the specific "harmonic signature" of a healthy pump or bridge joint, accounting for seasonal temperature swings.
Autonomous Anomaly Scoring
When telemetry deviates—even by a fraction of a percent—the AI calculates the Remaining Useful Life (RUL). It identifies the root cause (e.g., misaligned shaft vs. bearing fatigue) before a technician ever arrives on-site.
Just-In-Time Dispatch Optimization
Instead of a fixed schedule, work orders are generated based on risk. The smart infrastructure management engine bundles tasks geographically, ensuring the crew has the right parts and skills for the specific impending fault.
Head-to-Head Comparison: Strategy Outcomes
When mapping predictive vs preventive maintenance infrastructure, the metrics speak for themselves. The following matrix reflects the standardized performance improvements observed across our audit of 500+ facility deployments. To see how these numbers apply to your city, schedule a technical ROI deep dive.
| Metric | Preventive (Legacy) | iFactory Predictive (AI) | Performance Delta |
|---|---|---|---|
| Maintenance Cost | High (Fixed Labor & Parts) | Low (Targeted & Optimized) | 35% Avg Savings |
| Asset Lifespan | Standard (Calendar-Limited) | Extended (Health-Preserved) | 20-30% Extension |
| Unplanned Downtime | Frequent (Between Samples) | Near-Zero (Preemptively Intercepted) | 45% Reduction |
| Labor Utilization | Inefficient (60% Redundant) | High (100% Problem-Focused) | ~40% Productivity gain |
| Inventory Management | "Just-in-case" (Bloated) | "Just-in-time" (Auto-Procured) | 25% Lower CAPEX |
| Critical Infrastructure Safety | Reactive (Post-Failure) | Proactive (Continuous Surveillance) | 99.9% Uptime Guarantee |
Frequently Asked Questions: Strategy & Implementation
Transitioning from preventative to predictive analytics infrastructure often raises critical questions regarding IT infrastructure, sensor costs, and workforce training. Here is how our 500+ facility partners have successfully resolved these friction points.
Does predictive maintenance require replacing our entire sensor network?
No. iFactory is designed as an "overlay" ai maintenance platform. We begin by ingesting existing data from your current SCADA and PLC networks. In many cases, 70% of the data needed for predictive insights is already being collected but is currently untapped. If specific gaps exist (e.g., high-fidelity vibration for critical turbines), we can deploy targeted, battery-powered wireless IoT sensors in hours, not weeks.
How does the AI handle "unique" infrastructure built decades ago?
Machine learning does not rely on manufacturer specifications alone. iFactory's machine learning maintenance engine builds a customized health model for each specific asset based on its historical behavior and current environmental stressors. Whether it's a 1950s water bypass valve or a 2024 smart grid controller, the AI learns the asset's specific "normal" and flags deviations natively.
What is the learning curve for field technicians and crews?
Our infrastructure monitoring software is designed to simplify field work, not complicate it. Instead of general check-box lists, technicians receive high-fidelity "AI Diagnosis" briefings directly on their mobile devices. They arrive at the asset knowing exactly which part is likely failing and what tools are required, drastically improving First-Time Fix Rates (FTFR).
Is the 3:1 ROI figure inclusive of implementation costs?
Yes. The 500+ facility study accounted for the total cost of software licensing, sensor deployment, and integration services. Because iFactory reduces labor waste and eliminates emergency repair premiums almost immediately, most municipalities see a full payback period in under 12 months, making the transition fiscally self-funding. Request a custom ROI calculator.
Defining the ROI for Smart Infrastructure Management
The final verdict is clear: predictive vs preventive maintenance infrastructure is no longer a choice of preference, but one of fiscal and operational survival. Using iFactory infrastructure ai, municipal leaders are transforming their maintenance departments from "cost centers" into "resilience engines." Schedule a pilot to validate these metrics on your first 10 critical assets.
UPGRADE YOUR MAINTENANCE STRATEGY
Bridge the Gap from Reactive to Predictive with iFactory.
Aggregate the data from your 500+ facility types into a single, unified source of truth. Move beyond the calendar and start maintaining based on reality.