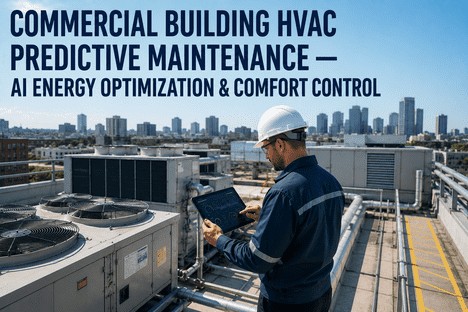
Commercial Building HVAC Predictive Maintenance — AI Energy Optimization & Comfort Control
By Grace on June 20, 2026
A commercial building is not a static structure. It is a mechanical organism. The chiller plant in the basement rejects heat from forty floors of office equipment, server racks, lighting, and human metabolism. The air handling units on every fifth floor push conditioned air through ductwork that branches into variable air volume boxes above each cubicle, each conference room, each corner office. The cooling tower on the roof evaporates water to shed the thermal load that began as body heat from the morning commute crowd. When one component in this system begins to degrade — a chiller compressor with worn bearings, an AHU supply fan with a slipping belt, a VAV damper actuator stuck at 30 percent open — the building compensates. It runs longer. It works harder. It consumes more energy. And the facility manager never knows until the monthly utility bill arrives with a number that does not make sense, or until a tenant on the 14th floor calls to report that the conference room has not cooled below 78 degrees for three days. HVAC systems consume 40 to 60 percent of total commercial building energy, and studies from Oak Ridge National Laboratory show that on any given day, 40 percent of air handling units and 30 percent of terminal units in commercial buildings operate with at least one measurable fault. The majority of those faults are invisible to the building management system because they do not trigger alarms. They simply waste energy and degrade comfort until they become emergencies.
Chiller Fault Detection · AHU Condition Monitoring · VAV Diagnostics · HVAC Energy Intelligence
40% of AHUs Have a Fault Right Now. 30% of VAV Boxes Are Wasting Energy. The Building Management System Does Not Know. AI Finds What the BMS Misses.
iFactory's AI-powered HVAC predictive maintenance platform connects to existing building automation systems and applies machine learning models trained on millions of equipment operating hours to detect chiller degradation, AHU faults, and VAV performance drift before they cause comfort complaints or energy waste. Built for facility managers who need to reduce HVAC energy spend, extend equipment life, and keep tenants comfortable without adding reactive maintenance headcount.
Of commercial building energy consumed by HVAC systems — making it the single largest operational expense in most facilities and the primary target for AI-driven efficiency
40%
Of air handling units in commercial buildings have at least one active fault on any given day — Oak Ridge National Laboratory study across 60,000+ HVAC equipment assets
$14K
Average cost of an unplanned HVAC shutdown event in commercial facilities — including emergency contractor premiums, temporary cooling or heating, and tenant disruption
18–25%
Maintenance cost reduction documented by commercial real estate portfolios deploying AI predictive HVAC maintenance — Deloitte study across multi-building deployments
The Three HVAC Systems That Drive 80 Percent of Energy Waste and Comfort Complaints
Chillers, air handling units, and variable air volume boxes form the backbone of every commercial HVAC system. Each has distinct failure modes, each produces detectable precursor signals before failure, and each is typically monitored by a building management system that records data without analysing it for degradation patterns. The facility manager managing a portfolio of buildings does not have the time to trend 12,000 BAS data points per building looking for the one AHU supply air temperature sensor that has drifted 2 degrees over six months. That is precisely the pattern that AI predictive maintenance detects automatically.
Chillers · AHUs · VAV Boxes — Degradation Patterns the BMS Does Not Catch
Chiller Plant
~50% of HVAC energy
Refrigerant loss: Gradual leak detected through compressor discharge temperature and superheat drift — increases energy consumption by 12-18% before affecting cooling capacity
Condenser fouling: Approach temperature rise signals fouling 4-6 weeks before chiller efficiency drops below acceptable threshold
Compressor wear: Vibration signature and motor current draw changes detectable 30-45 days before bearing failure or mechanical breakdown
Evaporator degradation: Leaving water temperature rise pattern distinct from load change signals tube fouling or refrigerant distribution issues
Air Handling Units
~25% of HVAC energy
Economator damper stuck: Fixed position regardless of outdoor conditions — wastes 8-15% of AHU energy by blocking free cooling when available
Sensor calibration drift: Supply air temperature or static pressure sensor drift causes controller to condition air to wrong temperature or pressure setpoint
Filter loading: Static pressure rise across filter bank increases fan energy consumption by 10-25% before change indicator alerts
Valve leakage: Chilled water or hot water valve leaking past closed position causes simultaneous heating and cooling energy waste
VAV Boxes
~15% of HVAC energy
Stuck damper: Actuator failure leaves damper in fixed position — stuck-open increases zone energy 30-40%, stuck-closed causes comfort complaints and ventilation code risk
Airflow sensor drift: Velocity pressure sensor clogging causes VAV controller to modulate based on inaccurate flow readings — BMS reports normal operation
Reheat coil failure: Hot water or electric reheat coil fails to activate — persistent heating complaints misdiagnosed as thermostat issues
Minimum position drift: Calibration drift over time causes VAV to deliver more or less minimum airflow than required by ventilation code
System Interaction Effect
Cross-asset impact
VAV drift forces chiller overproduction: When multiple VAV boxes demand more air than needed, the AHU fan speeds up and the chiller plant must produce additional cooling
AHU fault cascades to VAV performance: An AHU with faulty economizer or sensor delivers supply air at wrong temperature, forcing every downstream VAV to compensate
Compounded waste across the system: Multiple small faults at each level produce 25-40% total HVAC energy waste that no single fault alone explains
What AI HVAC Predictive Maintenance Detects That the BAS Cannot
Building automation systems are designed for control and alarming, not for degradation detection. They respond when a temperature exceeds a setpoint threshold or a pressure drops below a safety limit. By the time a BAS alarm triggers, the fault has already progressed to the point of occupant impact or equipment damage. AI predictive maintenance fills the gap between normal operation and alarm threshold — the zone where faults develop gradually, energy waste accumulates silently, and equipment degrades without any visible symptom that a human operator would notice. The difference between a well-maintained HVAC system and a degrading one is visible in the trend lines long before it appears in the alarm log. AI reads those trend lines continuously across every chiller, every AHU, and every VAV box in the building.
Fault Detection Capability
Chiller Plant Performance Degradation — Detected 4 to 6 Weeks Before Efficiency Collapse
Energy & Reliability
Chiller plants consume 30 to 50 percent of total HVAC energy in commercial buildings, yet most building automation systems provide only setpoint control and basic safety alarming. The AI model monitors condenser approach temperature, evaporator approach, compressor discharge superheat, oil pressure, motor current draw, and vibration across each chiller. When condenser approach temperature rises 2 degrees above its learned baseline, the model flags incipient fouling and estimates the energy impact in dollars per day of continued operation. When compressor discharge superheat trends downward over a 14-day window, the model alerts for refrigerant loss before the low-pressure alarm triggers. The facility manager receives not a raw data point but a prioritised maintenance recommendation: Chiller 2 condenser tubes require cleaning within 21 days. Expected energy recovery: $340 per month. This transforms chiller maintenance from calendar-based tube cleaning into condition-based intervention that captures 15 to 25 percent additional energy efficiency over fixed-interval programmes.
Approach temperature trend anomaly detection
Refrigerant loss precursor identification
Energy waste quantified in dollar terms
Fault Detection Capability
AHU Economator and Sensor Drift — The Faults That Waste 15 Percent of Fan Energy Without Any Alarm
Invisible Energy Waste
Oak Ridge National Laboratory's study of over 60,000 HVAC equipment assets found that 40 percent of air handling units had at least one active fault on any given day, and that many faults persisted for months or years without detection. The most common undetected AHU faults are economator damper malfunctions and sensor calibration drift. A stuck economator damper that fails to open when outdoor conditions are suitable for free cooling wastes 8 to 15 percent of the AHU's annual energy consumption. A supply air temperature sensor that has drifted 1.5 degrees causes the AHU controller to deliver air at the wrong temperature, forcing downstream VAV boxes to compensate with reheat energy. The AI model detects these faults by cross-correlating the AHU's actual behaviour against its expected performance baseline learned from the first 60 days of operation. When the economator damper position does not correlate with outdoor air enthalpy, or when the supply air temperature sensor reading diverges from the return air temperature trend under stable load conditions, the model generates a fault detection with the specific root cause, the quantified energy impact, and the recommended corrective action.
Economator position versus enthalpy correlation
Sensor drift detection against learned baselines
Valve leakage and simultaneous heating/cooling detection
Fault Detection Capability
VAV Box Fleet Diagnostics — Identifying the 10 Percent of Boxes Driving 70 Percent of Comfort Complaints
Comfort & Code Compliance
A single stuck-open VAV box damper can increase zone energy consumption by 30 to 40 percent, and buildings with hundreds of boxes typically have 20 to 30 percent operating with at least one undetected fault. The AI model monitors every VAV box in the building for damper position versus commanded position correlation, airflow sensor feedback accuracy, reheat coil activation timing, and minimum position compliance with ventilation code requirements. When a VAV box damper position reads 45 percent when the BAS commands 72 percent, the model identifies actuator degradation or mechanical binding before the damper sticks completely. When a zone's airflow sensor reading diverges from the calculated expected airflow based on damper position and duct static pressure, the model flags sensor calibration drift. Each VAV box is assigned a health score from 0 to 100, and the facility manager sees the entire fleet ranked by maintenance priority — from the boxes that need immediate attention to those that are operating within normal parameters. This transforms VAV maintenance from a reactive response to comfort complaints into a proactive programme that fixes faults before tenants notice them.
Per-box damper position accuracy monitoring
Airflow sensor calibration drift detection
Fleet-wide health score ranking
Chiller Health Monitoring · AHU Fault Detection · VAV Diagnostics · Portfolio-Wide HVAC Intelligence
The Building Management System Records Data. AI Interprets It. The Facility Manager Acts on It. The Difference Is 15 to 25 Percent Lower HVAC Energy Costs and 50 Percent Fewer Emergency Calls.
iFactory's AI HVAC predictive maintenance platform connects to existing BAS infrastructure via BACnet, Modbus, or API — deploying pre-trained fault detection models for chillers, AHUs, and VAV boxes without requiring control system modifications. The facility manager receives prioritised fault detections with quantified energy impact and recommended corrective actions, not raw sensor data.
The dashboard is designed around the operational decisions that determine whether the HVAC portfolio is optimised or degrading. It aggregates data from every chiller, every AHU, and every VAV box across the entire building portfolio into a single view where the facility manager sees system health, energy performance, and maintenance priority at a glance. The goal is not to display more data. It is to surface the specific faults that need attention, the specific assets that are wasting energy, and the specific actions that will restore performance.
AHVAC System Health Score
A single composite score for the entire HVAC system derived from individual chiller, AHU, and VAV box health scores. The score is calculated from the number and severity of active faults, energy efficiency deviation from baseline, and maintenance compliance status. A score trending downward over multiple weeks signals developing system-level degradation that requires investigation before it manifests as tenant complaints or emergency repairs. The facility manager can see at a glance whether the HVAC portfolio is improving or declining and drill into any asset group to identify the specific systems driving the trend.
BChiller Plant Efficiency View
Real-time chiller plant efficiency in kW per ton with trend lines for each chiller and the plant as a whole. The expected efficiency envelope is overlaid on the actual performance data, and any chiller operating outside its expected envelope is flagged with the estimated energy waste in dollars. The view includes condenser approach temperature, evaporator approach, compressor discharge superheat, and motor current draw for each chiller — enabling the facility manager to identify which chiller needs maintenance attention and what type of intervention is required, without reviewing chiller control panel data manually.
CAHU Fault Summary and Prioritisation
Every AHU in the portfolio displayed with current fault count, fault types, estimated energy waste from active faults, and maintenance priority. The prioritisation algorithm ranks AHUs by the combined impact of their active faults on energy consumption and comfort — so the facility manager addresses the AHU that is wasting $600 per month with a stuck economator before the AHU that has a minor sensor drift costing $80 per month. Each fault detection includes the supporting data trace, the estimated root cause, and the recommended corrective action, enabling the maintenance team to prepare the correct parts and tools before the service visit.
DVAV Box Fleet Condition Map
Every VAV box plotted on a floor plan or listed with health score, current fault status, and maintenance priority. Boxes with stuck dampers, sensor drift, or reheat coil failures are colour-coded by severity and ranked by their impact on zone comfort and energy consumption. The fleet view enables the facility manager to identify floors or zones with multiple degraded boxes and schedule consolidated maintenance visits rather than responding to individual faults as they are discovered. A single technician visit to address five VAV faults on the same floor replaces five separate reactive service calls.
EEnergy Waste Attribution Report
A portfolio-wide report that attributes total HVAC energy waste to specific causes: economator faults contributing 18 percent of total waste, chiller degradation contributing 32 percent, VAV faults contributing 22 percent, and control strategy issues contributing 28 percent. Each category is broken down by building and by specific asset, enabling the facility manager to allocate maintenance investment to the categories that deliver the highest energy recovery. The report updates automatically as faults are detected and as corrective actions are completed, providing a measurable feedback loop between maintenance activity and energy performance.
FMaintenance Verification and Impact Tracking
After each maintenance intervention — a chiller tube cleaning, a VAV damper actuator replacement, an AHU economator repair — the dashboard tracks the measured recovery in energy efficiency, equipment health score, and zone comfort. The facility manager sees whether the intervention achieved the expected improvement, whether the energy waste has been eliminated, and whether any secondary issues were uncovered during the work. This closed-loop verification ensures that maintenance investment is producing measurable results and that recurring faults are identified before they become chronic problems.
We manage a portfolio of seven commercial office buildings with a combined 1.2 million square feet. Our BAS generates thousands of data points per building per day, but we were only using it for setpoint control and alarm management. We did not have a single person on staff whose job was to trend and analyse BAS data for degradation patterns. The AI platform connected to our existing BAS infrastructure and within the first 30 days identified 14 active faults across the portfolio that we did not know existed — including two chiller condenser fouling issues, five AHU economator faults, and seven VAV boxes with stuck dampers or sensor drift. The estimated annual energy waste from those 14 faults was approximately $47,000. We repaired all of them within six weeks at a total cost of $8,200. The energy savings paid for the repair cost in three months, and the platform continues to detect new faults before they compound. Our tenants stopped calling about temperature issues on the floors where we fixed the VAV boxes, which was a benefit we had not quantified in the initial ROI calculation but turned out to be the most valued outcome from our property management team's perspective.
— Facility Manager, Commercial Real Estate Portfolio — 1.2 Million Square Feet, 12 Years
Conclusion
Commercial building HVAC systems consume 40 to 60 percent of total facility energy, yet the tools most facility managers have to monitor these systems were designed for control, not for degradation detection. The building automation system records temperature, pressure, flow, and status data from every chiller, every air handling unit, and every VAV box in the building. That data contains the signatures of incipient faults — a condenser approach temperature that has risen half a degree per month for six weeks, a VAV damper position that does not match its commanded setpoint, an AHU supply air temperature sensor that has drifted 1.2 degrees from its sister unit on the adjacent floor. But the BAS does not analyse these patterns because it was not designed to. It was designed to execute control sequences and trigger alarms when hard limits are exceeded. By the time a BAS alarm confirms a fault, the fault has already been wasting energy for weeks or months and may have already caused equipment damage that could have been avoided with earlier detection.
iFactory's AI-powered HVAC predictive maintenance platform fills that analytical gap. It connects to existing BAS infrastructure through standard protocols, learns the normal operating envelope of every chiller, AHU, and VAV box in the building, and continuously monitors for deviations that signal developing faults. When a fault is detected, the platform does not simply generate an alarm. It identifies the root cause, quantifies the energy impact in dollars, recommends the corrective action, and routes the information to the maintenance management system as a prioritised work item. The facility manager shifts from reacting to tenant complaints and emergency repairs to managing a portfolio of HVAC assets whose faults are detected, diagnosed, and resolved while they are still small.
Talk to an expert about deploying AI HVAC predictive maintenance across your commercial building portfolio, or book a demo to see the HVAC health dashboard configured for your building's specific equipment inventory and BAS environment.
Frequently Asked Questions
The platform connects to existing BAS infrastructure through standard building automation protocols including BACnet/IP, Modbus TCP, and LonWorks. For buildings with a BAS that supports API access, the platform can connect directly through the BAS vendor's API. For buildings with restrictive BAS access policies or older systems that do not support modern protocols, the platform deploys a read-only IoT gateway that reads BAS points without modifying the control system configuration. The gateway approach requires no changes to existing controller programming, no network reconfiguration that could affect control system reliability, and no BAS vendor involvement beyond initial point discovery. All connection methods are read-only — the platform monitors BAS data but never writes to control points, ensuring that the existing control logic and safety interlocks remain fully intact regardless of the platform's operating status. The platform also supports CSV and SQL historian import for buildings where direct BAS connection is not feasible. The initial integration typically takes one to three days per building for direct BAS connection or one to two weeks if a gateway installation is required. Talk to an expert to review your building's BAS configuration and determine the optimal connection method.
The minimum data set varies by equipment type. For chillers: condenser leaving water temperature, evaporator leaving water temperature, refrigerant suction and discharge pressures, compressor motor current draw, and chiller status (on-off). For air handling units: supply air temperature, return air temperature, mixed air temperature, outdoor air temperature, cooling valve position, heating valve position, outdoor air damper position, supply fan status, supply fan speed (if VFD controlled), and supply duct static pressure. For VAV boxes: zone temperature, airflow setpoint and actual airflow (if measured), damper position command and feedback, and reheat valve position. Most commercial building BAS installations already trend 80 to 90 percent of these data points through their standard configuration. The platform begins generating usable fault detection insights within approximately 30 days of data ingestion, with detection accuracy improving as the model learns each building's specific operating patterns and equipment characteristics. Book a demo to review the data point checklist for your building's specific HVAC equipment configuration.
Yes. The platform is vendor-agnostic and has been deployed across buildings with Siemens Desigo, Johnson Controls Metasys, Honeywell, Schneider Electric EcoStruxure, Automated Logic WebCTRL, Delta Controls, Tridium Niagara, Distech, ALC, and other major BAS platforms. Each building's data is ingested into the same platform regardless of BAS vendor, enabling portfolio-wide fault detection, energy benchmarking, and maintenance prioritisation across buildings with different control systems. For portfolios with mixed BAS vendors, the platform provides a consistent fault detection methodology and reporting framework across all buildings — so the facility manager can compare chiller efficiency between a building with a Siemens BAS and a building with a Johnson Controls BAS using the same metrics and the same detection models. The platform also handles buildings within the same portfolio that have different levels of BAS instrumentation, applying appropriate fault detection models based on the available data points for each building. Talk to an expert to discuss how the platform would be deployed across your specific portfolio's BAS landscape.
ROI varies by portfolio size, existing maintenance practices, and HVAC equipment condition, but documented returns across commercial real estate deployments show a consistent pattern. Energy savings from corrected faults typically range from 8 to 20 percent of total HVAC energy consumption. For a 200,000-square-foot office building spending $180,000 annually on HVAC energy, that is $14,400 to $36,000 per year in recovered energy. Avoided emergency repair costs add significant additional value — a single chiller breakdown avoided through early refrigerant loss detection can save $15,000 to $45,000 in emergency repair premiums, temporary cooling costs, and tenant disruption claims. Extended equipment life from condition-based maintenance adds further value, with documented compressor and fan motor life extensions of 20 to 40 percent when maintenance is performed based on actual condition rather than fixed calendar intervals. Combined across these three value streams, documented deployments on commercial office buildings from 100,000 to 500,000 square feet show simple payback periods of 6 to 14 months with ROI ratios of 5:1 to 15:1 within the first three years. Book a demo to generate an ROI projection based on your portfolio's specific square footage, HVAC equipment inventory, energy consumption, and historical repair costs.
40% of AHUs Have a Fault Right Now. Your BAS Does Not Know. AI Detects What the Building Management System Misses — Before Energy Waste Compounds and Tenants Complain.
iFactory's AI-powered HVAC predictive maintenance for commercial buildings — chiller fault detection, AHU economator and sensor diagnostics, VAV box fleet health monitoring, and portfolio-wide energy waste attribution. Built for facility managers who need to reduce HVAC operating costs and keep tenants comfortable without adding headcount.