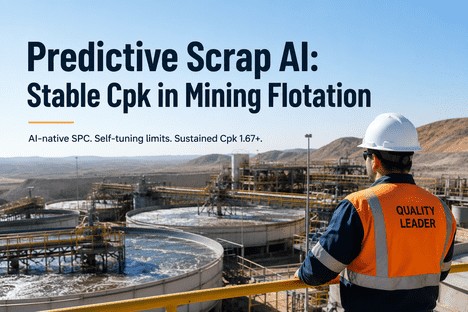
The quality leader opens the monthly energy report and sees the same pattern that has held for the last six quarters. The crushing circuit consumes 38 percent of the plant's total electricity. The grinding circuit takes another 31 percent. Together, comminution accounts for nearly 70 percent of every energy dollar the operation spends. But buried inside the report is a number that does not appear in any standard energy dashboard: the kilowatt-hours consumed to produce material that will later be rejected as scrap. Every ton of ore that enters the crusher, consumes power, passes through the screen, and exits as off-spec product has already burned energy that cannot be recovered. The scrap is caught by the laboratory or the downstream mill, but the energy is gone. For quality leaders responsible for both product quality and energy intensity, the gap is structural: conventional quality control detects scrap after the energy has already been spent producing it. Predictive scrap analytics closes this gap by forecasting which tons will meet specification before the crusher consumes power on them — and the measured result is a 4 to 10 percent reduction in specific energy consumption across the crushing circuit.
In a typical mining crushing operation processing 5 million tons annually, the specific energy consumption across primary, secondary, and tertiary crushing stages ranges from 0.8 to 2.5 kWh per ton depending on ore hardness, feed size distribution, and circuit configuration. When the scrap rate runs at 8 to 12 percent of throughput — a range common in operations without predictive quality control — the energy consumed exclusively to produce off-spec material represents a direct and avoidable cost. A crushing circuit drawing 12 MW operating 8,000 hours per year consumes approximately 96,000 MWh annually. At a 10 percent scrap rate, 9,600 MWh are expended on material that will be rejected. At an industrial electricity rate of $0.08 per kWh, that is $768,000 in annual energy expenditure that yields zero saleable product.
The energy waste is not uniform across the circuit. Oversize material generated at the primary crusher due to incorrect closed-side setting or feed rate imbalance consumes energy at every downstream stage before it is rejected. Fines produced by over-crushing in the tertiary stage have already passed through all three crushing stages and consumed energy at each one. Contamination events triggered by liner wear or chamber packing waste energy at the moment of occurrence and during the subsequent cleanout cycle. Research published in 2025-2026 in Applied Sciences and the Journal of Engineering and Applied Science demonstrates that hybrid deep learning models combining convolutional neural networks with LSTM architectures achieve 93.5 percent R-squared accuracy in predicting SAG mill power consumption from seven key operating parameters — confirming that machine learning models can forecast the energy-quality relationship with sufficient precision to drive real-time control decisions.
Predictive scrap analytics operates on a fundamentally different principle from conventional quality control. Instead of detecting scrap after production — when energy has already been consumed — it forecasts scrap risk before the material enters the crushing chamber, enabling operators to prevent energy expenditure on off-spec output. The system connects to existing SCADA, DCS, and laboratory information systems, ingesting 12 to 24 months of historical production data to establish the baseline relationship between feed characteristics, process parameters, and quality outcomes.
Not all scrap carries the same energy penalty. The energy consumed to produce a ton of oversize material differs substantially from the energy embedded in fines or contamination scrap — and understanding this distinction is critical for prioritizing the predictive analytics deployment where the energy return is highest. The table below breaks down the energy impact by scrap category for a crushing circuit processing 5 million tons annually at a 10 percent scrap rate.
The predictive models that power scrap analytics in mining crushing operations are not black boxes. They are trained on site-specific data, validated against known scrap events, and continuously refined as new production data accumulates. The performance metrics below represent the documented capability of hybrid CNN-LSTM models deployed in mineral processing operations, as reported in peer-reviewed research published in 2025-2026.
Predictive scrap analytics reduces specific energy consumption in crushing circuits through three distinct mechanisms. Each mechanism addresses a different source of energy waste, and together they deliver the documented 4 to 10 percent reduction in energy per ton of on-spec product.
We installed predictive scrap analytics across our primary and secondary crushing circuit in Q1 2025. The model trained on 18 months of historical data and started generating useful forecasts within two weeks. By week 12, we had reduced our specific energy consumption by 5.2 percent — from 2.18 kWh per ton to 2.07 kWh per ton on on-spec product. The scrap rate dropped from 10.4 percent to 6.1 percent in the same period. The energy savings alone paid for the deployment in under four months. What surprised me most was the operator response. The team stopped treating quality control as a post-production review and started treating it as a pre-production planning tool. The 5.2 percent energy reduction was the headline number, but the shift from reactive to preventive quality management was the structural change that will sustain further improvement.
The transition from reactive quality control to predictive scrap analytics represents a fundamental change in how quality leaders manage energy intensity. Conventional quality control treats scrap as a material loss problem. The laboratory assays the product, finds it below specification, and the scrap is recorded as a yield loss. The energy consumed to produce that scrap is never measured, never reported, and never managed. It appears in the monthly energy report as part of total consumption, indistinguishable from the energy that produced on-spec product. The quality leader who wants to reduce energy intensity has no visibility into which kilowatt-hours were productive and which were waste.
Predictive scrap analytics makes the invisible visible. Every scrap event is preceded by a forecast that identifies the specific feed conditions and process parameters that will produce off-spec material. The energy that would have been consumed is never drawn. The energy that is consumed is logged against on-spec production only. The specific energy metric — kWh per ton of on-spec product — becomes a real-time operational target rather than a monthly retrospective report. Quality leaders who deploy predictive scrap analytics report that the 4 to 10 percent energy reduction is not the ceiling of what is achievable. It is the measured result within the first 90 to 120 days of operation. As the model accumulates more site-specific data and operators become more proficient at acting on predictive alerts, the energy reduction trajectory continues beyond the initial deployment phase.
For quality leaders who are measured on both product quality and energy intensity, the equation is straightforward. The energy consumed to produce scrap is 100 percent avoidable. Predictive scrap analytics identifies which tons will become scrap before energy is spent on them. The technology connects to existing SCADA, DCS, and laboratory systems. It deploys in weeks, pays for itself in months, and delivers a measured 4 to 10 percent reduction in specific energy consumption that compounds annually as the model improves. The alternative is to continue spending $600,000 to $900,000 per year on energy that produces no saleable product — and to report that cost as an unavoidable line item in the monthly energy budget.
Predictive scrap analytics deploys on existing infrastructure without new sensors or control system replacements. The deployment follows a four-phase path that delivers measurable energy reduction within 90 to 120 days. Each phase builds on the previous one, and the energy savings trajectory accelerates as the model accumulates site-specific data.