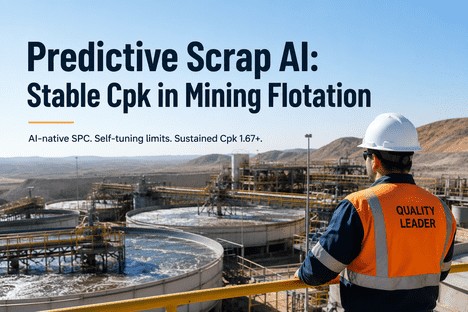
The concentrate grade report from last night's rougher circuit shows 28.4% copper — 1.6 points below the contractual specification minimum. The metallurgical assay confirming the result arrives six hours after the shift. By the time you identify the reagent dosage excursion that caused the drop, the affected concentrate has already been blended into the outbound stockpile. The scrap is not recoverable. The customer penalty clause triggers. And your Cpk for the week — which was holding at 1.71 on Monday — closes at 1.24. The investigation opens. The team reconstructs the reagent addition sequence, the froth depth readings, the pH logs. The root cause is clear in hindsight: a collector dosage spike at 02:15 compounded by a froth depth that was running high all shift. Both were visible in the process data. Neither generated an alert before the grade dropped below specification. This is the core failure of reactive quality management in flotation: the scrap risk existed in the process data hours before the grade failure occurred. Predictive scrap analytics finds it in time to act.
ML Scrap Forecasting · Self-Tuning SPC · Grade-Recovery Optimisation · Audit-Ready Records
Flotation Scrap Risk Exists in Your Process Data Hours Before the Grade Fails. Predictive Analytics Finds It First.
iFactory's predictive scrap analytics engine ingests 60+ flotation process variables in real time, forecasts concentrate grade and recovery risk hours ahead, and alerts quality leaders before the first off-spec tonne leaves the cell — sustaining Cpk 1.67+ across every shift.
1.67+
Cpk target for Six Sigma process capability in flotation — achievable only when scrap risk is forecast before it becomes off-spec concentrate
60+
Process variables in a flotation circuit driving grade and recovery — pH, reagent dosage, air flow, froth depth, pulp density, feed grade, and more
30%
Downtime reduction and yield improvement reported by mining operations using predictive analytics for process quality control in mineral processing
2–6 hrs
Typical lead time that predictive scrap analytics provides before a concentrate grade failure — the intervention window that reactive monitoring never opens
Why Flotation Is the Hardest Quality Control Problem in Mining Processing
Froth flotation separates valuable minerals from gangue through a sequence of physicochemical interactions that involve at least three independent variable groups operating simultaneously: feed attributes (particle size distribution, ore grade, mineralogy, and feed rate), physicochemical influences (reagent types and dosage sequences, pH, temperature, and water quality), and hydrodynamic factors (air flow rate, froth depth, cell design, and agitation). Each group contains multiple controllable and uncontrollable variables. Grade and recovery — the two KPIs that define whether you have scrap or product — are the aggregate output of all of them interacting at once. No single parameter alarm tells a quality leader whether tonight's concentrate will make specification. Only a model that correlates all groups simultaneously can forecast that with enough lead time to intervene.
The Three Variable Groups That Drive Scrap in Flotation — and How AI Reads Them Together
Group A — Feed
Ore Characteristics and Feed Variability
Feed grade, particle size distribution, mineralogy, and liberation degree all shift as the mine face advances through different ore zones. A 2% increase in head grade with unchanged reagent dosage produces froth instability and gangue entrainment in the concentrate — driving grade down even when every controllable parameter is on setpoint. Quality leaders cannot control feed variability, but predictive analytics can quantify its impact on forecast grade and adjust intervention thresholds accordingly.
Head grade and particle size tracking
Feed rate fluctuation correlation
Mineralogy-linked reagent demand forecast
Group B — Chemical
Reagent Dosage, pH, and Water Chemistry
Collector dosage determines mineral hydrophobicity — too little and recovery falls, too much and gangue enters the concentrate reducing grade. Frother dosage controls bubble size and froth stability — excess frother produces over-stable froth that carries gangue. pH governs the surface chemistry of both the target mineral and the gangue. Water quality variation changes the effective concentration of every reagent in the circuit. The interactions between these variables are nonlinear and shift with every ore type change.
Collector-to-grade correlation tracking
pH deviation and recovery impact model
Reagent interaction pattern detection
Group C — Hydrodynamic
Air Flow, Froth Depth, and Cell Dynamics
Air flow rate determines bubble quantity — too few bubbles cut recovery, too many produce coarse froth that disrupts mineral attachment. Froth depth controls the cleaning effect: a deep froth layer improves grade by allowing drainage of entrained gangue, but reduces recovery. Froth velocity and froth colour are observable proxies for metallurgical performance. A stable froth phase is the single most important condition for achieving high grade and recovery simultaneously — and its instability precedes a grade failure by 1 to 4 hours.
Air flow and bubble size anomaly detection
Froth depth trend and grade correlation
Froth stability index — real-time
Grade Forecast · Recovery Prediction · Scrap Risk Alert · SPC on 60+ Variables
When Grade Falls in the Rougher, the Signal Was in the Reagent Data Two Hours Ago. AI Reads It. You Intervene.
iFactory's ML model correlates all three flotation variable groups simultaneously — producing a real-time grade and recovery forecast that quality leaders can act on, not a post-event explanation of what went wrong.
How Predictive Scrap Analytics Works in a Flotation Circuit
The system operates as a continuous analytical layer over the flotation circuit data — ingesting process historian data, online analyser readings, and reagent dosing logs in real time, and producing a forward-looking scrap risk assessment that updates every few minutes. The output is not a dashboard of 60 variables — it is a ranked risk finding that tells the quality leader which parameter combination is driving forecast scrap risk, how confident the model is, and what intervention is recommended.
Every Process Variable — Unified Into One Predictive Model
Process historian data (DCS/SCADA), online elemental analyser readings for head grade and concentrate grade, reagent dosing flow rates, air flow per cell, froth depth measurements, pH sensors, pulp density readings, and feed tonnage are all ingested continuously. The ML model maintains a rolling feature window — typically 30 to 120 minutes of history — across all variables simultaneously. This is the data set that manual quality review reads in retrospect. Predictive analytics reads it in real time.
Predicted Concentrate Grade — 2 to 6 Hours Ahead
The ML model produces a predicted concentrate grade for the next 2 to 6 hours based on current process variable patterns and their historical relationship to assay outcomes. This forecast updates every 5 to 10 minutes as new sensor readings arrive. When the forecast grade approaches the specification minimum, the system generates a pre-emptive alert — giving the quality leader a specific time window to intervene before the forecast becomes an actual grade failure. The forecast includes the confidence interval and the top-ranked process variables driving the predicted outcome.
Ranked Alert — What Is Driving the Risk and What to Adjust
When scrap risk exceeds a configured threshold, the alert delivered to the quality leader is not a list of flagged sensors. It is a ranked finding: the top 3 process variables most correlated with the forecast grade degradation, the direction and magnitude of their drift from optimal, and the recommended corrective adjustment for each. The quality leader sees: "Predicted grade at 28.1% in 3 hours. Primary driver: collector dosage trending 12% above optimal for current head grade. Secondary: froth depth elevated in rougher bank 2." The intervention is specific and immediate.
Continuous Cpk on Grade and Recovery — Not Monthly Batch Reports
Cpk is calculated continuously on concentrate grade and recovery against the specification limits — updated with every assay result and forecast value. Quality leaders see the live Cpk trend, the projected Cpk at current trajectory, and the control limit breach forecast. Self-tuning SPC limits adjust dynamically to current ore type and reagent regime — eliminating the false alarm flood that static limits generate every time the ore zone changes. The system distinguishes between common-cause variation that reflects normal flotation behaviour and assignable-cause events that require a quality leader response.
The Cpk Playbook: What Quality Leaders Do Differently With Predictive Analytics
Sustaining Cpk 1.67+ in flotation is not a daily target — it is a continuous operating condition that requires different quality management behaviours from shift to shift. Predictive scrap analytics changes three specific things about how quality leaders manage the circuit.
1
Shift Handover Changes From Report Review to Live Risk Review
Reactive quality management begins each shift by reviewing what happened on the previous shift. Predictive quality management begins each shift by reviewing the current scrap risk forecast for the next 4 to 6 hours. The incoming quality leader sees the grade forecast, the current Cpk trend, the top scrap risk drivers, and any reagent or feed anomalies already developing. The handover conversation changes from "grade dropped at 03:00, we adjusted collector" to "the model is flagging elevated froth depth in bank 3 — we need to reduce air before the next hour's assay."
Before: Review the previous shift's failures. After: Review the current shift's risks before they become failures.
2
Ore Zone Transitions Are Managed Proactively, Not Reactively
Every flotation circuit faces ore zone transitions that change the reagent demand profile — harder ore requires more collector, higher clay content destabilises froth, changing mineralogy alters the grade-recovery trade-off. Reactive quality management detects the ore zone change when the assay returns a grade failure. Predictive analytics detects it when the feed characteristics begin to shift — 2 to 4 hours before the grade consequence arrives — enabling the quality leader to authorise a pre-emptive reagent adjustment that maintains Cpk through the transition rather than recovering it after.
Before: Adjust after the grade drop. After: Authorise adjustment when the feed shift is detected — before the grade drop.
3
Reagent Cost Is Optimised Against Grade Risk, Not Set by Fixed Schedule
Fixed reagent dosage schedules optimise for average conditions. Real flotation circuits are never at average — they are always above or below average on multiple variables simultaneously. Predictive analytics identifies when current process conditions allow reagent dosage reduction without grade risk — and when they require increase before the grade risk materialises. Quality leaders who use this capability report reagent cost reductions of 8 to 15% while simultaneously improving grade Cpk, because they are dosing to the actual process state rather than the average schedule.
Before: Fixed dosage schedule regardless of current process state. After: Dynamic dosage guided by the grade risk forecast.
4
Audit Evidence Is Generated Automatically — Not Assembled Under Pressure
Every scrap risk event, every alert generated, every quality leader action, and every process variable state at alert time is logged automatically with a timestamp. The resulting audit trail shows not just what happened to grade and recovery, but what the predictive system detected, when the alert was issued, and what intervention was taken. This is the documentation that ISO 9001 corrective action requirements demand and that customer quality audits seek — produced automatically without manual incident reporting, and searchable across any date range or event category.
Before: Manual incident log assembled from shift notes. After: Automated timestamped audit trail per event, exportable on demand.
"
We had six off-spec concentrate events in a quarter — all of them traced in hindsight to reagent dosage excursions that were visible in the DCS data for two to four hours before the assay confirmed the grade failure. We were running reactive quality control on a process that gives you a two-to-four-hour warning if you know how to read it. The predictive analytics platform reads it. In the seven months since deployment, we have had one off-spec event — and in that case, the alert fired correctly, the recommended adjustment was made, but the ore zone was changing faster than the model had seen before. The model was retrained. The Cpk for the quarter was 1.74.
— Quality Assurance Manager, Copper Concentrator — Sulphide Flotation Circuit, 25,000 tpd Operation
How Predictive Scrap Analytics Compares to Reactive Quality Control Across a Full Year
The cumulative difference between predictive and reactive quality management in flotation is not visible in a single shift — it accumulates across quarters and production years as prevented scrap events, lower reagent costs, fewer customer penalty events, and a Cpk that holds above 1.67 even through ore zone transitions and seasonal feed variability.
Quality Outcome
Reactive Quality Control
Predictive Scrap Analytics
Off-spec concentrate events
6–12 per quarter — detected at assay, after concentrate is committed to stockpile
0–2 per quarter — prevented by early intervention on forecast risk before grade falls
Cpk consistency
Cpk fluctuates 1.1–1.8 across ore zones — static limits miss transitions, dynamic events produce uncontrolled drops
Cpk holds 1.67–1.85 — self-tuning limits adapt to ore zone changes, interventions prevent drops before they develop
Reagent cost
Fixed schedule dosage — over-dosed during stable ore periods, under-dosed during transitions
Dynamic dosage guided by grade risk forecast — 8–15% reagent cost reduction while improving Cpk
Customer penalty exposure
Unpredictable — penalty events tied to assay cycle, not process events
Managed — forecast alerts allow hold or diversion decisions before off-spec concentrate reaches blending
Audit evidence quality
Manual incident logs assembled after events — incomplete, inconsistent, difficult to defend
Automated timestamped event record — every alert, intervention, and outcome documented and exportable
Conclusion
Flotation is the most variable and the most consequential process in the mineral processing value chain. Grade and recovery determine whether the ore you mined and ground at significant cost becomes revenue or becomes scrap. The variables that drive that outcome are not opaque — they are in the process data, visible in the reagent dosing logs, the froth depth readings, the pH trends, and the air flow records. The problem is not that the data does not exist. The problem is that by the time a quality leader reads it reactively, the off-spec concentrate is already in the stockpile.
Predictive scrap analytics changes this by reading the same data proactively — correlating 60+ process variables across all three flotation variable groups simultaneously, forecasting grade and recovery 2 to 6 hours ahead, and alerting the quality leader with a specific, ranked intervention recommendation while the intervention is still possible. The result is not marginal improvement — it is a structural change in the quality management model: from responding to grade failures to preventing them, from managing Cpk through corrective action to sustaining it through continuous prediction.
iFactory's predictive scrap analytics platform is purpose-built for quality leaders in mining flotation operations — delivering ML-driven grade and recovery forecasts, self-tuning SPC on all key quality characteristics, automated audit documentation, and the reagent optimisation intelligence that reduces cost while improving Cpk simultaneously. Book a Demo to see the platform running on a flotation use case matched to your circuit configuration, or talk to an expert about a free Cpk and audit-readiness assessment for your operation.
Frequently Asked Questions
The Grade Risk That Produced Last Quarter's Scrap Was in Your Process Data Hours Before the Assay Confirmed It. Get a Free Cpk Assessment.
iFactory's predictive scrap analytics platform forecasts flotation grade and recovery risk 2–6 hours ahead, sustains Cpk 1.67+ through ore zone transitions and seasonal variability, and generates the audit-ready quality records that customer and ISO assessors require — all without adding to the quality leader's daily reporting burden.