Mining Crushing AI Quality | Predictive Scrap AI Supervisors
By Grace on June 8, 2026
Scrap in mining crushing is not a material loss line item. It is an energy invoice. Every ton of ore that enters a crusher and exits as off-spec product has already consumed crushing power, conveyor energy, and downstream grinding electricity before anyone discovers it failed to make grade. A SAG mill drawing 14 MW does not distinguish between material that will become concentrate and material that will be discarded as scrap. It grinds both with the same intensity, consuming the same megawatt-hours, until a lab result 45 to 90 minutes later confirms what should have been caught at the feed belt. For the shift supervisor accountable for both throughput targets and energy budgets, the structural inefficiency is the same every shift: conventional quality control detects scrap after energy has already been spent producing it. Predictive scrap analytics changes this by forecasting scrap risk hours before it occurs, so the supervisor adjusts the circuit before the first kilowatt-hour is wasted on material that will never meet specification.
Predictive Scrap Analytics for Mining Crushing
How Supervisors Use Predictive Scrap AI to Cut Energy Use 4-10% in Crushing
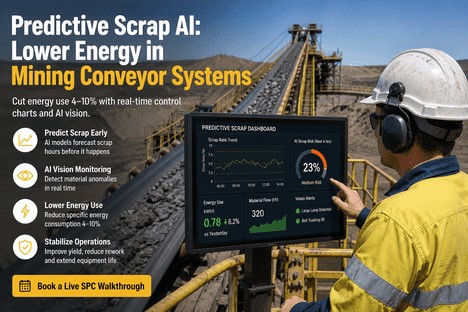
Multivariate ML models forecast scrap risk 4-6 hours ahead. Supervisors adjust feed rate, crusher settings, and blend strategy before energy is consumed on off-spec material. No new sensors, no data science degree required.
Comminution — the crushing and grinding of ore — accounts for 50 to 70 percent of total energy consumption in a typical mineral processing operation. A primary crusher drawing 400 kW, a secondary cone circuit drawing 800 kW, and a SAG mill drawing 12 to 18 MW run continuously, consuming power regardless of whether the material being processed will ultimately meet downstream specifications. When feed variability, hardness spikes, or liner wear produce off-spec material, every kilowatt-hour spent crushing that ton is unrecoverable. The energy cannot be reclaimed. The scrap can only be detected after the fact by a lab assay that arrives 45 to 90 minutes after the material has left the circuit.
A copper concentrator processing 80,000 tons per day with a 2 percent uncaptured scrap rate spends roughly $4.2 million annually in grinding energy alone on material that never reaches the concentrate. Predictive scrap analytics eliminates this expenditure by identifying the specific feed conditions that produce off-spec material before the first kilowatt-hour is consumed on that ton. The shift from post-process discovery to pre-process prevention changes what the supervisor can control and how much energy the operation wastes on scrap.
Reactive Quality Control vs Predictive Scrap Analytics
Reactive Quality Control
Detection
Lab assay confirms scrap 45-90 minutes after material left the crusher
Energy Cost
100% of energy consumed on scrap is unrecoverable before detection
Supervisor Role
Reactive — documents scrap after it occurred, adjusts for next shift
Energy per Ton
Baseline — no mechanism to avoid energy spend on off-spec material
Predictive Scrap Analytics
Detection
ML model forecasts scrap risk 4-6 hours ahead at the feed belt
Energy Cost
Energy diverted before scrap enters the high-power crushing circuit
Supervisor Role
Proactive — adjusts feed, blend, or settings before scrap is produced
Energy per Ton
4-10% reduction through avoided energy spend on forecasted scrap
The Three-Stage Forecast Model
Predictive scrap analytics operates through a three-stage machine learning cycle that runs continuously on the edge processing layer, ingesting crusher sensor data and feed characteristics to forecast scrap risk before material enters the high-energy grinding circuit. The model maintains separate prediction profiles for each scrap type and learns the specific variable combinations that precede each one.
01 Ingest
Model ingests feed characteristics, crusher power draw, closed-side setting, ore hardness indices, moisture content, screen efficiency, and wear liner status from existing SCADA and PLC data streams. No new sensors required.
02 Forecast
Multivariate ML model trained on historical scrap events identifies pattern combinations that precede quality failures. When the model detects a known precursor signature, it generates a scrap risk score 4-6 hours before the event.
03 Act
Supervisor receives a clear risk score and a recommended action: reduce feed rate by 5 percent, increase CSS by 2 mm, or blend in harder ore. The model handles the complexity. The supervisor makes the call.
The multivariate ML model does not treat all scrap as the same problem. It learns the specific combination of feed rate, power draw, closed-side setting drift, and ore hardness that precedes each scrap type. When the model detects a pattern resembling a known scrap precursor, it pushes a risk score and a precise recommended action to the supervisor dashboard — not a general alarm but a specific instruction. The supervisor does not need to be a data scientist. The system tells them what to adjust and by how much.
4-10%
Energy Reduction
4-6 hr
Early Warning
85-95%
Prediction Accuracy
What Predictive Scrap Analytics Changes for the Shift Supervisor
For the shift supervisor, the transition from reactive quality control to predictive scrap analytics transforms the daily experience of managing a crushing circuit. Instead of spending the shift investigating quality deviations that were discovered too late, the supervisor works from a risk forecast dashboard that shows where the circuit is heading, not just where it has been. The control room becomes a prevention centre rather than a reaction centre.
4-6 Hour Scrap Risk Forecast
The supervisor sees a live scrap risk score for the upcoming production window. High-risk feed segments are flagged before they enter the crusher, giving time to adjust blend ratios, reduce feed rate, or redirect material before energy is consumed on off-spec tons.
Actionable Adjustment Recommendations
When scrap risk exceeds threshold, the system recommends a specific parameter adjustment: reduce feed rate by 5 percent, increase CSS by 2 mm, blend in harder ore. The supervisor executes the adjustment with a single dashboard action. No data analysis required.
Energy Tracking per Ton
Specific energy consumption per ton of on-spec product is tracked in real time. The supervisor sees the energy impact of every adjustment made. When scrap risk is avoided, the energy saved is logged and attributed to the corrective action taken.
Closed-Loop Continuous Learning
Every production outcome feeds back into the prediction model. When material meets specification, the energy consumed is logged as efficient. When scrap occurs, the model traces the specific feed and process conditions that produced it and adjusts its forecasts accordingly.
Energy and Scrap Improvement by KPI
Predictive scrap analytics directly improves energy efficiency by preventing energy expenditure on material that will never meet specification. The table below shows the improvement across key performance indicators observed after deploying predictive scrap analytics in crushing and grinding circuits.
KPI
Conventional
Predictive AI
Improvement
Time to Impact
Specific energy consumption
Baseline
90-96%
-4 to -10%
Week 8-12
Scrap detection latency
45-90 min
Sub-second
99.9% faster
Week 1
Uncaptured scrap rate
2-5%
1-2%
-40 to -60%
Week 6-8
Energy per on-spec ton
$4.2M/yr loss*
$2.5M/yr loss*
-$1.7M/yr
Quarter 2
Audit readiness
200+ hrs/audit
Always-ready
-80% labor
Week 4
*Based on a copper concentrator processing 80,000 tons per day with 2% uncaptured scrap rate. Actual values vary by operation.
Before predictive scrap analytics, we were spending roughly $3 million a year in grinding energy on material that never made concentrate grade. The lab would confirm what we already suspected, but by then the energy was already spent. The predictive model gave us a 4- to 6-hour window to adjust feed blend and crusher settings before high-risk material entered the SAG mill. Within 90 days, our specific energy consumption per ton of concentrate dropped by 7 percent. The scrap rate went from 3.8 percent to 1.6 percent. The model paid for itself in energy savings alone within the first quarter.
Shift Supervisor, Copper Concentrator Operation
Deploying Predictive Scrap Analytics on Your Crushing Circuit
Predictive scrap analytics deploys as a software and machine learning layer on top of existing crushing infrastructure. The system integrates with existing SCADA, PLC, and laboratory information systems via OPC-UA and REST APIs without requiring new sensors or control system modifications. The deployment is designed so supervisors see scrap risk forecasts on the dashboard they already use, with no change to their operational workflow.
Weeks 1-2: Connect and calibrate
Data connectivity established to SCADA, PLC, and lab systems. Historical production data ingested. Baseline energy-per-ton and scrap-rate KPIs established. No production interruption during connection.
Weeks 3-6: Model training and shadow mode
Multivariate ML model trained on site-specific scrap event data. Shadow mode runs predictions alongside existing QC. Supervisor reviews risk forecasts against actual outcomes. Model accuracy validated before activation.
Weeks 7-8: Phased activation
Predictive scrap alerts activated for primary crushing circuit. Supervisor acts on risk score recommendations. Energy savings tracked against baseline. Additional circuits activated in sequence.
Week 12+: Full optimization
All circuits on predictive scrap analytics. Model converges on site-specific prediction surface. Energy reduction reaches 4-10% range. Scrap rate stabilises below 2%. ROI achieved within 4-6 months.
From Reactive Quality to Predictive Energy Management
Predictive scrap analytics for mining crushing changes the supervisor's relationship with energy and quality. Instead of discovering scrap after energy has already been wasted, the supervisor sees scrap risk before the material enters the high-power circuit and adjusts the process to prevent it. The 4 to 10 percent energy reduction that operations achieve is not the primary benefit. The primary benefit is that the supervisor can finally manage energy consumption proactively, using the same data that already exists in the plant's control systems, transformed into actionable foresight.
The crushing operations that consistently achieve specific energy consumption below target share a common capability: multivariate ML models that forecast scrap risk hours ahead, trained on their own process data and integrated into the supervisor's existing control interface. That capability is available today as a software layer on existing crushing infrastructure. No new crushers, no control system replacements, no additional sensors. Just the data already flowing through the plant's SCADA system, connected to ML models that turn it into a 4- to 6-hour early warning system for energy waste.
iFactory's predictive scrap analytics platform is purpose-built for mining crushing supervisors. It integrates with existing SCADA and control infrastructure to deliver scrap risk forecasts, actionable adjustment recommendations, real-time energy tracking per ton, and automated audit-ready records without changing the supervisor's workflow or tools.
Start Your Predictive Scrap Analytics Deployment
See How Predictive Scrap AI Can Cut Your Energy Use 4-10%
Get a free energy reduction assessment with a 30-minute walkthrough of iFactory predictive scrap analytics running on your crushing circuit data. We will show you the energy savings your specific operation can achieve.
The model is trained on historical production data linking feed characteristics, process parameters, and quality outcomes. It learns the specific multivariate patterns that precede scrap events — combinations of ore hardness, feed rate, crusher power draw, closed-side setting drift, moisture content, and liner wear state that historically produced off-spec material. When the model detects a similar pattern forming in real-time data, it calculates a scrap probability score for the coming production window. Because the model identifies precursor patterns at the feed stage rather than detecting defects at the discharge, it typically provides 4 to 6 hours of advance warning. This window is sufficient for the supervisor to adjust feed blend, reduce feed rate, or redirect material before energy is consumed on off-spec tons. Book a Demo to see the forecast model running on live crushing circuit data.
The model requires three data categories: feed characteristics (ore type, hardness indices, particle size distribution), process parameters (crusher power draw, closed-side setting, feed rate, screen efficiency, moisture content, wear liner status), and quality outcomes (product size distribution, scrap event logs, concentrate grade). Most modern crushing plants already collect these data points through their SCADA, PLC, and laboratory information systems. iFactory connects to existing data historians and OPC-UA servers without requiring new sensors. A minimum of 90 days of continuous sensor data with corresponding quality results is sufficient for initial model training. Operations with 6 to 12 months of historical data achieve higher accuracy, but iFactory's transfer learning approach allows the model to start generating useful predictions within the first two weeks by leveraging patterns learned from similar crushing circuits. Talk to an Expert about reviewing your plant's data readiness.
Energy reduction is measured as specific energy consumption per ton of on-spec product, comparing a rolling 30-day average against the pre-deployment baseline established during the connect-and-calibrate phase. The metric accounts for both the energy saved by avoiding scrap production and the energy consumed by the AI inference layer itself. iFactory tracks both total energy consumption and energy-per-ton-of-concentrate, ensuring that energy reduction is not achieved at the expense of throughput. Third-party validation can be configured through integration with existing energy metering infrastructure. The 4 to 10 percent range represents the documented performance envelope across mineral processing operations with varying baseline automation levels and circuit configurations. The lower end of the range applies to plants with existing advanced process control; the upper end applies to plants transitioning from manual operation. Book a Demo for a site-specific energy reduction projection.
No. The supervisor interface is designed for the control room, not the data science lab. The dashboard displays a simple scrap risk score — low, medium, or high — with a short recommended action such as reduce feed rate by 5 percent, increase CSS by 2 mm, or blend in harder ore. Supervisors learn to use the system in a single shift. The multivariate ML model handles the complexity of correlating 80 to 150-plus process variables in real time. The supervisor makes the operational decision based on a clear, ranked recommendation. The system also logs every forecast, action taken, and outcome for audit and continuous model improvement without any manual data entry. Talk to an Expert to see the supervisor dashboard configured for your specific crushing circuit.
Energy reduction typically begins within week 6 to 8 of deployment. During weeks 1 through 4, the model trains on historical data and runs in shadow mode. By week 5 to 6, the model achieves sufficient accuracy to generate actionable scrap risk forecasts. As supervisors begin acting on the recommendations — adjusting feed blend, reducing feed rate, or redirecting high-risk material — specific energy consumption per ton of on-spec product starts declining. Most operations achieve 3 to 5 percent energy reduction by week 12, converging toward 4 to 10 percent as the model matures over 90 to 120 days. The full ROI is typically realized within 4 to 6 months, driven by energy savings, scrap reduction from 8-12 percent down to 3-5 percent of throughput, and 20-35 percent labor productivity improvement as supervisors shift from reactive quality inspection to proactive process optimization. A typical mid-size crushing operation processing 5 million tons annually saves between $800,000 and $1.4 million per year. Book a Demo for a personalized ROI calculator based on your operation's throughput and energy data.
Reactive Quality Control Considers Scrap a Material Loss. Predictive Scrap Analytics Treats It as an Energy Invoice.
iFactory predictive scrap analytics for mining crushing operations — ML-powered scrap risk forecasts 4-6 hours ahead, actionable adjustment recommendations, real-time energy tracking per ton, and automated audit records. Purpose-built for shift supervisors in crushing and mineral processing operations.