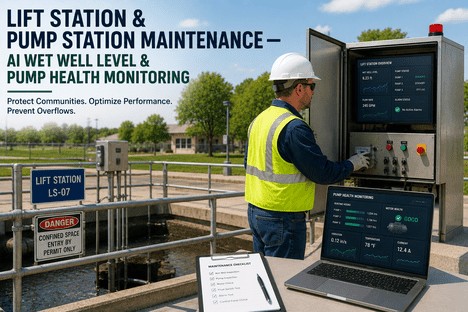
Lift Station & Pump Station Maintenance — AI Wet Well Level & Pump Health Monitoring
By Grace on June 20, 2026
Every wastewater lift station operates under conditions that no industrial pump room would tolerate: submerged in corrosive atmosphere, subject to random debris loading, cycling through wet well levels that vary by the hour, and often located in flood-prone areas where the consequence of failure is measured in environmental damage and regulatory fines. The EPA estimates that 23,000 to 75,000 sanitary sewer overflows occur annually in the United States — the majority originating at lift stations where pump failure, blockage, or control system malfunction turned a preventable mechanical deterioration into a reportable overflow event. Maintenance managers responsible for these assets face a structural problem that manual inspection cycles and threshold-based SCADA alarms cannot solve: bearing temperature rises 4 degrees over baseline for three weeks before a pump seizes, motor current draw increases by 6 percent over the pump curve for days before a VFD fault, and wet well cycle frequency changes subtly for weeks before a check valve fails. These signals exist in the data. What has been missing is the system that reads them as a pattern rather than as isolated fluctuations. AI-powered wet well level monitoring and pump health analytics give maintenance managers predictive lead time measured in days and weeks — not in alarm notifications that arrive after the overflow has started.
23,000–75,000
annual SSO events in the US
EPA estimates of annual sanitary sewer overflows — each a Clean Water Act violation, most caused by pump station failures, blockages, or capacity exceedances at lift stations
$85K–$200K+
cost per reactive failure event
Average total cost of a single reactive lift station failure — including emergency repair at 4.8x planned rates, SSO fines at $25,000 per day, and reporting burden of 40 to 80 staff hours
70–80%
reduction in nuisance alarms
AI baseline models reduce false SCADA alarms compared to threshold-based monitoring — restoring operator confidence in alert systems and eliminating alarm fatigue across the lift station network
14–90
days advance warning
Predictive lead time validated across municipal deployments — AI detects bearing wear, impeller clogging, and motor degradation weeks before failure, enabling planned intervention during normal shift hours
Wet Well Level AI · Pump Health Analytics · SSO Prevention · Condition-Based Work Orders
Your Lift Station SCADA Fires Alarms After the Problem Has Started. AI Reads the Signals Building for Days Before the Alarm Becomes Necessary.
iFactory connects to your existing lift station SCADA via read-only OPC-UA or Modbus, applies AI pattern recognition to pump performance and wet well data in real time, and generates condition-based work orders before any pump station failure disrupts service or causes an overflow event.
The Four Failure Precursors That Every Maintenance Manager Sees in Hindsight — and How AI Catches Them in Real Time
Lift station pumps do not fail without warning. The signals are always present in the operational data — but they are distributed across parameters that no single SCADA threshold alarm is configured to correlate. The bearing temperature that rose 4 degrees over three weeks, the motor current that drifted 6 percent above the pump curve, the wet well that filled 15 minutes faster than the same shift last Tuesday, the pump that short-cycled 37 times before a check valve seized. Each signal individually looks like noise. Together, they form the pattern that AI anomaly detection recognises as the precursor to failure.
01
Bearing Degradation — The 4-Degree Signal That Precedes Every Seizure
Bearing wear is the most predictable mechanical failure mode in lift station pumps, and it follows a consistent thermal signature. A healthy bearing operating in a submersible pump maintains a stable temperature baseline under normal load. As the bearing surface degrades — from abrasive particles in the wastewater, from loss of grease seal integrity, from normal fatigue cycling — friction increases and temperature rises. The increase is small: 2 to 4 degrees above baseline, sustained over days or weeks. A threshold-based SCADA alarm set to trigger at a fixed high-temperature limit catches this signal only when the bearing is already in terminal failure. An AI model that learns the normal thermal operating range for each pump unit detects the upward drift trajectory on day three of a three-week degradation cycle — and generates a bearing inspection work order when the repair is still a planned intervention rather than an emergency replacement.
02
Motor Current Drift — The Pump Curve Deviation That SCADA Does Not Track
Every pump has a manufacturer pump curve that defines the relationship between flow rate, head pressure, and motor current draw. When a pump is operating against a partially blocked impeller, a worn wear ring, or a discharge valve that is not fully open, the motor draws more current than the pump curve predicts for the observed wet well level and discharge pressure. This current deviation develops gradually — a 2 percent increase this week, another 3 percent next week — and is invisible to a SCADA system that only fires an alarm when motor current exceeds the motor nameplate rating. The AI model continuously calculates the expected current for each pump based on its actual operating conditions and flags deviations from the learned pump curve efficiency baseline. In practice, maintenance managers typically receive motor health alerts 14 to 30 days before the deviation reaches a level that would cause a motor overload trip or a VFD fault.
03
Wet Well Level Cycling Anomalies — The Check Valve and Inflow Signal
A lift station wet well fills and empties in a pattern determined by inflow rate, pump start and stop setpoints, and check valve condition. When a check valve begins to fail — debris holding the flapper partially open, hinge wear reducing seal integrity — the pump discharge column drains back into the wet well after each pump stop, causing the wet well level to rise faster than inflow alone would explain. The pump cycles more frequently at the same inflow rate, run times shorten, and starts-per-hour increase. This pattern is one of the earliest detectable signals of check valve degradation, and it appears days before the valve failure would cause a pump to run continuously or a wet well overflow to occur. The AI model establishes each station's normal cycling signature — accounting for diurnal flow variation, day-of-week patterns, and seasonal inflow changes — and alerts the maintenance team when cycle count, run time, or fill rate deviates from the learned baseline.
04
Excessive Pump Cycling and Short Run Events
Pumps that start and stop more frequently than their design cycle rate experience accelerated wear on motor windings (from inrush current heating), contactors, seals, and impeller bearings. A pump designed for 6 to 8 starts per hour that is cycling 14 to 18 times per hour due to wet well level control drift, failed check valves, or inflow changes is accumulating wear at 2 to 3 times the design rate. The AI model tracks starts-per-hour, average run time per cycle, and total runtime accumulation for each pump — and flags stations where cycling frequency exceeds the design specification or has increased significantly from the station's own historical baseline. For maintenance managers managing multiple lift stations across a service area, the cycling anomaly alert is the signal that directs the next preventive maintenance visit to the station with the most urgent developing problem rather than to the station that is due on the calendar.
The Signals That Precede Every Pump Station Failure Are in Your SCADA Data. The Question Is Whether Your System Is Reading Them as a Pattern or Dismissing Them as Noise.
iFactory reads every SCADA data point from your lift stations — temperature, current, level, cycle count, flow, and pressure — and correlates them across time and assets to identify failure trajectories that single-parameter threshold alarms cannot detect.
The AI Lift Station Monitoring Architecture: From SCADA Data to Condition-Based Maintenance
The iFactory platform for lift station monitoring operates in three integrated stages — ingesting raw operational data from existing SCADA and sensor infrastructure, applying AI pattern recognition to identify developing failure modes, and converting detected anomalies into actionable work orders without human intervention at any intermediate step.
Stage 01
Continuous Data Ingestion
iFactory connects to your existing lift station SCADA system via read-only OPC-UA or Modbus — no write-access to control systems, no PLC programming changes, no additional field hardware required for stations with existing level sensors, current transducers, and vibration monitoring. For stations without instrumentation, iFactory integrates with wireless IoT sensor nodes (ultrasonic level sensors, current transformers, accelerometers) that deploy in under 30 minutes per station and transmit data over LTE or LoRaWAN. All incoming data is normalised, timestamped, and streamed into the AI processing pipeline in real time — regardless of whether the data source is a 20-year-old SCADA RTU or a new IoT sensor installation.
Data ingested per station
Wet well level
Pump current draw
Bearing temperature
Run status and cycles
Discharge pressure
Flow rate (if available)
Stage 02
AI Baseline Modelling and Anomaly Detection
The AI model establishes a normal operating baseline for each pump unit over a 7 to 14 day learning period — accounting for influent flow variation, wet well level cycles, seasonal temperature changes, and day-of-week loading patterns specific to each station. Once the baseline is established, the model continuously compares incoming data against the learned profile and generates anomaly scores when any parameter or combination of parameters deviates from expected behaviour. The multi-parameter correlation capability is the critical differentiator from threshold alarms: a 3-degree temperature increase in isolation may not trigger an alert, but a 3-degree increase combined with a 4 percent current draw increase and a 12 percent reduction in pump run time produces a high-confidence bearing degradation alert that no single-threshold system would generate.
Baseline parameters learned
Thermal operating range
Pump curve efficiency
Fill rate by hour/day
Cycle frequency signature
Inflow variation pattern
Seasonal load adjustment
Stage 03
Condition-Based Work Order Generation
When the AI model detects a developing failure trajectory with confidence above a configurable threshold, it automatically generates a condition-based work order in the maintenance management system. The work order includes the asset identification, the detected anomaly category (bearing wear, impeller blockage, check valve degradation, motor overload risk), the sensor data supporting the alert, and a recommended intervention window. Maintenance managers receive a prioritised list of lift station interventions each day — ranked by failure probability and consequence — rather than a calendar-based schedule that treats all stations equally. The model also tracks work order closure and compares post-maintenance operating data against the pre-failure baseline to confirm that the intervention resolved the anomaly. This closed-loop validation is the mechanism that continuously improves prediction accuracy as more maintenance history accumulates.
Work order attributes
Asset and anomaly category
Sensor evidence summary
Priority and intervention window
Pre-staged parts list
Post-repair validation
Compliance audit trail
What the AI Lift Station Dashboard Shows the Maintenance Manager
The maintenance manager's dashboard is designed around the operational questions that determine whether a lift station network stays in continuous service: Which stations need attention today? What is the current health of every pump in the fleet? Where is the next failure most likely to originate? The dashboard consolidates data from every connected lift station into a single view that surfaces the answers without requiring the manager to navigate station-by-station.
Station View 01
Fleet-Wide Pump Health Scoreboard
Every monitored lift station pump is displayed with a live health score from 0 to 100 — calculated from current anomaly status, trend trajectory, and time since last maintenance. Pumps with scores below the warning threshold are flagged in red and sorted to the top of the list. Maintenance managers see the fleet status in a single glance: how many pumps are healthy, how many are trending toward a maintenance event, and how many require immediate intervention. Clicking any pump displays the detailed trend chart for each monitored parameter — temperature, current, cycle count, fill rate — with the anomaly window highlighted for rapid diagnosis.
Station View 02
Wet Well Level Trend and Overflow Risk Score
A real-time view of wet well level for each station with three overlaid data series: the current level trace, the AI-predicted level for the next 6 hours based on inflow trend and pump status, and the historical average level for the same time-of-day and day-of-week. When the predicted level approaches the overflow threshold and pump capacity is insufficient to keep pace, the station is flagged with an overflow risk score. The risk score combines current level, inflow rate, available pump capacity, and weather forecast data to give maintenance managers a quantitative measure of overflow probability — not a binary alarm that fires only after the level has already reached a critical threshold.
Station View 03
Anomaly Timeline and Correlation Matrix
Every detected anomaly across the lift station fleet is displayed on a shared timeline, colour-coded by category (bearing, current, cycling, level, pressure). The correlation matrix view shows which anomalies occurred simultaneously or in sequence across multiple stations — enabling identification of system-wide issues such as inflow surges affecting a basin, power quality events affecting multiple VFDs, or seasonal patterns that drive maintenance seasonality. A maintenance manager who sees that six stations in the same pressure zone all show increasing cycling frequency in the same week has discovered a system-level finding that would be invisible in station-by-station alarm logs.
Station View 04
Condition-Based Work Order Queue
AI-generated work orders are displayed in a prioritised queue sorted by failure probability, consequence severity, and recommended intervention window. Each work order includes the anomaly type, the sensor data that triggered it, the pump health trend chart, and a pre-populated parts and tools list based on the detected failure mode. Maintenance managers review the queue each morning and dispatch crews to the stations with the highest risk scores — rather than following a fixed preventive maintenance schedule that sends crews to healthy stations while developing failures go unnoticed at the stations not due for inspection until next quarter.
Station View 05
Energy Consumption and Pump Efficiency Trending
Energy consumption per million gallons pumped is tracked for each lift station and displayed as a trend line. Pumps that are consuming more energy per unit of flow than their baseline — due to wear, blockage, or incorrect VFD settings — are flagged for efficiency review. Utilities using AI-driven pump monitoring typically document 15 to 18 percent reductions in energy costs through early detection of efficiency degradation and optimisation of pump scheduling. The efficiency view also identifies pumps that are running in parallel against closed discharge valves, pumps with failed check valves causing recirculation, and stations where wet well level setpoint adjustment could reduce cycling frequency without affecting system performance.
Station View 06
EPA Compliance and SSO Prevention Record
Every sensor reading, anomaly detection event, generated work order, and completed maintenance intervention is automatically logged with timestamps and asset context — creating a continuous compliance record that demonstrates proactive pump station management to EPA inspectors. The SSO prevention record shows every instance where an AI-detected anomaly led to a preventive intervention that avoided a potential overflow event, with the estimated consequence of the prevented failure calculated from station capacity, wet well level at detection time, and pump degradation trajectory. This record is the documentation that distinguishes a utility with a proactive predictive maintenance programme from one that is reacting to failures and reporting them after the fact.
"
We manage over 500 wastewater pumping stations, and our maintenance was calendar-based — every station got the same inspection frequency regardless of condition. The problem was that stations developing problems between inspections were invisible to us until a pump failed or an overflow occurred. The AI monitoring system changed this completely. Within the first three months, it identified a developing bearing failure at a station that was not due for inspection for another six weeks — the bearing temperature trend had been climbing for 12 days before the system generated an alert. We replaced the pump as a planned intervention during normal shift hours. The total cost was under $2,000. The previous time we replaced the same pump model in an emergency, the cost exceeded $18,000 including overtime, emergency parts delivery, and the SSO reporting burden. The model paid for itself with that single intervention.
Lift station maintenance is not constrained by a lack of data. It is constrained by a lack of pattern recognition across the data that already exists in every SCADA system, every motor control centre, and every wet well level transmitter in the collection system. Bearing temperature trends, motor current deviations, wet well cycling anomalies, and pump curve efficiency losses all precede pump failures — but they precede them by days and weeks, not by minutes and hours. Threshold-based SCADA alarms that fire after the temperature exceeds the absolute limit or the level reaches the overflow point are documenting a failure that was developing for days before the alarm was capable of detecting it. The maintenance manager who reviews the morning SCADA alarm log is seeing the consequences of failures that the data should have predicted before they occurred.
AI-powered lift station monitoring closes this prediction gap. Continuous data ingestion from existing SCADA and IoT sensors feeds a machine learning model that learns the normal operating signature of every pump in the fleet — not generic industry benchmarks, but station-specific baselines that account for each pump's unique loading conditions, flow patterns, and environmental exposure. When any parameter or combination of parameters deviates from the learned baseline in a pattern consistent with known failure modes, the system generates a condition-based work order with days to weeks of advance warning. The utilities that have deployed this capability — including Houston, Yorkshire Water, Winter Haven, and Vordingborg Forsyning — are documenting 70 percent reductions in SSO events, 60 to 80 percent reductions in nuisance alarms, and maintenance cost savings that shift the cost profile from emergency-dominated to planned-dominant within the first year of operation.
iFactory's AI lift station monitoring platform is designed for maintenance managers responsible for keeping wastewater pumping stations in continuous service without the staff hours required to manually trend every parameter at every station. Book a Demo to see the platform configured for your lift station fleet size and pump types, or talk to an expert about a free pump health assessment and SSO risk evaluation for your collection system.
Frequently Asked Questions
The platform is designed to work with existing SCADA infrastructure first. For lift stations with SCADA-connected level sensors, motor current transducers, pump run status contacts, and flow meters — which covers the majority of municipal pump stations installed or upgraded in the last 15 years — iFactory reads data directly from the existing SCADA system via read-only OPC-UA or Modbus connection. No additional sensors, no PLC programming changes, and no modifications to the control system are required. For stations that lack instrumentation — typically smaller or older stations with float-switch-only level control and no motor monitoring — iFactory integrates with wireless IoT sensor nodes (ultrasonic level sensors, current transformers, vibration sensors) that can be deployed in under 30 minutes per station with no conduit, no trenching, and no confined space entry. These nodes transmit data over LTE or LoRaWAN networks and typically operate for 5 to 10 years on internal batteries. Talk to an expert to determine which stations in your fleet require additional sensors and which can connect directly through your existing SCADA system.
The initial baseline learning period is 7 to 14 days of live operating data per pump station. During this period, the model observes normal operating conditions across the full range of flow variation — diurnal peaks and troughs, weekday versus weekend patterns, and any pump lead/lag rotation cycles. After the initial learning period, the model begins generating anomaly alerts, but the baseline continues to refine over the first 6 to 8 weeks as it incorporates more data and captures a wider range of operating conditions, including seasonal flow changes. The model also retrains continuously as new data accumulates — typically on a 6-week cycle — so the baseline adjusts to gradual changes in pump performance, wet well conditions, and station loading patterns. This means that a pump that is operating with a slightly elevated but stable temperature baseline will not generate false alerts once the model has learned that the new higher temperature is the pump's normal state. Book a Demo to see baseline learning curves from comparable lift station deployments.
The model distinguishes between temporary anomalies and developing failure modes by analysing three dimensions of the deviation simultaneously: magnitude, duration, and correlation across parameters. A rain event that increases wet well inflow by 200 percent for 4 hours will produce a level and flow anomaly that is high in magnitude but short in duration, and it will return to baseline when the rain passes. A developing bearing failure produces a temperature increase that is small in magnitude per hour but sustained across days or weeks, and it is accompanied by correlated changes in motor current and vibration. The multi-parameter correlation is the key differentiator: a temporary inflow surge affects level and flow but does not affect bearing temperature or pump current draw relative to the pump curve. The system also integrates hyperlocal weather forecast data — rainfall, temperature, and groundwater level — as contextual inputs, so an anomaly that coincides with a forecasted storm is evaluated differently from the same anomaly occurring during dry weather. This contextual awareness is what enables the 70 to 80 percent nuisance alarm reduction that utilities document after AI baseline maturity. Talk to an expert about configuring weather integration and anomaly sensitivity thresholds for your service area.
iFactory integrates directly with existing CMMS platforms — including its own built-in maintenance management module and third-party systems commonly used by municipal water and wastewater utilities. When the AI model detects a developing failure trajectory and generates a condition-based work order, the work order is created directly in the CMMS with all relevant data pre-populated: asset identification, anomaly category, sensor evidence summary, priority level, recommended intervention window, and pre-staged parts list. The maintenance manager reviews and dispatches work orders through the same interface they already use for scheduled preventive maintenance. The integration also works in reverse: when a work order is closed in the CMMS, the platform automatically compares post-repair operating data against the pre-failure baseline to confirm that the anomaly was resolved. This closed-loop validation is critical for continuous model improvement — each completed intervention provides a confirmed case of a specific anomaly pattern leading to a specific failure mode, which the model uses to refine its prediction accuracy for similar patterns in the future. Book a Demo to see the platform integrated with your current CMMS and work order management workflow.
The Data That Predicts Every Pump Station Failure Already Exists in Your SCADA System. AI Is the Missing Pattern Recogniser. Get a Free Pump Health Assessment and SSO Risk Evaluation.
iFactory's AI lift station monitoring platform — continuous wet well level analysis, pump health anomaly detection, condition-based work order generation, and EPA compliance record automation — built for maintenance managers who need to keep wastewater pumping stations running without relying on calendar-based schedules that miss developing failures between inspection cycles.