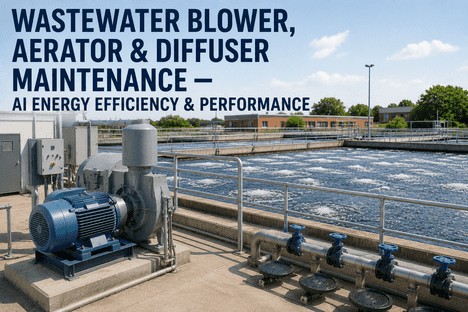
Wastewater Blower, Aerator & Diffuser Maintenance — AI Energy Efficiency & Performance
By Grace on June 20, 2026
Every wastewater treatment plant runs on air. The blowers, aerators, and diffusers that deliver oxygen to the biological treatment zone are simultaneously the most critical assets for effluent compliance and the largest single consumer of electricity on site. Aeration alone consumes 40 to 60 percent of a typical WWTP's total energy budget. For a 10 MGD activated sludge plant spending $400,000 annually on power, that is $160,000 to $240,000 per year flowing through the blower room. The reliability engineer responsible for these assets operates between two equally expensive failure modes: unscheduled blower downtime that forces the plant into emergency oxygen deficit and permit violation risk. The diffuser system that silently degrades across years of service, gradually increasing backpressure and blower power draw, until the energy waste compounds into tens of thousands of dollars per year. In an industry where the average treatment plant runs its aeration blowers 24 hours per day, 365 days per year, the gap between a well-maintained aeration system and a degraded one is visible in every monthly utility bill and every effluent compliance report. This gap is where AI-driven maintenance intelligence transforms the reliability engineer's ability to predict, prevent, and optimise.
Blower Reliability · Diffuser Fouling Detection · Aerator Performance Monitoring · AI Energy Intelligence
The Blowers Run 24/7. The Diffusers Degrade Invisibly. The Energy Waste Compounds Silently. AI Gives the Reliability Engineer Visibility Into All Three.
iFactory's AI-powered maintenance intelligence platform monitors blower efficiency trends, detects diffuser fouling progression, predicts aerator mechanical failures, and quantifies energy waste from aeration system degradation — across single plants or entire utility networks. Built for reliability engineers who need to reduce unplanned downtime, optimise maintenance intervals, and control the 40 to 60 percent of plant energy that flows through the blower room.
Of total WWTP energy consumed by aeration blowers and diffusers — making the aeration system the single largest target for maintenance-driven energy optimisation
20–35%
Energy savings achievable through combined AI-driven maintenance optimisation — from diffuser cleaning schedules, blower VFD tuning, and predictive failure avoidance
2–4x
Payback acceleration when AI-based condition monitoring replaces calendar-based maintenance programmes for aeration assets — documented across municipal and industrial WWTPs
$180K+
Annual OPEX savings documented from a single WWTP by combining AI aeration optimisation with predictive maintenance — energy reduction plus avoided emergency repair cost
The Three Aeration Assets That Reliability Engineers Cannot Afford to Treat Separately
Blowers, aerators, and diffusers form an interdependent system where degradation in one component forces compensatory behaviour in the others. A fouled diffuser increases system backpressure, forcing the blower to work harder and consume more energy per unit of oxygen delivered. A blower with worn bearings or misaligned coupling operates at reduced efficiency, requiring longer run times to meet DO setpoints. An aerator drive with failing gearbox lubrication produces uneven oxygen distribution, causing some zones to over-aerate while others remain oxygen-deficient. Traditional maintenance programmes that treat these assets as independent work streams miss the system-level interactions that drive the majority of energy waste and unplanned downtime. The reliability engineer who can monitor all three assets as an integrated system gains visibility that individual equipment inspections cannot provide.
The Aeration System Interdependency — How Degradation in One Asset Cascades Through All Three
Reduced volumetric output at same power draw, increased energy per SCFM, cascading load to parallel blowers, eventual trip or failure that forces emergency DO deficit
Diffuser
Biofouling, inorganic scaling, membrane wear, pore blockage, physical damage from solids or debris
Increased backpressure forces blower to work harder (higher power draw), reduced oxygen transfer efficiency (OTE) means more air required to meet DO, uneven distribution across basin
Aerator Drive
Gearbox wear, coupling misalignment, shaft bearing degradation, motor insulation breakdown, mechanical seal failure
Uneven oxygen distribution across basin zones, motor current imbalance signalling imminent failure, vibration damage transmitted to mounting structure, catastrophic gearbox failure causing extended downtime
What AI Maintenance Intelligence Reveals That Traditional Monitoring Misses
Conventional condition monitoring for rotating equipment relies on vibration analysis, temperature trending, and oil analysis — each producing valuable but siloed data that the reliability engineer must mentally integrate into a coherent asset health picture. AI-powered maintenance intelligence adds a dimension that these individual techniques cannot provide: cross-correlation of equipment condition data with process performance data to isolate the root cause of degradation that manifests as an energy or compliance symptom. When blower power draw increases by 8 percent over twelve weeks, the reliability engineer needs to know whether the cause is diffuser fouling (requiring a basin drain-down and cleaning), blower inlet filter clogging (requiring a filter change), or bearing wear progression (requiring a planned rebuild). Each cause demands a different maintenance response, and each misdiagnosis wastes maintenance budget while the actual degradation continues.
Detection Capability 01
Diffuser Fouling Progression Tracking — Detection Before It Costs 15 Percent of Blower Energy
Energy Waste Prevention
Diffuser fouling is the most common cause of aeration energy waste in municipal WWTPs, yet it is rarely detected until energy consumption has already increased 10 to 20 percent above baseline. The conventional detection method — manual measurement of oxygen transfer efficiency using off-gas testing — is performed quarterly or less frequently at most plants, meaning fouling can progress for months before it is quantified. AI-based detection uses continuous monitoring of blower-specific power (kW per SCFM), system backpressure trends relative to airflow, and DO control valve position drift to identify fouling onset within days. The model learns each diffuser grid's baseline hydraulic signature through the first 90 days of operation and flags deviations that indicate pore blockage, membrane stiffening, or solids accumulation. Plants using this approach report detecting diffuser fouling an average of 6 to 8 weeks earlier than quarterly off-gas testing would have identified it — enabling cleaning schedules that maintain oxygen transfer efficiency above 95 percent of design and avoid the 12 to 18 percent energy waste that develops between quarterly inspections.
Continuous backpressure trend monitoring
Blower-specific power degradation detection
Condition-based cleaning schedule optimisation
Detection Capability 02
Blower Bearing and Rotor Health Prediction — 4 to 6 Weeks of Lead Time Before Failure
Failure Prevention
Blower failures are among the highest-impact unplanned events in wastewater treatment. A single 200 HP centrifugal blower failure on a 10 MGD activated sludge plant can reduce aeration capacity by 25 to 40 percent, forcing operators to load parallel blowers beyond their best efficiency point and increasing energy cost by 15 to 20 percent until the failed unit is returned to service. AI-powered predictive models trained on vibration spectra, motor current signature, bearing temperature, and lubrication pressure trends detect bearing wear and rotor imbalance 4 to 6 weeks before conventional alarm thresholds are breached. The model learns the normal vibration envelope for each blower at every operating speed and load condition, then identifies deviations that correlate with incipient failure modes documented across thousands of rotating equipment operating hours in wastewater applications. For reliability engineers managing multi-blower installations with duty-standby configurations, the lead time enables planned changeovers and rebuild scheduling during low-load periods rather than emergency shutdowns during peak wet weather events.
Multi-parameter vibration anomaly detection
Motor current signature failure prediction
Planned rebuild scheduling with lead time
Detection Capability 03
Aeration Energy Intensity Benchmarking — Quantifying Dollar Waste Per Asset, Per Zone, Per Shift
Energy Intelligence
Most reliability engineers know that aeration is the largest energy consumer on site. Fewer can answer the question that determines whether maintenance intervention is economically justified: how many dollars is this specific asset wasting right now? AI-powered energy intensity benchmarking calculates the actual energy consumption per kilogram of oxygen delivered for each blower, each diffuser zone, and each aerator drive in real time — compared against the design baseline for that specific asset. When a positive displacement blower installed in 2018 is consuming 18 percent more energy per SCFM than its sister unit installed in 2022, the maintenance action is clear: investigate inlet filter condition, assess VFD tuning status, and schedule a wear assessment. The dollar value of that 18 percent waste is calculated automatically and presented as a maintenance justification metric that the reliability engineer can use directly in the work order priority queue. This capability transforms energy data from a monthly reporting number into a continuous maintenance decision input.
Real-time kW per SCFM per asset tracking
Maintenance justification in dollar terms
Sister-unit efficiency comparison
Detection Capability 04
DO Control System Degradation Analysis — When Your Control Valves and Sensors Are Costing More Than You Think
Control Loop Health
The dissolved oxygen control system is the bridge between aeration equipment performance and treatment process outcomes. When DO sensors drift out of calibration, control valves stick or respond non-linearly, or PID loop tuning degrades as basin hydraulics change over years of operation, the reliability engineer sees the symptom in blower energy data but not the root cause. AI analysis of DO control loop performance — comparing setpoint to actual DO response time, valve position versus commanded position, and sensor drift trends across redundant instruments — identifies control system degradation that energy trending alone cannot isolate. In documented deployments, DO sensor drift of 0.3 mg/L was detected by the AI model 11 days before the scheduled quarterly calibration check, preventing 14 days of over-aeration that would have consumed an estimated $3,200 in excess energy. For reliability engineers managing multi-basin plants with dozens of DO sensors and control valves, automated detection of instrumentation degradation eliminates the gap between calibration cycles where most control-related energy waste occurs.
DO sensor drift and calibration need detection
Control valve response linearity monitoring
PID loop degradation trend analysis
Asset Health Prediction · Energy Waste Detection · Maintenance Optimisation · Cross-Asset Correlation
Calendar-Based Blower and Diffuser Maintenance Is Replaced by Condition-Based Intervention — Detected by AI, Scheduled by the Reliability Engineer, Verified by Energy Data.
iFactory's AI maintenance intelligence platform connects to existing SCADA, PLC, and sensor infrastructure — monitoring blower efficiency, diffuser condition, aerator drive health, and DO control loop performance in a single integrated view. The reliability engineer shifts from calendar-based work packages to data-driven intervention timing, justified by energy impact and validated by measurable equipment performance recovery.
The Maintenance Intelligence Dashboard — What the Reliability Engineer Sees
The dashboard is the reliability engineer's single-view command centre for aeration system health. Every view is generated from real-time sensor data cross-correlated with equipment history, maintenance records, and energy consumption. The goal is not to present more data — most plants already have abundant data. The goal is to present the specific decision-quality information that tells the reliability engineer where to intervene, what to do, and what the economic justification is for doing it.
Six Dashboard Views That Transform Aeration Maintenance From Reactive to Predictive
View 01
Blower Fleet Health Overview
Every blower in the plant displayed with its current health score (0 to 100), energy efficiency deviation from baseline, predicted remaining useful life, and a maintenance priority ranking. Colour-coded alerts flag units that have crossed the energy waste threshold or show incipient failure indicators. The reliability engineer can see the entire blower fleet condition in one glance and drill into any unit for detailed vibration spectra, bearing temperature trends, and lubrication analysis integration.
View 02
Diffuser Zone Condition Map
A visual map of every diffuser grid in the aeration basin, colour-coded by estimated fouling level based on backpressure trend, airflow distribution, and DO control response. Zones approaching the cleaning threshold are flagged with the estimated energy waste in dollars per month. The map enables the reliability engineer to prioritise cleaning schedules by economic impact rather than by calendar interval, directing maintenance resources to the zones where fouling is costing the most energy.
View 03
Aeration System Energy P&L
A live profit-and-loss statement for the aeration system showing actual energy consumption versus the design baseline for each asset group — blowers, diffuser zones, aerator drives. The Energy P&L translates efficiency deviation into dollar terms: blower A is 11 percent over baseline, costing $470 per month in excess energy; diffuser zone 3 is 16 percent over baseline, costing $310 per month. The total aeration system energy waste is calculated and displayed as a single metric that the reliability engineer can use to prioritise maintenance investments.
View 04
Failure Prediction Timeline
A rolling 90-day forecast showing every aeration asset with a predicted failure probability above the threshold. Each asset is plotted on a timeline with the estimated failure date range, the confidence interval, and the recommended maintenance action. The reliability engineer uses this view to plan rebuilds, order spare parts, and schedule changeovers well in advance of predicted failure events. The timeline updates every shift as new sensor data refines the prediction models.
View 05
Maintenance Intervention Effectiveness Tracker
After each maintenance intervention — a diffuser cleaning, a blower rebuild, a DO sensor recalibration — the dashboard tracks the measured recovery in energy efficiency, DO control stability, and equipment health score. The reliability engineer sees whether the intervention achieved the expected improvement, whether the energy waste has been eliminated, and whether any secondary degradation was uncovered during the work. This feedback loop closes the gap between maintenance activity and maintenance outcome that is invisible in traditional work order systems.
View 06
Multi-Plant Comparison View
For reliability engineers managing multiple WWTPs across a utility network, the multi-plant comparison view displays aeration system KPIs for every plant on a single screen — blower fleet health score distribution, energy intensity per million gallons treated, diffuser zone condition by plant, and maintenance cost per unit of oxygen delivered. Plants with below-median performance are flagged for investigation, and the reliability engineer can drill into any plant to identify the specific assets driving the underperformance.
We were running a quarterly diffuser cleaning schedule because that was what the original equipment manufacturer recommended. The AI platform showed us within the first sixty days that two of our six diffuser zones were fouling at twice the rate of the others. The fast-fouling zones were adjacent to the inlet channel where solids loading was highest. We were cleaning all six zones on the same schedule — two zones were overdue by six weeks, and four zones were being cleaned before they needed it. The energy waste from the two fouled zones was costing us approximately $1,800 per month in excess blower power. We shifted to condition-based cleaning triggered by the AI backpressure trend, and we recovered 14 percent of aeration energy within the first cleaning cycle. The quarterly schedule was wrong for every zone. We just did not have the data to know it.
— Reliability Engineer, Municipal Utility District — 200 MGD Combined Treatment Capacity, 14 Years
Why AI Maintenance Intelligence for Aeration Assets Is Different From Process Optimisation
It is important to distinguish between AI-driven process optimisation and AI-driven maintenance intelligence because they solve different problems with different data inputs and different economic justifications. Process optimisation adjusts aeration setpoints in response to changing influent loading to minimise energy consumption at current equipment condition. Maintenance intelligence detects and predicts degradation in the equipment itself to restore baseline performance through targeted intervention. Both are valuable and both reduce energy consumption, but the failure to distinguish them leads to a common management error: expecting an optimisation platform to compensate for degraded equipment that should be maintained. An AI aeration optimisation system running on a plant with fouled diffusers, worn blower bearings, and drifting DO sensors will achieve meaningful energy reductions from setpoint optimisation, but it will be optimising an inefficient system. The maintenance intelligence layer that detects the fouling, predicts the bearing failure, and identifies the sensor drift — and allows the reliability engineer to restore the equipment to design condition before optimisation is applied — captures the additional 10 to 25 percent energy savings that optimisation alone cannot reach.
Conclusion
The aeration system is the largest energy consumer in every wastewater treatment plant and the most maintenance-intensive asset group in the process train. The blowers that deliver air, the diffusers that transfer oxygen, the aerator drives that distribute it, and the DO control systems that regulate it form an interdependent system where degradation in any component increases energy consumption, reduces treatment reliability, and accelerates wear in the other components. Calendar-based maintenance programmes developed for average conditions on average equipment cannot keep pace with the variability introduced by changing influent loads, seasonal temperature shifts, aging infrastructure, and the inevitable divergence of manufacturer specifications from field conditions. The reliability engineer who manages these assets is constrained by a maintenance information gap: the equipment produces the data that would enable condition-based intervention, but the systems that collect that data — SCADA historians, vibration monitoring platforms, maintenance management systems, energy billing databases — do not communicate with each other in a way that yields actionable maintenance intelligence.
iFactory's AI maintenance intelligence platform closes that gap. By connecting to existing plant data infrastructure and applying machine learning models trained on the specific relationships between equipment condition and process performance across thousands of operating hours, the platform gives the reliability engineer continuous visibility into blower efficiency degradation, diffuser fouling progression, aerator drive health, and DO control loop performance. The output is not another dashboard of raw data. It is a prioritised, economically justified set of maintenance actions that tell the reliability engineer exactly where to intervene, what the intervention will cost, and how much energy it will recover. The energy savings are documented and auditable. The failure predictions are early enough to enable planned intervention. The maintenance effectiveness is measured and fed back into the model.
Talk to an expert about deploying AI maintenance intelligence across your blower, aerator, and diffuser fleet, or book a demo to see the aeration system maintenance dashboard configured for your plant's specific asset configuration and data environment.
Frequently Asked Questions
The core data requirements fall into three categories. Equipment condition data: blower vibration (accelerometers mounted on bearing housings), motor current draw per phase, bearing temperature, discharge pressure and temperature, inlet filter differential pressure, and lubrication system parameters. Process data: dissolved oxygen per aeration zone, airflow rate per blower (SCFM or Nm3/h), blower kW power consumption, DO control valve position, and basin dissolved oxygen profile. Maintenance history: work order records, parts replacement history, cleaning schedules, and oil analysis results. Plants typically already collect 60 to 80 percent of this data through existing SCADA systems, online instrumentation, and CMMS records. The AI model begins generating usable detection insights within approximately 30 days of data ingestion, with accuracy improving as the model learns plant-specific degradation patterns and equipment signatures. Talk to an expert to review your plant's existing sensor coverage and identify any instrumentation gaps that would enhance detection capability.
This is a critical diagnostic distinction that the AI model is specifically designed to make. The model cross-correlates three parameter groups to isolate the root cause of increased blower power. For diffuser fouling: the characteristic signature is a gradual increase in discharge pressure relative to airflow (system curve shift upward), combined with stable or slightly declining motor current at the same blower speed. For blower mechanical degradation: the signature is increased motor current without corresponding pressure increase (internal efficiency loss), combined with vibration spectrum changes in characteristic frequency bands. For control system issues: the signature is DO sensor drift combined with valve position drift and stable or declining backpressure. The model maintains separate baseline profiles for each potential degradation mode and continuously updates its confidence in the diagnosis as additional data accumulates. When the confidence level exceeds the configurable threshold, a maintenance recommendation is generated with the estimated root cause, supporting data traces, and the quantified energy impact. Book a demo to see the diagnostic differentiation in action with your plant's data.
Yes. The AI model is technology-agnostic and adapts to the specific operating characteristics of each blower type. Centrifugal blowers are modelled with their characteristic curves — the relationship between discharge pressure, airflow, and power consumption across the operating range. Positive displacement blowers are modelled with their volumetric efficiency curves and the system curve they operate against. Rotary lobe blowers are modelled with their specific leakage and thermal characteristics. The model learns each blower's normal operating envelope from its first 90 days of data and detects deviations specific to its technology type. For example, centrifugal blower surge detection (a critical failure precursor that is invisible to conventional monitoring) uses the model's learned relationship between discharge pressure and minimum airflow at each operating speed. The platform also handles mixed-fleet configurations where a plant operates centrifugal blowers for base load and positive displacement blowers for trim or backup duty. Talk to an expert to discuss your specific blower fleet configuration and data environment.
ROI depends on plant size, current maintenance practices, and existing equipment condition, but documented returns across municipal WWTP deployments show a consistent pattern. Energy savings alone typically range from 12 to 22 percent of aeration energy consumption through improved maintenance timing and diffuser cleaning optimisation. For a 10 MGD plant spending $400,000 annually on total energy with aeration at 50 percent, that is $24,000 to $44,000 per year in recovered energy. Avoided failure costs add significantly: a single unplanned blower failure that requires emergency rebuild at premium labour rates and expedited parts delivery can cost $30,000 to $80,000 depending on blower size and configuration. Extended equipment life from condition-based maintenance adds additional value — blower overhauls shifted from calendar-based to condition-based intervals can extend major rebuild cycles by 20 to 40 percent, reducing annualised capital expenditure. Combined across these three value streams, documented deployments on plants from 5 to 50 MGD show simple payback periods of 8 to 18 months. Book a demo to generate an ROI projection based on your plant's specific energy consumption, blower inventory, and historical failure data.
Calendar-Based Maintenance Catches Failures After the Energy Is Already Wasted. Condition-Based Maintenance Catches Degradation While There Is Still Time to Act. AI Maintenance Intelligence Gives You the Lead Time.
iFactory's AI-powered maintenance intelligence for wastewater blowers, aerators, and diffusers — predictive failure detection, diffuser fouling progression tracking, aeration energy waste quantification, and condition-based maintenance scheduling. Built for reliability engineers who manage the assets that consume 40 to 60 percent of every WWTP energy budget.