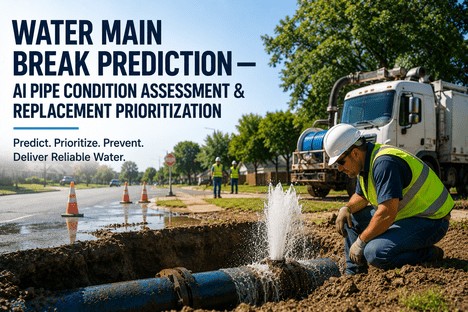
Water Main Break Prediction — AI Pipe Condition Assessment & Replacement Prioritization
By Grace on June 19, 2026
Two hundred and sixty thousand water main breaks occur every year across the United States and Canada. Each one costs an average of $10,000 in direct repairs, but the real expense — emergency crew mobilisation, road closures, property damage claims, lost water revenue, and reputational harm — can multiply that figure by three to five times before the asphalt is patched. For the reliability engineer responsible for a distribution network of hundreds or thousands of miles, the question is never whether a main will break. The question is which one, when, and whether the capital plan has the budget to replace it before the break happens. Most replacement programmes today rely on pipe age as the primary risk indicator. Age is not a predictor of failure — it is a proxy for uncertainty. AI-driven pipe condition assessment replaces that uncertainty with measured risk, ranked by predicted failure probability across every pipe segment in the network. This is the reliability engineer's guide to deploying it.
Failure Probability Scoring · Condition-Based Prioritisation · AI-Ranked Capital Planning · Audit-Ready Risk Records
Reliability Engineers Who Predict Pipe Failure Before It Happens Replace One-Third the Mileage at One-Quarter the Emergency Cost. AI Condition Assessment Makes the Difference.
iFactory's AI pipe condition assessment platform delivers probability-of-failure scores for every pipe segment in your network — using pipe material, age, soil chemistry, break history, pressure transient data, and environmental factors — so you can prioritise replacements based on predicted risk instead of reactive emergency spend.
Water main breaks annually in the US and Canada — representing $2.6 billion in direct repair costs and more than 2 trillion gallons of treated drinking water lost each year
97%
AI failure prediction accuracy achieved by machine learning models analysing pipe material, age, soil conditions, break history, and pressure data across distribution networks
77%
Reduction in annual pipe replacement costs achieved when AI risk models replace age-based replacement programmes — documented in municipal utility deployments
$452B
Estimated shortfall for replacing water mains that have exceeded their useful lives — 20% of all installed pipe, or 452,000 miles, is beyond its design life
The Reliability Engineer's Core Problem: Age-Based Replacement Is a Guessing Game with a $2.6 Billion Annual Price Tag
The standard approach to pipe replacement prioritisation in most water utilities today follows a simple rule: replace the oldest pipes first. Age-based prioritisation assumes a direct correlation between pipe age and failure probability — an assumption that research has consistently disproven. A 40-year-old ductile iron pipe in non-corrosive soil with stable pressure conditions may have decades of useful life remaining. A 15-year-old cast iron pipe in aggressive clay soil with repeated pressure transients may fail within the next operating year. Age alone cannot distinguish between these two cases. The consequence of age-based prioritisation is that utilities spend有限的 capital replacing pipes that are old but not at immediate risk of failure, while pipes in high-risk environments fail without warning — generating emergency repair costs that are three to five times higher than planned replacement, causing service disruptions, property damage, and regulatory scrutiny. The 2023 Utah State University water main break study documented this structural failure of the age-based approach: 260,000 breaks per year, $2.6 billion in annual repair costs, and a $452 billion replacement backlog for pipes already beyond their useful lives.
Four Reasons Pipe Age Alone Cannot Predict Failure — and Why AI Condition Assessment Replaces Guesswork with Measured Probability
01
Pipe Material Dictates Failure Mode — Not Age
Cast iron fails by graphitic corrosion and ring fracture, ductile iron by corrosion pits and through-wall perforation, PVC by longitudinal cracking under pressure surge, asbestos cement by wall softening in acidic soil. Each material has a distinct failure mechanism triggered by specific environmental and operational conditions — not by a calendar date. The USU study found PVC has the lowest break rate across all pipe materials, while cast iron and asbestos cement account for the highest. A material-blind age-based programme cannot differentiate between a PVC pipe with 70 years of remaining life and a cast iron pipe at the same age that has already exceeded its statistical failure point.
AI fix: Material-specific failure models assign risk based on known deterioration curves for each pipe type.
02
Soil Chemistry Accelerates Corrosion by Orders of Magnitude
Seventy-five percent of US utilities report corrosive soil conditions, according to the USU study. Ductile iron pipe has over six times more failures in highly corrosive soils compared to low corrosive soils. The same pipe at the same chronological age installed in adjacent streets with different soil types will have radically different effective lifespans. Age-based replacement programmes treat both pipes identically. AI condition assessment incorporates soil resistivity, pH, chloride content, moisture, and redox potential — the electrochemical parameters that actually drive corrosion rate — into the failure probability calculation for each pipe segment individually.
AI fix: Soil corrosivity scores are layered onto asset records, modifying failure probability by local environmental conditions.
03
Pressure Transients — The Invisible Fatigue Mechanism That Age-Based Models Miss Entirely
Every pump start, valve closure, and hydrant opening sends a pressure wave through the distribution system. These transients, often exceeding twice the normal operating pressure, subject pipe walls to cyclic fatigue loading that accumulates over time. Two pipes installed in the same year on the same street can have profoundly different fatigue exposure based on their proximity to pump stations, PRVs, and high-demand customers. Age-based models have no mechanism to account for this. AI models that ingest pressure data from SCADA and transient monitoring stations can calculate fatigue accumulation per pipe segment and adjust failure probability accordingly.
AI fix: Pressure transient frequency and magnitude data are ingested as a fatigue loading variable in the failure model.
04
Break History Creates Recurrence Patterns That Predict Next-Failure Location
A pipe that has broken once is statistically more likely to break again. Recurrence patterns are not random — they follow spatial and temporal clustering driven by the same corrosion, fatigue, and soil conditions that caused the original failure. The USU study documented that overall failure rates have decreased by 20% since 2018, correlating with reduced inventory of high-break-rate materials like cast iron and asbestos cement. This confirms that material-specific replacement driven by break data produces measurable results. Age-based models do not incorporate recurrence patterns. AI models trained on break history data learn the recurrence signature for each pipe material and condition class, assigning elevated probability to pipes exhibiting early warning indicators.
AI fix: Break recurrence modelling captures spatial and temporal clustering patterns and factors them into segment-level failure probability.
When the Replacement Programme Runs on Pipe Age, Emergency Repairs Run the Budget. AI Condition Assessment Closes the Gap Between Capital Spend and Actual Risk.
iFactory builds the distinction between chronological age and effective remaining life directly into the failure prediction model — so reliability engineers receive a ranked replacement list based on measured failure probability, not a spreadsheet sorted by installation year.
The AI Pipe Condition Assessment Architecture for Distribution Reliability Engineers
The iFactory AI pipe condition assessment platform operates as a three-layer decision intelligence system — failure probability modelling at the pipe segment level, replacement prioritisation at the network level, and capital planning optimisation at the programme level. Each layer answers a distinct question that the reliability engineer needs to answer continuously: which pipes are most likely to fail, in what order should they be replaced, and what is the most cost-effective replacement schedule given the available capital budget.
Layer 01
Failure Probability Scoring
AI model assigns a failure probability to every pipe segment
The failure probability layer ingests all available data for each pipe segment in the distribution network — material type, installation year, diameter, length, soil type, soil resistivity, pH and chloride content, break history with dates and failure modes, pressure transient data from SCADA, proximity to pump stations and PRVs, and environmental factors including freeze-thaw cycles and groundwater levels. The ML model processes these inputs at the individual pipe segment level and outputs a probability-of-failure score for each segment. The model is trained on historical data that pairs known break events with the pipe and environmental conditions present at the time of failure, learning the multivariate failure signature for each material class. The City of Kitchener study demonstrated that random forest models achieve 97.3% accuracy and that more than 72% of breaks could have been prevented by monitoring and upgrading only 8% of the network.
Multivariate failure modelling
Material-specific deterioration curves
Soil corrosivity integration
Layer 02
Replacement Prioritisation Ranking
Ranked list of pipes by combined failure probability and consequence of failure
The prioritisation layer takes the failure probability score from Layer 01 and multiplies it by the consequence of failure score for each pipe segment — a calculated value that accounts for pipe diameter (larger mains serve more customers), pipe criticality (transmission mains versus distribution mains), proximity to critical facilities (hospitals, schools, fire stations), road classification (traffic disruption cost), and customer impact (number of service connections affected by a shutdown). The result is a business risk score that ranks every pipe segment in the network by the combined probability and impact of failure. This replaces the traditional approach of sorting the replacement list by pipe age with a risk-based ranking that the reliability engineer can use to defend budget allocation decisions in rate cases and capital planning reviews.
Business risk scoring (LoF x CoF)
Customer impact weighting
Rate case defensibility data
Layer 03
Capital Planning Optimisation
Optimal replacement schedule constrained by available capital budget
The capital planning layer takes the ranked replacement list from Layer 02 and applies budget constraints, replacement cost estimates, and multi-year planning horizons to produce an optimised replacement schedule. The optimisation engine identifies the set of pipe replacements that minimises total expected failure cost (emergency repairs + social costs + property damage) over the planning period given the available capital budget. This is the decision-support capability that moved a major US utility from $90 million in annual pipeline replacement costs to $20 million — a 77% reduction — while simultaneously achieving a four-fold reduction in failures, as documented in Xylem's published case study. The optimised schedule accounts for the fact that replacing a high-risk pipe today at planned replacement cost is almost always cheaper than repairing the same pipe in an emergency event tomorrow at three to five times the cost.
Budget-constrained optimisation
Multi-year replacement planning
Total cost of failure minimisation
What the AI Pipe Condition Assessment Dashboard Shows the Reliability Engineer
The reliability engineer's view of the AI condition assessment platform is not a data science tool — it is a capital planning interface designed around the decisions the engineer makes every day. The dashboard presents the distribution network as a single-screen risk surface, showing which pipe segments are at highest failure probability, what the consequence of failure would be, and what the optimised replacement schedule looks like at the current year's budget allocation.
Reliability View 01
Network Risk Surface — Failure Probability by Pipe Segment
A colour-coded geospatial view of the entire distribution network where every pipe segment is shaded by its predicted failure probability — from low risk in blue through moderate in yellow to critical in red. The reliability engineer sees the network risk position at a glance: how many miles of pipe are in each risk tier, what material classes dominate the high-risk tier, and what the combined failure probability trend is across the system. Clicking any segment expands the risk detail — the material, age, soil conditions, break history, pressure exposure, and the individual factor contributions to the failure probability score.
Reliability engineer action: High-risk segments are flagged for condition assessment or replacement within the current planning cycle.
Reliability View 02
Risk Rank — Prioritised Replacement List by Business Risk Score
Every pipe segment in the network is ranked by its business risk score — failure probability multiplied by consequence of failure — and displayed as a sorted list from highest to lowest. The risk rank table shows the segment ID, location, material, diameter, installation year, failure probability score, consequence score, and business risk score for each segment. The reliability engineer can filter by material type, diameter range, geographic zone, or risk tier. The risk rank is the primary input to capital planning: replacing pipes from the top of the list produces the greatest risk reduction per dollar spent.
Reliability engineer action: Top-ranked segments move into the replacement project pipeline for the current budget cycle.
Reliability View 03
Capital Plan Optimiser — Budget-Constrained Replacement Schedule
The optimiser takes the risk-ranked list and the available capital budget for the current and projected years, then calculates the optimal set of pipe replacements that minimises total expected failure cost over the planning period. The reliability engineer can adjust budget scenarios — what happens to total failure risk if the budget is cut by 10% next year, or increased by 25% through a rate adjustment. Each scenario returns a projected risk trajectory showing whether the network risk profile is improving, holding steady, or deteriorating under that budget assumption. This is the analytical basis for defending capital budget requests in council presentations and rate case filings.
Reliability engineer action: Scenario analysis supports budget defence. Risk trend projection demonstrates need for sustained capital investment.
Reliability View 04
Break Pattern Analysis — Recurrence Mapping by Material and Zone
Historical break data is mapped spatially and temporally to reveal recurrence patterns that inform both the failure probability model and the replacement strategy. The reliability engineer can view break clusters by material type, pipe diameter, soil corrosivity zone, or pressure management zone. The pattern view shows whether break rates are declining in zones where pipes have been replaced, whether certain material classes show increasing break frequency in specific soil conditions, and whether operational changes such as pressure reduction have reduced break incidence in targeted zones. This view makes the connection between capital investment and risk reduction measurable and visible.
Reliability engineer action: Break trend analysis validates or challenges current replacement strategy and material selection decisions.
Reliability View 05
Model Accuracy Dashboard — Actual vs Predicted Break Comparison
The model accuracy view compares predicted failure probabilities against actual break events over a configurable trailing window — typically 12 to 24 months. The dashboard shows the precision-recall curve, the false positive rate, and the percentage of actual breaks that occurred in the top-risk tiers. This is the dashboard that validates the model's operational value: if 80% of actual breaks occur in the top 15% of the risk-ranked list, the model is correctly focusing replacement resources on the pipes that present the highest real failure risk. The accuracy dashboard updates automatically as new break data is recorded, providing continuous validation of the model's predictive performance.
Reliability engineer action: Validate model accuracy quarterly. Model retrained automatically as new break data accumulates.
Reliability View 06
Audit Export — Condition Assessment Records in One Click
Every piece of documentation required for regulatory audits, rate case filings, and capital planning reviews is generated automatically — the failure probability model methodology description, the data inputs and sources, the risk score calculation for each pipe segment, the replacement prioritisation ranking with justification, and the capital plan scenario analysis. The export covers any date range, geographic zone, or risk tier the auditor specifies. The model methodology record — which documents every variable in the failure model, its source, its statistical weight, and its contribution to the probability calculation — is the record that demonstrates the condition assessment programme is defensible, data-driven, and auditable. Audit preparation drops from weeks of manual data compilation to a single export.
Reliability engineer action: Export full condition assessment audit package on demand. No manual data compilation required.
"
Our replacement programme was organised by pipe age — oldest first, regardless of condition, material, or soil environment. We were spending $90 million a year replacing pipes that were old but not necessarily at risk, while breaks continued in younger pipes installed in corrosive soils that the age-based model never flagged. The AI condition assessment programme changed our understanding of where the real risk was. Within six months of deployment, the risk-ranked list showed us that 60% of our expected break cost was concentrated in pipes that were younger than the system median age — pipes our old programme would not have reached for another decade. The optimised replacement plan let us reallocate budget to those high-risk segments. Our annual replacement cost dropped to $20 million, and break frequency fell by a factor of four. The difference was not more money. The difference was knowing where the risk actually was.
— Reliability Engineer, Metropolitan Water Utility — 4,200-Mile Distribution Network, 1.5 Million Service Connections
Conclusion
Water main break prediction is not a data science exercise — it is a capital allocation problem. When the replacement programme runs on pipe age, capital is spent on pipes that are old but not necessarily at risk, while the pipes that present the highest actual failure probability remain in service until they break in an emergency that costs three to five times more than planned replacement. The structural inefficiency of age-based prioritisation is baked into every utility that uses installation year as the primary replacement criterion: the $452 billion replacement backlog is the accumulated cost of not knowing which pipes are actually at risk.
AI pipe condition assessment replaces chronological age with measured failure probability. The evidence base is established and growing. The City of Kitchener study demonstrated 97.3% prediction accuracy and found that 72% of breaks could be prevented by monitoring just 8% of the network. The Xylem and Esri partnership case study documented a 77% reduction in annual replacement spend and a four-fold reduction in failures. The Water Main Break Prediction AI market is projected to grow from $2.7 billion in 2025 to $8.9 billion by 2034 — a 14.2% CAGR — driven by utilities that recognise age-based models are no longer defensible in rate cases, regulatory audits, or capital planning reviews.
The reliability engineers achieving the documented outcomes in the upper range of this market shift are the ones who deployed multivariate failure modelling early, integrated soil corrosivity and pressure transient data into their risk models, and used the capital plan optimiser to convert risk-ranked pipe lists into defensible budget requests and measurable break reduction results. iFactory's AI pipe condition assessment platform is designed for reliability engineers who need to defend every dollar of the replacement budget with data, not assumptions. Book a Demo to see the platform configured for your distribution network data and pipe material profile, or talk to an expert about a free failure risk assessment and capital planning review for your water distribution system.
Frequently Asked Questions
The model initialises using whatever data is available in your existing asset management and GIS systems — pipe material, installation year, diameter, length, and location are the minimum set. Break history records, soil data, and pressure transient information are valuable additions that improve model accuracy, but the model is designed to work with incomplete data by using statistical inference methods that the research community has validated across multiple utility deployments. The City of Kitchener study, for example, achieved 97.3% accuracy using condition score, pipe length, and criticality score as the most influential factors. For utilities with limited break history records, the model can be supplemented with national average break rate data by material class and age cohort from the USU study database. The model deploys in shadow mode first — generating probability scores alongside your existing replacement prioritisation process — allowing the reliability engineering team to validate the model's rankings against actual break events before relying on the output for capital planning decisions. Shadow mode typically runs for 3 to 6 months. Talk to an expert about configuring the data readiness assessment for your utility's existing data environment.
The model uses a hydraulic network surrogate approach to estimate pressure transient exposure at every pipe segment based on available SCADA pressure data at key points in the distribution system. Using the network topology, pipe dimensions, and operational data from pump stations and pressure reducing valves, the surrogate model calculates the probability of transient exposure at each segment — accounting for proximity to transient sources, pipeline profile, and system demand patterns. This approach has been validated against field measurements in multiple distribution networks and provides reliable transient exposure estimates even in networks with limited pressure monitoring coverage. For utilities with advanced pressure monitoring infrastructure, the model can ingest high-resolution transient data directly, further improving the accuracy of the fatigue loading calculation. The surrogate model is recalibrated automatically as new pressure data becomes available. Book a Demo to see how the hydraulic surrogate model is configured for your network topology and SCADA data environment.
The optimiser runs a Monte Carlo simulation that generates thousands of possible future break scenarios based on the failure probability distribution for each pipe segment. Each scenario produces a different set of break events, emergency repair costs, and social costs over the planning period. The optimiser selects the replacement schedule that produces the lowest expected total cost (planned replacement + emergency repairs + social costs) across all simulated scenarios. The reliability engineer sees not just the optimal schedule but the confidence interval around the expected cost — showing the range of possible outcomes and the probability that the recommended plan will stay within budget. Replacement cost estimates are input as ranges rather than fixed values, and the optimiser accounts for cost escalation, inflation, and the cost differential between planned replacement and emergency repair. The scenario analysis capability lets the engineer test how sensitive the optimal plan is to changes in cost assumptions, budget levels, and break rate projections — providing the analytical depth required for rate case filings and capital planning committee presentations. Talk to an expert about configuring the Monte Carlo parameters for your utility's risk profile and budget cycle.
The platform is designed as an integration layer that connects to existing systems rather than replacing them. GIS data provides the pipe segment inventory with spatial attributes. CMMS data provides break history, maintenance records, and replacement cost data. SCADA systems provide pressure and flow data. The platform ingests data from these sources through standard API connectors, CSV/Shapefile imports, or direct database connections — whichever integration method aligns with your utility's IT infrastructure and data governance policies. The platform maintains its own risk model database that is updated automatically as new data flows in from source systems. Outputs — failure probability scores, risk rankings, capital plans — can be exported back into GIS for map visualisation, into CMMS for work order generation, and into reporting systems for regulatory filings and rate case documentation. The platform includes a data quality dashboard that flags missing, inconsistent, or outdated data records and tracks data completeness by attribute and geographic zone over time. Book a Demo to see the integration architecture configured for your specific GIS, CMMS, and SCADA platform environment.
The Age of Age-Based Replacement Is Over. AI Condition Assessment Knows Which Pipes Will Fail Next. Get a Free Failure Risk Assessment and Capital Planning Review.
iFactory's AI pipe condition assessment platform for reliability engineers — failure probability scoring by pipe segment, business risk-based replacement prioritisation, budget-constrained capital plan optimisation, and audit-ready risk documentation generated automatically from the distribution data your utility already maintains.